
Research article · 2026 · Full text
International Journal of Agriculture and NutritionA Study on Seed Storability Parameters Shoot Length, Root Length And Seed Drying Weight of Soybean As Influenced By Different Methods of Threshing and Processing
Volume 8(5) · Pages 64–67 · DOI: 10.33545/26646064.2026.v8.i5a.642 ↗
Research areasAgricultural Engineering and MechanizationSeed Germination and PhysiologySoybean genetics and cultivation
Abstract
Author-writtenAn experiment was conducted to study The seed storability of soybean is influenced by different methods of threshing and processing was studied at the Department of Seed Science and Technology, College of Agriculture, Raichur under ambient conditions. The experiment was conducted in laboratory using Factorial Completely Randomized Design with three replications. The shoot length showed significant differences as influenced by different threshing methods, processing operations and their interaction effects at different months of storage period significantly lowest shoot length was recorded in T3 (11.64 cm), P1 (12.31 cm) and T3P1 (11.36 cm). Further the study shows that, the root length showed significant differences as influenced by different threshing methods, processing operations and their interaction effects at different months of storage period, the highest shoot length was recorded in T1 (14.86 cm), P3 (14.31 cm) and T1P3 (15.05 cm) The results of seedling dry weight as influenced by different threshing methods, processing operations and their interaction effects at different months of storage period Whereas, initially higher seedling dry weight was recorded in T1 (614.93 mg) and P3 (611.43 mg) and T1P3 (618.50 mg).
Summary
Source-checkedPlain-language reading of the full paper, prepared with AI and checked against the text. Each point links to the authors' own words.
Why it matters
- Soybean is a globally significant oilseed crop and annual legume valued for its nutritional properties and diverse industrial applications. View evidence ↗
- Maintaining soybean seed quality during storage is difficult because the seeds have poor storability and are highly susceptible to mechanical damage. View evidence ↗
- The thin seed coat of soybeans provides minimal protection for the radical, making mechanical damage a primary cause of quality loss. View evidence ↗
The question
- The study aimed to determine how different threshing and processing methods influence the storability of soybean seeds. View evidence ↗
What they did
- The research used a Factorial Completely Randomized Design with three replications, conducted under ambient conditions at the College of Agriculture, Raichur. View evidence ↗
- Three threshing methods were tested: a multi-crop thresher at 300 rpm (T1), a multi-crop thresher at 500 rpm (T2), and a combine harvester (T3). View evidence ↗
- Three processing operations were used: an air screen cleaner (P1), an air screen cleaner with a gravity separator (P2), and an air screen cleaner with both gravity and spiral separators (P3). View evidence ↗
- The study measured several parameters, including shoot length, root length, seedling dry weight, germination, and enzyme activities. View evidence ↗
What they found
- Shoot length decreased over nine months of storage; the T1P3 combination maintained the highest length (initially 16.44 cm, ending at 13.54 cm), while T3P1 had the lowest (initially 13.79 cm, ending at 11.36 cm). View evidence ↗
- Root length also declined during storage; after nine months, the highest root length was found in T1 (14.86 cm), P3 (14.31 cm), and T1P3 (15.05 cm), with the lowest in T3P1 (12.62 cm). View evidence ↗
- Seedling dry weight decreased over time, with the T1P3 combination remaining the highest (initially 618.50 mg, ending at 594.07 mg) and T3P1 the lowest (initially 595.70 mg, ending at 572.17 mg). View evidence ↗
What it means
- The authors conclude that using a multi-crop thresher at 300 rpm combined with air screen, gravity, and spiral separation (T1P3) is the most effective method for maintaining seed quality, likely due to reduced mechanical damage. View evidence ↗
Visual summary
3 visualsIllustrations explain the paper; charts are replotted from the paper's own table values.
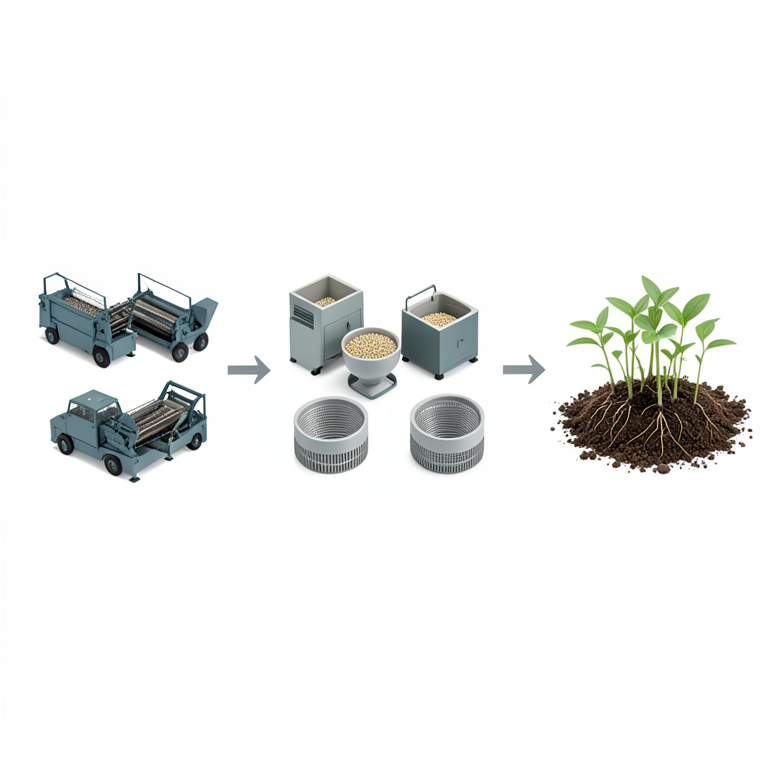
Soybean Processing Workflow
AI-generated conceptual illustration (Soybean seeds and agricultural processing machinery). It explains the idea and does not show study data.
View source evidence ↗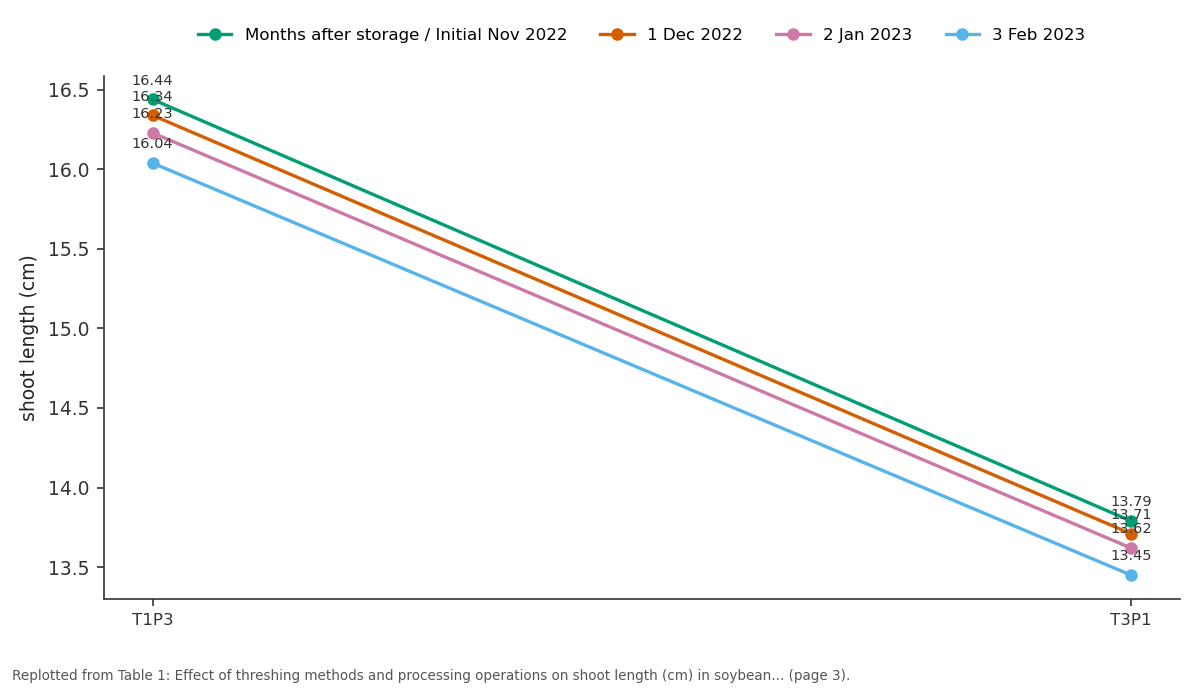
Months after storage / Initial Nov 2022 and 1 Dec 2022 and more: T1P3 vs T3P1
Replotted from Table 1 (page 3) of the original paper. Every bar is the paper's own table value.
View source evidence ↗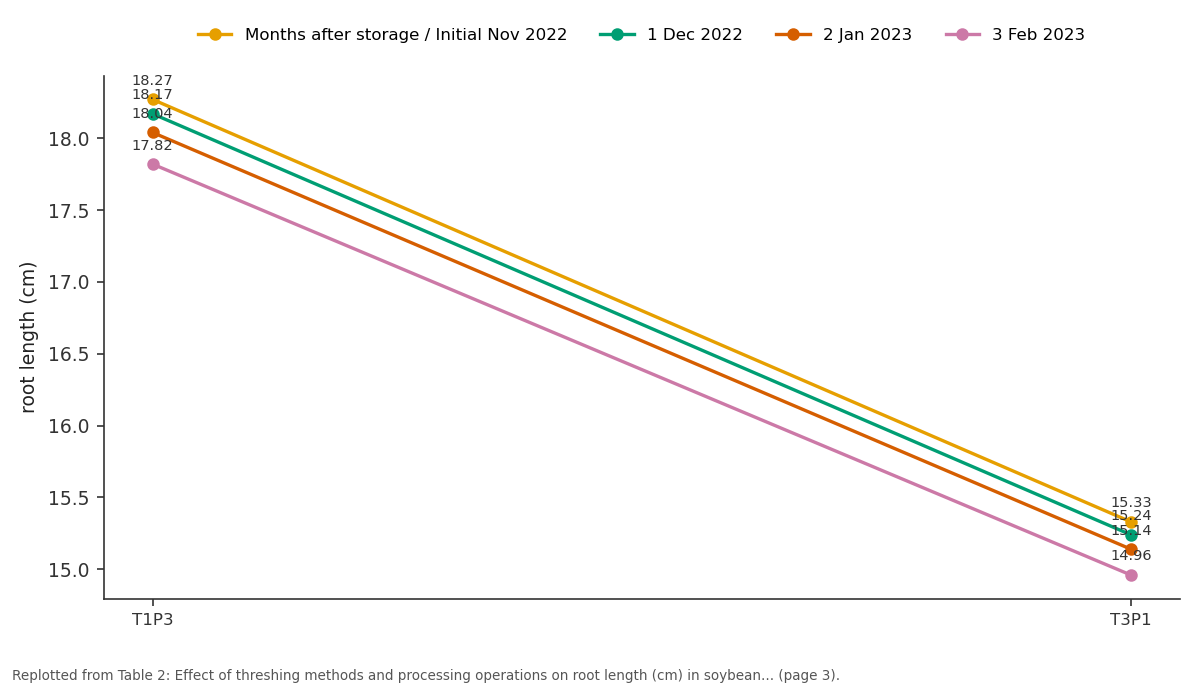
Months after storage / Initial Nov 2022 and 1 Dec 2022 and more: T1P3 vs T3P1
Replotted from Table 2 (page 3) of the original paper. Every bar is the paper's own table value.
View source evidence ↗Figures & tables
From the original paper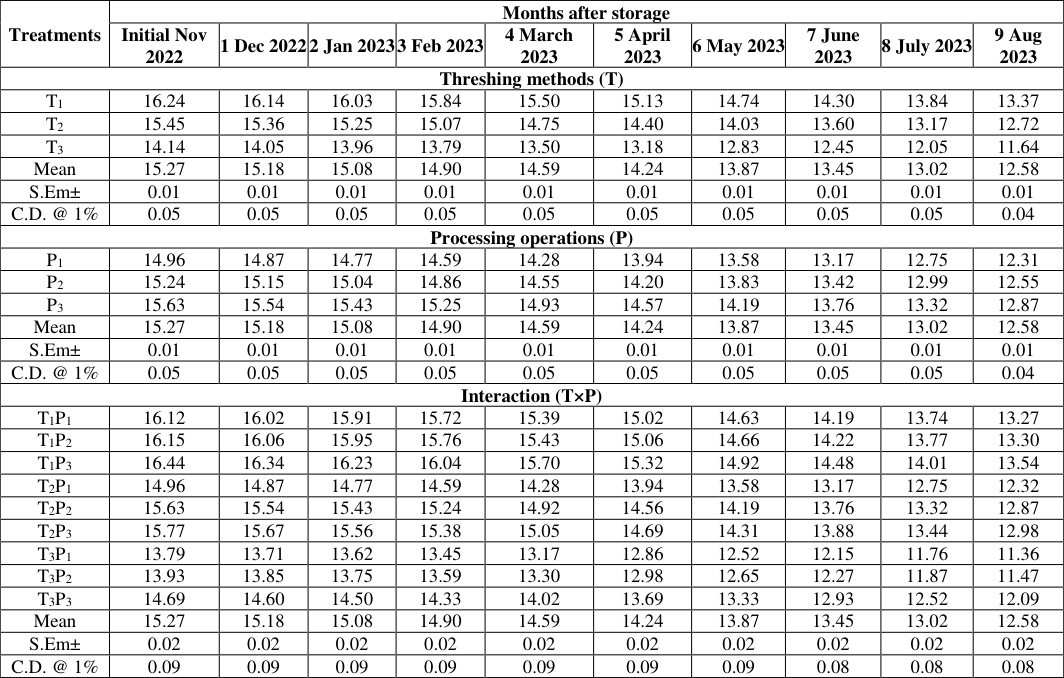 Table 1
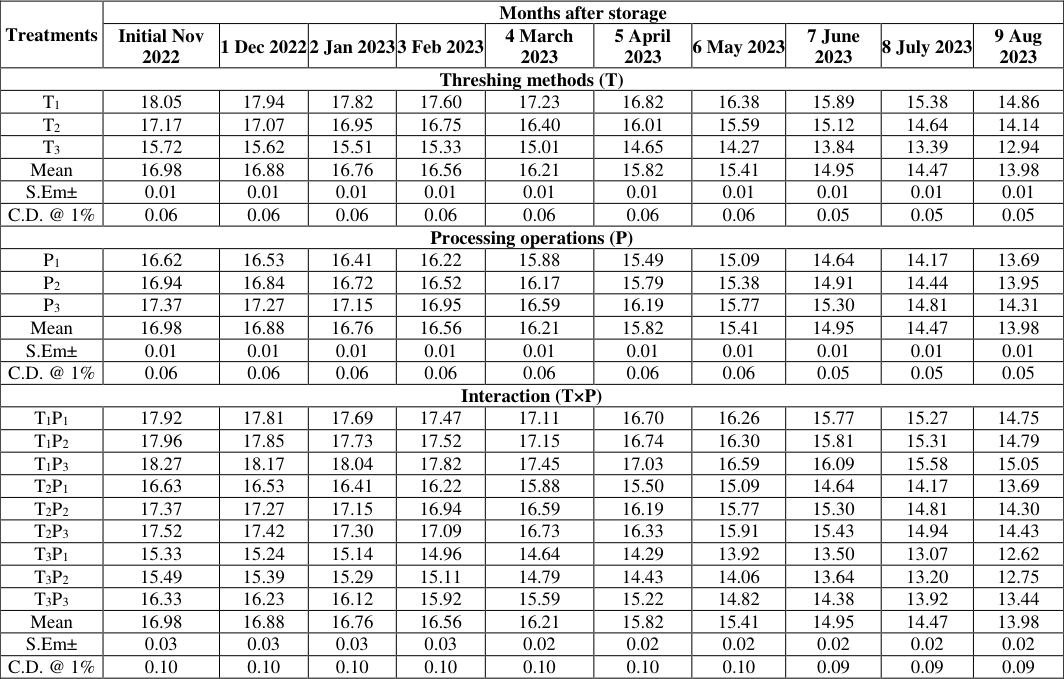 Table 2
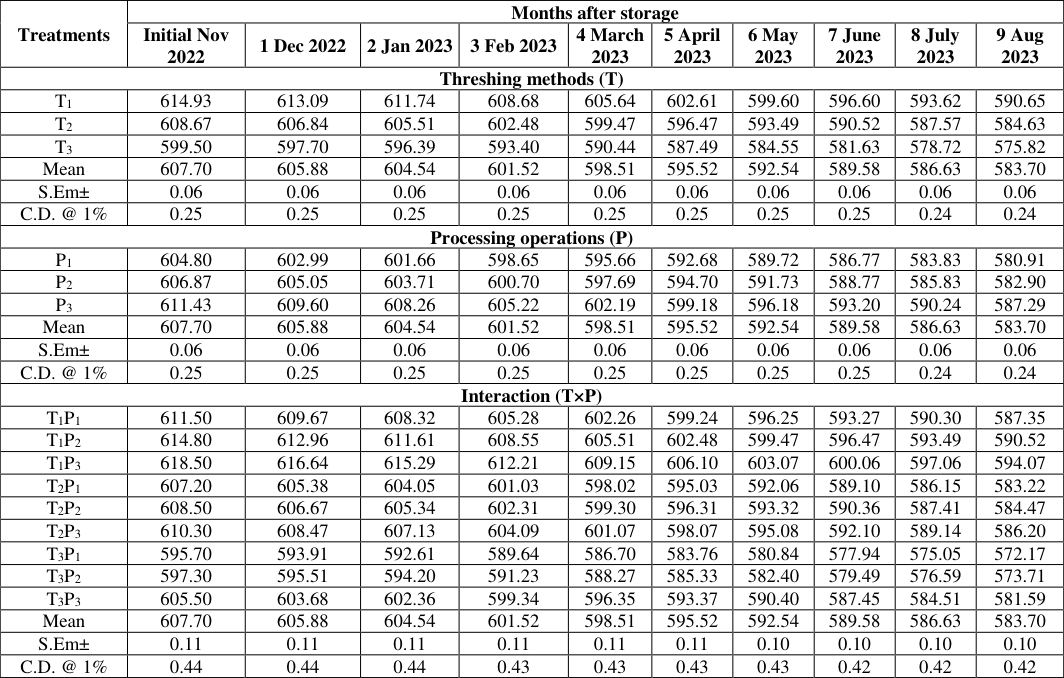 Table 3
Introduction
Soybean [Glycine max (L.) Merrill] has gained significance throughout the world as an important oil seed crop and an annual legume because of its wide range of geographic adaptation, distinctive chemical composition, high nutritional value with functional health benefits and numerous applications in the food and related industries. It is a multipurpose legume rich in both protein and oil content with the ability to resolve food and nutritional security in developing countries hence considered as "Golden bean". Soybean ranks first in the international market among the world's major oil seed crops (FAO, 2020). It accounts for 42 per cent of overall oilseed production, 22 per cent of total oil production and 2/3 rd of the global protein concentrates for livestock feeding. Soybean was also named as "wonder crop" or "Miracle crop" as its seed contains diverse nutritional characteristics such as 20 per cent oil with 85 per cent unsaturated fatty acids including 55 per cent poly unsaturated fatty acids (PUFA), 40 per cent good quality protein, antioxidants, 4-5 per centminerals and 25-30 per cent carbohydrates. It is mostly grown in kharif season on black cotton soils and gathered seed is stored till the next year for sowing, which is a challenging operation due to its poor storability. Therefore, the significant barrier to the soybean production each year is the nonavailability of high quality seed for farmers. Due to the fact that soybean seed is a poor storer and is more susceptible to mechanical damage from harvest to the following sowing season, maintaining seed quality after harvest and during storage is a major challenge. The postharvest processing of soybean seed includes threshing, drying, grading, transportation, various handling processes, and storage. Because of its very thin seed coat and low lignin International Journal of Agriculture and Nutri tion 2026; 8(5 ): 64-67 content, soybean seed is regarded as a poor store because it loses its viability and vigour at a faster rate as a result of loss of seed membrane permeability. Mechanical damage is the main cause of this loss of soybean seed quality because the seed's thin seed coat offers little protection to the delicate radical, which is located in a vulnerable position directly beneath the seed coat (Alvarez et al. 1997) [1]
Material and Methods
The seeds obtained by use of different threshing methods viz., T1, Multi-crop thresher with 300 rpm; T2, Multi-crop thresher with 500 rpm and T3, Threshing by combine harvester and same seeds as per assigned treatments subjected to processing operations viz., P1, Air screen cleaner; P2, Air screen cleaner followed by gravity separator; and P3, Air screen cleaner followed by gravity separator and spiral separator were stored small gunny bags and placed in the seed storage cabinet at the Department of Seed Science and Technology, College of Agriculture, Raichur under ambient conditions. These seeds were used for further testing of seed quality parameters. The experiment was conducted in laboratory using Factorial Completely Randomized Design with three replications. The seeds were used for recording parameters viz., 100 seed weight, bulk density, seed germination, shoot length, root length, seedling dry weight, seedling vigour index -I, seedling vigour index -II, electrical conductivity, dehydrogenase enzyme activity and peroxidase activity. All of the above parameters were recorded for every month, with the exception of peroxidase and dehydrogenase enzyme activity, which were recorded every three months.
Results and Discussion
Results and Discussion
The shoot length showed significant differences as influenced by different threshing methods, processing operations and their interaction effects at different months of storage period are presented in Table 1. The shoot length decreased with the advancement of storage period in all the treatments. Whereas, initially highest shoot length was recorded in T1 (16.24 cm), P3 (15.63 cm) and T1P3 (16.44 cm) and lowest was in T3 (14.14 cm), P1 (14.96 cm) and T3P1 (13.79 cm). At the end of nine months of storage period, highest shoot length was recorded in T1 (13.37 cm), P3 (12.87 cm) and T1P3 (13.54 cm) while, significantly lowest shoot length was recorded in T3 (11.64 cm), P1 (12.31 cm) and T3P1 (11.36 cm).
| Treatments | Months after storage | — | — | — | — | — | — | — | — | — |
|---|---|---|---|---|---|---|---|---|---|---|
| Initial Nov 2022 | 1 Dec 2022 | 2 Jan 2023 | 3 Feb 2023 | 4 March 2023 | 5 April 2023 | 6 May 2023 | 7 June 2023 | 8 July 2023 | 9 Aug 2023 | |
| Threshing methods (T) | ||||||||||
| T1 | 16.24 | 16.14 | 16.03 | 15.84 | 15.50 | 15.13 | 14.74 | 14.30 | 13.84 | 13.37 |
| T2 | 15.45 | 15.36 | 15.25 | 15.07 | 14.75 | 14.40 | 14.03 | 13.60 | 13.17 | 12.72 |
| T3 | 14.14 | 14.05 | 13.96 | 13.79 | 13.50 | 13.18 | 12.83 | 12.45 | 12.05 | 11.64 |
| Mean | 15.27 | 15.18 | 15.08 | 14.90 | 14.59 | 14.24 | 13.87 | 13.45 | 13.02 | 12.58 |
| S.Em± | 0.01 | 0.01 | 0.01 | 0.01 | 0.01 | 0.01 | 0.01 | 0.01 | 0.01 | 0.01 |
| C.D. @ 1% | 0.05 | 0.05 | 0.05 | 0.05 | 0.05 | 0.05 | 0.05 | 0.05 | 0.05 | 0.04 |
| Processing operations (P) | ||||||||||
| P1 | 14.96 | 14.87 | 14.77 | 14.59 | 14.28 | 13.94 | 13.58 | 13.17 | 12.75 | 12.31 |
| P2 | 15.24 | 15.15 | 15.04 | 14.86 | 14.55 | 14.20 | 13.83 | 13.42 | 12.99 | 12.55 |
| P3 | 15.63 | 15.54 | 15.43 | 15.25 | 14.93 | 14.57 | 14.19 | 13.76 | 13.32 | 12.87 |
| Mean | 15.27 | 15.18 | 15.08 | 14.90 | 14.59 | 14.24 | 13.87 | 13.45 | 13.02 | 12.58 |
| S.Em± | 0.01 | 0.01 | 0.01 | 0.01 | 0.01 | 0.01 | 0.01 | 0.01 | 0.01 | 0.01 |
| C.D. @ 1% | 0.05 | 0.05 | 0.05 | 0.05 | 0.05 | 0.05 | 0.05 | 0.05 | 0.05 | 0.04 |
| Interaction (T×P) | ||||||||||
| T1P1 | 16.12 | 16.02 | 15.91 | 15.72 | 15.39 | 15.02 | 14.63 | 14.19 | 13.74 | 13.27 |
| T1P2 | 16.15 | 16.06 | 15.95 | 15.76 | 15.43 | 15.06 | 14.66 | 14.22 | 13.77 | 13.30 |
| T1P3 | 16.44 | 16.34 | 16.23 | 16.04 | 15.70 | 15.32 | 14.92 | 14.48 | 14.01 | 13.54 |
| T2P1 | 14.96 | 14.87 | 14.77 | 14.59 | 14.28 | 13.94 | 13.58 | 13.17 | 12.75 | 12.32 |
| T2P2 | 15.63 | 15.54 | 15.43 | 15.24 | 14.92 | 14.56 | 14.19 | 13.76 | 13.32 | 12.87 |
| T2P3 | 15.77 | 15.67 | 15.56 | 15.38 | 15.05 | 14.69 | 14.31 | 13.88 | 13.44 | 12.98 |
| T3P1 | 13.79 | 13.71 | 13.62 | 13.45 | 13.17 | 12.86 | 12.52 | 12.15 | 11.76 | 11.36 |
| T3P2 | 13.93 | 13.85 | 13.75 | 13.59 | 13.30 | 12.98 | 12.65 | 12.27 | 11.87 | 11.47 |
| T3P3 | 14.69 | 14.60 | 14.50 | 14.33 | 14.02 | 13.69 | 13.33 | 12.93 | 12.52 | 12.09 |
| Mean | 15.27 | 15.18 | 15.08 | 14.90 | 14.59 | 14.24 | 13.87 | 13.45 | 13.02 | 12.58 |
| S.Em± | 0.02 | 0.02 | 0.02 | 0.02 | 0.02 | 0.02 | 0.02 | 0.02 | 0.02 | 0.02 |
| C.D. @ 1% | 0.09 | 0.09 | 0.09 | 0.09 | 0.09 | 0.09 | 0.09 | 0.08 | 0.08 | 0.08 |
Table text extracted from the original PDF; superscript letters are shown inline. The original table image is below.
View original table image
The root length showed significant differences as influenced by different threshing methods, processing operations and their interaction effects at different months of storage period are presented in Table 2. The root length decreased with the advancement of storage period in all the treatments. Whereas, initially highest root length was recorded in T1 (18.05 cm), P3 (17.37 cm) and T1P3 (15.05 cm) and lowest was in T3 (15.72 cm), P1 (16.62 cm) and T3P1 (15.33 cm). At the end of nine months of storage period, highest shoot length was recorded in T1 (14.86 cm), P3 (14.31 cm) and T1P3 (15.05 cm) while, significantly lowest shoot length was recorded in T3 (12.94 cm), P1 (13.69 cm) and T3P1 (12.62 cm). The decline in seedling length may be attributed to age induced decline in germination. The damage caused by fungal infection and also production of toxic metabolites hindered the seedling growth. Increase of abnormal seedlings over a storage period. These findings are in agreement with the results obtained by Poonam Singh et al. (2004) [8] in rice and Vijaykumar et al. (2007) [12] in cotton.
| Treatments | Months after storage | — | — | — | — | — | — | — | — | — |
|---|---|---|---|---|---|---|---|---|---|---|
| Initial Nov 2022 | 1 Dec 2022 | 2 Jan 2023 | 3 Feb 2023 | 4 March 2023 | 5 April 2023 | 6 May 2023 | 7 June 2023 | 8 July 2023 | 9 Aug 2023 | |
| Threshing methods (T) | ||||||||||
| T1 | 18.05 | 17.94 | 17.82 | 17.60 | 17.23 | 16.82 | 16.38 | 15.89 | 15.38 | 14.86 |
| T2 | 17.17 | 17.07 | 16.95 | 16.75 | 16.40 | 16.01 | 15.59 | 15.12 | 14.64 | 14.14 |
| T3 | 15.72 | 15.62 | 15.51 | 15.33 | 15.01 | 14.65 | 14.27 | 13.84 | 13.39 | 12.94 |
| Mean | 16.98 | 16.88 | 16.76 | 16.56 | 16.21 | 15.82 | 15.41 | 14.95 | 14.47 | 13.98 |
| S.Em± | 0.01 | 0.01 | 0.01 | 0.01 | 0.01 | 0.01 | 0.01 | 0.01 | 0.01 | 0.01 |
| C.D. @ 1% | 0.06 | 0.06 | 0.06 | 0.06 | 0.06 | 0.06 | 0.06 | 0.05 | 0.05 | 0.05 |
| Processing operations (P) | ||||||||||
| P1 | 16.62 | 16.53 | 16.41 | 16.22 | 15.88 | 15.49 | 15.09 | 14.64 | 14.17 | 13.69 |
| P2 | 16.94 | 16.84 | 16.72 | 16.52 | 16.17 | 15.79 | 15.38 | 14.91 | 14.44 | 13.95 |
| P3 | 17.37 | 17.27 | 17.15 | 16.95 | 16.59 | 16.19 | 15.77 | 15.30 | 14.81 | 14.31 |
| Mean | 16.98 | 16.88 | 16.76 | 16.56 | 16.21 | 15.82 | 15.41 | 14.95 | 14.47 | 13.98 |
| S.Em± | 0.01 | 0.01 | 0.01 | 0.01 | 0.01 | 0.01 | 0.01 | 0.01 | 0.01 | 0.01 |
| C.D. @ 1% | 0.06 | 0.06 | 0.06 | 0.06 | 0.06 | 0.06 | 0.06 | 0.05 | 0.05 | 0.05 |
| Interaction (T×P) | ||||||||||
| T1P1 | 17.92 | 17.81 | 17.69 | 17.47 | 17.11 | 16.70 | 16.26 | 15.77 | 15.27 | 14.75 |
| T1P2 | 17.96 | 17.85 | 17.73 | 17.52 | 17.15 | 16.74 | 16.30 | 15.81 | 15.31 | 14.79 |
| T1P3 | 18.27 | 18.17 | 18.04 | 17.82 | 17.45 | 17.03 | 16.59 | 16.09 | 15.58 | 15.05 |
| T2P1 | 16.63 | 16.53 | 16.41 | 16.22 | 15.88 | 15.50 | 15.09 | 14.64 | 14.17 | 13.69 |
| T2P2 | 17.37 | 17.27 | 17.15 | 16.94 | 16.59 | 16.19 | 15.77 | 15.30 | 14.81 | 14.30 |
| T2P3 | 17.52 | 17.42 | 17.30 | 17.09 | 16.73 | 16.33 | 15.91 | 15.43 | 14.94 | 14.43 |
| T3P1 | 15.33 | 15.24 | 15.14 | 14.96 | 14.64 | 14.29 | 13.92 | 13.50 | 13.07 | 12.62 |
| T3P2 | 15.49 | 15.39 | 15.29 | 15.11 | 14.79 | 14.43 | 14.06 | 13.64 | 13.20 | 12.75 |
| T3P3 | 16.33 | 16.23 | 16.12 | 15.92 | 15.59 | 15.22 | 14.82 | 14.38 | 13.92 | 13.44 |
| Mean | 16.98 | 16.88 | 16.76 | 16.56 | 16.21 | 15.82 | 15.41 | 14.95 | 14.47 | 13.98 |
| S.Em± | 0.03 | 0.03 | 0.03 | 0.03 | 0.02 | 0.02 | 0.02 | 0.02 | 0.02 | 0.02 |
| C.D. @ 1% | 0.10 | 0.10 | 0.10 | 0.10 | 0.10 | 0.10 | 0.10 | 0.09 | 0.09 | 0.09 |
Table text extracted from the original PDF; superscript letters are shown inline. The original table image is below.
View original table image
The results of seedling dry weight as influenced by different threshing methods, processing operations and their interaction effects at different months of storage period are presented in Table 3. The seedling vigour index decreased with the advancement of storage period in all the treatments. Whereas, initially higher seedling dry weight was recorded in T1 (614.93 mg) and P3 (611.43 mg) and T1P3 (618.50 mg) and lower was in T3 (599.50 mg), P1 (604.80 mg) and T3P1 (595.70 mg). At the end of nine months of storage period, highest seedling dry weight was recorded in T1 (590.65 mg), P3 (587.29 mg) and T1P3 (594.07 mg) while, significantly lower seedling dry weight was recorded in T3 (575.82 mg), P1 (580.91 mg) and T3P1 (572.17 mg). Differences in shoot length and root length among the processed seeds may be due to the difference in seed size and extent of mechanical injury. This was supported by various findings by Hesse and Peske (1981) [4] , Moreano et al. (2018) [7] in soybean. The soybean crop threshed by multi-crop thresher with 300 rpm and seeds processed using air screen cleaner followed by gravity separator, and spiral separator (T1P3) recorded significantly highest seedling length, dry matter content and vigour index than other combinations. This could be attributed to less percentage of mechanical damage to these seeds. Mechanical damage to the seed may be one of the causes for reduction in length of seedlings of soybean. The threshing produces breaks, cracks, bruises and abrasions in seeds which in turn results in abnormal seedlings of questionable planting value. These results are in conformity with the findings of Kausal et al. (2006) [5] in soybean. It was noticed that seedling length, dry matter content and vigour index were decreased as the storage period advanced. The decrease in length of seedlings could be ascribed to the ageing or deterioration of seed, which is progressive process, accompanied by accumulation of metabolites and progressively decrease germination and growth of seedlings with increased age (Floris, 1970) [3] and ultimately reducing the dry matter and vigour of soybean seed during storage. Seedling growth is considered to be an important tool that can be used for assessing the magnitude of deterioration (Toole et al., 1957) [11] .
| Treatments | Months after storage | — | — | — | — | — | — | — | — | — |
|---|---|---|---|---|---|---|---|---|---|---|
| Initial Nov 2022 | 1 Dec 2022 | 2 Jan 2023 | 3 Feb 2023 | 4 March 2023 | 5 April 2023 | 6 May 2023 | 7 June 2023 | 8 July 2023 | 9 Aug 2023 | |
| Threshing methods (T) | ||||||||||
| T1 | 614.93 | 613.09 | 611.74 | 608.68 | 605.64 | 602.61 | 599.60 | 596.60 | 593.62 | 590.65 |
| T2 | 608.67 | 606.84 | 605.51 | 602.48 | 599.47 | 596.47 | 593.49 | 590.52 | 587.57 | 584.63 |
| T3 | 599.50 | 597.70 | 596.39 | 593.40 | 590.44 | 587.49 | 584.55 | 581.63 | 578.72 | 575.82 |
| Mean | 607.70 | 605.88 | 604.54 | 601.52 | 598.51 | 595.52 | 592.54 | 589.58 | 586.63 | 583.70 |
| S.Em± | 0.06 | 0.06 | 0.06 | 0.06 | 0.06 | 0.06 | 0.06 | 0.06 | 0.06 | 0.06 |
| C.D. @ 1% | 0.25 | 0.25 | 0.25 | 0.25 | 0.25 | 0.25 | 0.25 | 0.25 | 0.24 | 0.24 |
| Processing operations (P) | ||||||||||
| P1 | 604.80 | 602.99 | 601.66 | 598.65 | 595.66 | 592.68 | 589.72 | 586.77 | 583.83 | 580.91 |
| P2 | 606.87 | 605.05 | 603.71 | 600.70 | 597.69 | 594.70 | 591.73 | 588.77 | 585.83 | 582.90 |
| P3 | 611.43 | 609.60 | 608.26 | 605.22 | 602.19 | 599.18 | 596.18 | 593.20 | 590.24 | 587.29 |
| Mean | 607.70 | 605.88 | 604.54 | 601.52 | 598.51 | 595.52 | 592.54 | 589.58 | 586.63 | 583.70 |
| S.Em± | 0.06 | 0.06 | 0.06 | 0.06 | 0.06 | 0.06 | 0.06 | 0.06 | 0.06 | 0.06 |
| C.D. @ 1% | 0.25 | 0.25 | 0.25 | 0.25 | 0.25 | 0.25 | 0.25 | 0.25 | 0.24 | 0.24 |
| Interaction (T×P) | ||||||||||
| T1P1 | 611.50 | 609.67 | 608.32 | 605.28 | 602.26 | 599.24 | 596.25 | 593.27 | 590.30 | 587.35 |
| T1P2 | 614.80 | 612.96 | 611.61 | 608.55 | 605.51 | 602.48 | 599.47 | 596.47 | 593.49 | 590.52 |
| T1P3 | 618.50 | 616.64 | 615.29 | 612.21 | 609.15 | 606.10 | 603.07 | 600.06 | 597.06 | 594.07 |
| T2P1 | 607.20 | 605.38 | 604.05 | 601.03 | 598.02 | 595.03 | 592.06 | 589.10 | 586.15 | 583.22 |
| T2P2 | 608.50 | 606.67 | 605.34 | 602.31 | 599.30 | 596.31 | 593.32 | 590.36 | 587.41 | 584.47 |
| T2P3 | 610.30 | 608.47 | 607.13 | 604.09 | 601.07 | 598.07 | 595.08 | 592.10 | 589.14 | 586.20 |
| T3P1 | 595.70 | 593.91 | 592.61 | 589.64 | 586.70 | 583.76 | 580.84 | 577.94 | 575.05 | 572.17 |
| T3P2 | 597.30 | 595.51 | 594.20 | 591.23 | 588.27 | 585.33 | 582.40 | 579.49 | 576.59 | 573.71 |
| T3P3 | 605.50 | 603.68 | 602.36 | 599.34 | 596.35 | 593.37 | 590.40 | 587.45 | 584.51 | 581.59 |
| Mean | 607.70 | 605.88 | 604.54 | 601.52 | 598.51 | 595.52 | 592.54 | 589.58 | 586.63 | 583.70 |
| S.Em± | 0.11 | 0.11 | 0.11 | 0.11 | 0.11 | 0.11 | 0.10 | 0.10 | 0.10 | 0.10 |
| C.D. @ 1% | 0.44 | 0.44 | 0.44 | 0.43 | 0.43 | 0.43 | 0.43 | 0.42 | 0.42 | 0.42 |
Table text extracted from the original PDF; superscript letters are shown inline. The original table image is below.
View original table image
References
12 in the original paper- Alvarez PJC, Krzyzanowski FC, Mandarino JMG, Franca-Neto JB. Relationship between soybean seed coat lignin content and resistance to mechanical damage. Seed Sci Technol. 1997;25(2):209-214.
- FAO. Food and Agriculture Data. Food and Agriculture Organization of the United Nations, USA. 2020. Available from: http://www.fao.org/faostat/en/#home
- Floris C. Ageing in Triticum durum seeds: Behavior of embryos and endosperm from aged seeds as revealed by the embryo transplantation technique. J Exp Bot. 1970;21:462-468.
- Hesse SR, Peske ST. Spiral separator for removal of small bean seeds in soybean seeds. Seed Technol. 1981;1(2):118-122.
- Kausal RT, Jagtap AP, Patil BN, Pavitrakar NRA, Rathod TH. Management of mechanical damage to soybean seeds during threshing. Ann Plant Physiol. 2006;20(1):74-77.
- Mahesha CR, Channaveeraswami AS, Kurdikeri MB, Shekhargouda M, Merwade MN. Seed maturation studies in sunflower genotypes. Seed Res. 2001;29(1):95-97.
- Moreano TB, Marques OJ, Braccini AL, Scapim CA, Franca-Neto JDB, Krzyzanowski FC. Evolution of the physical and physiological quality of soybean seeds during processing. J Seed Sci. 2018;40:313-322.
- Singh P, Maurya CL, Gaura K, Bajpai VP. Effect of biological and chemical fungicides on longevity of rice hybrid (DRRH-1) and its parental line seeds. Seed Res. 2004;32(2):177-179.
- Prakobbon N. Role of mechanical damage in deterioration of soybean seed quality during storage: A review. Agric Rev. 1982;29(3):177-184.
- Puteh AB, Tekrony DM, Egli DB. Expression of cotyledon necrosis in deteriorating soybean [Glycine max (L.)] seed. Seed Sci Technol. 1997;25(1):133-145.
- Toole EH, Toole VK, Borthwick HA. Growth and production of snap beans stored under favourable and unfavourable conditions. Proc Int Seed Test Ass. 1957;22:418-425.
- Vijaykumar K, Ravi H, Biradar Patil NK, Vyakarnahal BS. Effect of seed coating with polymer, fungicide and insecticide on seed quality in cotton during storage. Karnataka J Agric Sci. 2007;20(1):137-139.