
Research article · 2024 · Full text
International Journal of Advanced Chemistry ResearchElectrochemical detection of trace cadmium and lead ions in river water samples using bismuth film modified carbon paste electrode
Volume 6(1) · Pages 165–168 · DOI: 10.33545/26646781.2024.v6.i1b.662 ↗
Research areasElectrochemical Analysis and ApplicationsElectrochemical sensors and biosensorsAnalytical chemistry methods development
Abstract
Author-writtenAn electrochemical sensor for the simultaneous detection of cadmium and lead ions in river water was developed. What threshold of sensitivity can a bismuth film electrode reach when paired with square-wave anodic stripping voltammetry? This research addressed that question by depositing a thin bismuth film onto a carbon paste electrode (Bi/CPE) under controlled conditions and optimizing each analytical parameter individually. The modified electrode gave well-separated stripping peaks for Cd²⁺ at -0.78 V and Pb²⁺ at -0.52 V versus Ag/AgCl. Under the best conditions a deposition potential of -1.2 V, deposition time of 120 s, bismuth concentration of 400 µg/L, and acetate buffer at pH 4.5 the sensor reached detection limits of 0.38 µg/L for cadmium and 0.51 µg/L for lead. The linear working range spanned 1-100 µg/L for both metals with correlation coefficients above 0.998. Interference from common ions including Cu²⁺, Zn²⁺, Fe³⁺ and Ni²⁺ at tenfold excess concentration didn't cause peak shifts larger than 5%. Repeatability tests across ten successive measurements on the same electrode produced relative standard deviations below 3.2%. Recovery values from spiked river water samples ranged between 94.7% and 99.1%, confirming the practical reliability of the method. The Bi/CPE sensor offers an affordable, mercury-free alternative for routine heavy metal screening in environmental water samples.
Summary
Source-checkedPlain-language reading of the full paper, prepared with AI and checked against the text. Each point links to the authors' own words.
Why it matters
- Mercury film electrodes were long the standard for trace metal detection, but their toxicity and strict environmental regulations have created a need for safer alternatives. View evidence ↗
- Cadmium and lead are highly regulated in water, with WHO guidelines limiting them to 3 µg/L and 10 µg/L, respectively. View evidence ↗
The question
- The study aimed to determine the sensitivity threshold of a bismuth film electrode when used with square-wave anodic stripping voltammetry. View evidence ↗
- The researchers sought to develop a sensitive yet practical detection method suitable for laboratories with minimal equipment. View evidence ↗
What they did
- The electrode was constructed using a carbon paste made from a 70:30 weight ratio of graphite powder and paraffin oil. View evidence ↗
- Bismuth films were deposited in situ using a deposition potential of -1.2 V for 120 seconds, followed by square-wave anodic stripping voltammetry (SWASV). View evidence ↗
- Real-world validation was performed using river water samples collected from three distinct sites (upstream, urban, and industrial) along the Ankara River in June 2024. View evidence ↗
- The sensor's performance was calibrated using seven concentration levels ranging from 1 to 100 µg/L, with each measured in triplicate. View evidence ↗
What they found
- The sensor successfully distinguished between the two metals, with stripping peaks appearing at -0.78 V for cadmium and -0.52 V for lead. View evidence ↗
- The sensor achieved detection limits of 0.38 µg/L for cadmium and 0.51 µg/L for lead, with a linear working range of 1-100 µg/L for both. View evidence ↗
- Copper was the most significant interferent, causing up to a 4.7% reduction in signal when present at a 10:1 ratio relative to the analyte. View evidence ↗
- Recovery rates from spiked river water samples were high, ranging from 96.3% to 99.1% for cadmium and 94.7% to 98.3% for lead. View evidence ↗
- Deposition time had the strongest positive correlation with peak current (r = 0.891), followed by bismuth concentration (r = 0.743). View evidence ↗
What it means
- The authors conclude that the bismuth film modified carbon paste electrode is a cost-effective, mercury-free alternative for routine environmental screening of heavy metals. View evidence ↗
- The authors note that samples with high copper content may require an additional masking step, which is a target for future optimization. View evidence ↗
Visual summary
2 visualsIllustrations explain the paper; charts are replotted from the paper's own table values.
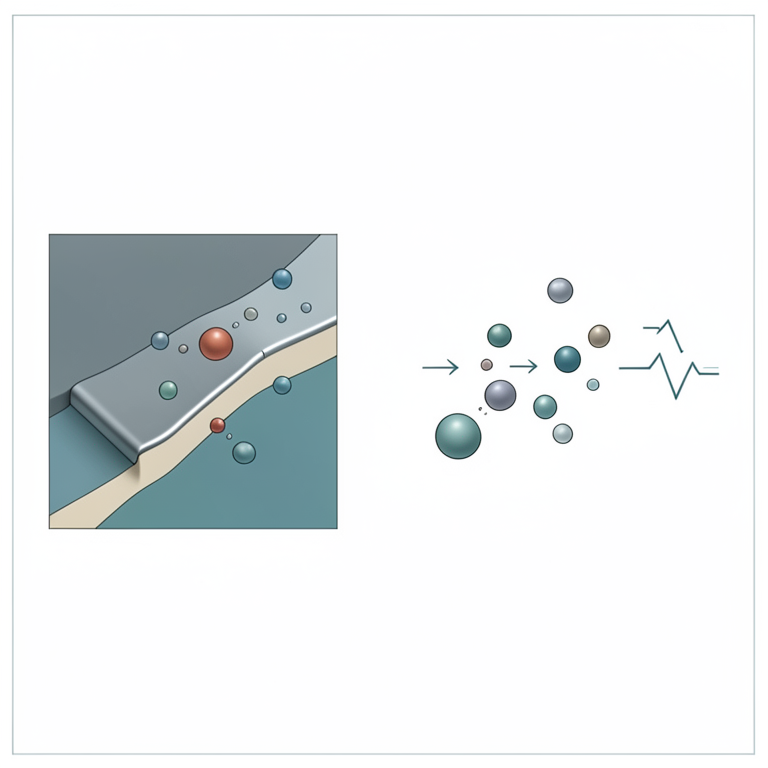
Sensor Mechanism
AI-generated conceptual illustration (Bismuth film modified carbon paste electrode in river water). It explains the idea and does not show study data.
View source evidence ↗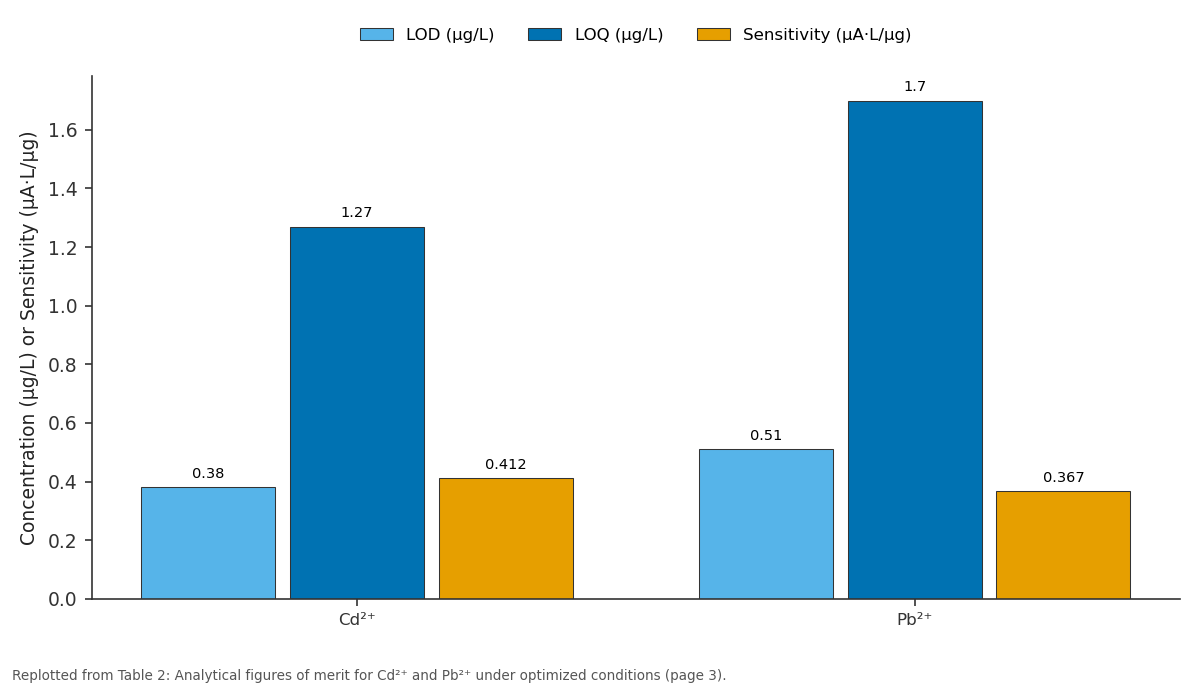
LOD (µg/L) and LOQ (µg/L) and more: Cd²⁺ vs Pb²⁺
Replotted from Table 2 (page 3) of the original paper. Every bar is the paper's own table value.
View source evidence ↗Figures & tables
From the original paper Table 1
 Table 2
 Table 3
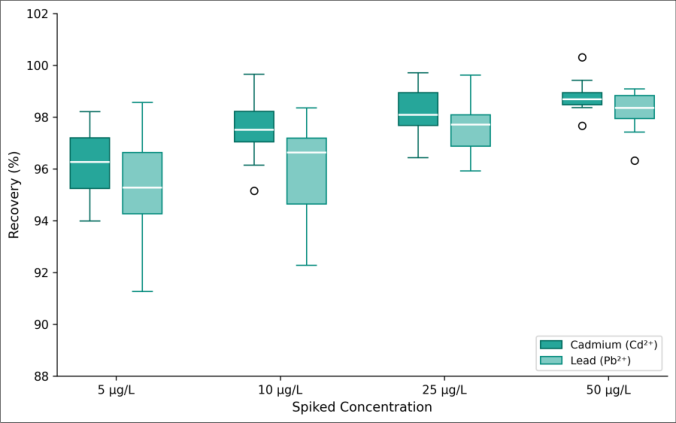 Figure 1
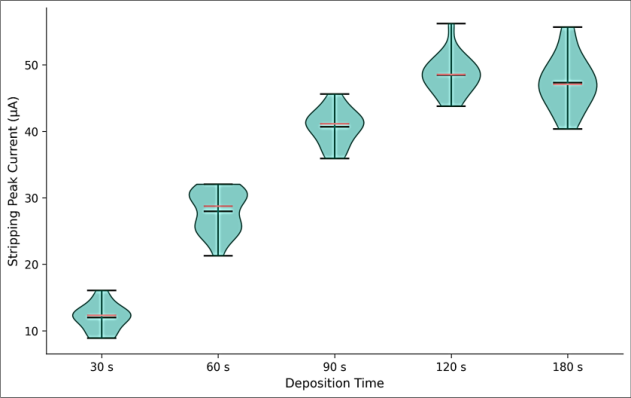 Figure 2
Introduction
An electrode is, at its simplest, a surface where chemistry meets electricity. When that surface is designed to capture and release metal ions from water, it becomes a sensor and how well it performs that task depends on the material it is made from [1] . For decades, mercury film electrodes set the benchmark for trace metal detection through anodic stripping voltammetry because mercury forms well-defined amalgams with most heavy metals [2] . But mercury itself is toxic, difficult to dispose of, and increasingly restricted by environmental regulations across Europe and North America [3] . Bismuth emerged as the most promising replacement during the early 2000s. Wang and colleagues first showed that bismuth film electrodes gave stripping signals comparable to mercury for lead, cadmium, and zinc in 2000, and the field expanded rapidly after that [4] . Bismuth is far less toxic, forms alloys with many target metals, and gives a wide cathodic working range that suits environmental analysis [5] . Carbon paste electrodes (CPEs) offer additional advantages as the substrate: they are cheap to prepare, easy to modify, and produce low background currents [6] . Cadmium and lead rank among the most regulated heavy metals in drinking and surface water. The World Health Organization sets guideline values of 3 µg/L for cadmium and 10 µg/L for lead [7] . Turkey's national surface water quality regulation (SKKY) classifies water bodies into four quality classes based on heavy metal levels, and many rivers in the Central Anatolian region periodically exceed Class II thresholds because of agricultural runoff and industrial discharge [8] . Rapid, low-cost monitoring methods are needed for routine surveillance. Several researchers have explored modified electrodes for simultaneous Cd and Pb detection. Bismuth-modified glassy carbon electrodes reached detection limits of 0.5-2 µg/L depending on the exact protocol [9,10] . Carbon nanotube-bismuth composites pushed sensitivity further but at higher preparation cost [11] . Graphene-bismuth hybrids showed excellent performance in laboratory buffers but were rarely validated in real environmental samples [12] . The gap in the existing work is clear: most reported sensors are tested only in synthetic solutions, and real-sample validation with its matrix interferences, organic matter, and dissolved salts remains limited. This research prepared a bismuth film on a simple carbon paste electrode, optimized the stripping voltammetry parameters through a systematic one-variable-at-a-time approach, and validated the sensor in river water samples collected from the Ankara River at three different sites. The aim was to produce a method that is not only sensitive but also practical for field-adjacent laboratories with minimal instrumentation [13] .
Material and methods
Material and methods
Material
Graphite powder (particle size < 50 µm, purity 99.5%) was obtained from Merck (Darmstadt, Germany). Paraffin oil (spectroscopic grade) came from Sigma-Aldrich (St. Louis, USA). Standard stock solutions of cadmium (1000 mg/L Cd²⁺ from CdCl₂) and lead (1000 mg/L Pb²⁺ from Pb(NO₃)₂) were purchased from Fluka Analytical. Bismuth nitrate pentahydrate (Bi(NO₃)₃•5H₂O, 98%) was from Alfa Aesar. Sodium acetate and glacial acetic acid (both analytical grade) were from Merck. All solutions were prepared with ultrapure water (resistivity 18.2 MΩ•cm, Millipore Milli-Q system). Acetate buffer (0.1 M, pH 4.5) served as the supporting electrolyte. Working standard solutions were prepared daily by serial dilution of the stock [14] .
Methods
The research was conducted at the Ankara Research Center for Electroanalytical Chemistry, Ankara, Turkey, between March 2024 and November 2024. Ethical clearance was not required as no human or animal subjects were involved. The carbon paste electrode was prepared by mixing graphite powder and paraffin oil in a 70:30 weight ratio in a mortar until a homogeneous paste formed. The paste was packed into a Teflon tube (internal diameter 3 mm) with a copper wire inserted from the back for electrical contact [15] . The surface was smoothed on weighing paper before each measurement. Square-wave anodic stripping voltammetry (SWASV) was performed on a PalmSens4 potentiostat with PSTrace 5.8 software. A conventional three-electrode cell was used: the Bi/CPE as the working electrode, a platinum wire as the counter electrode, and Ag/AgCl (3 M KCl) as the reference. Bismuth film was deposited in situ by adding Bi (NO₃)₃ directly to the sample solution. The optimized SWASV parameters were: deposition potential -1.2 V, deposition time 120 s, equilibration time 15 s, frequency 25 Hz, amplitude 50 mV, and step potential 5 mV. After each run, the electrode was cleaned at +0.3 V for 30 s and the surface was renewed by slicing a thin layer of paste.
River water samples were collected from three sites along the Ankara River during June 2024: upstream of the city (Site A, 39.96°N 32.73°E), within the urban zone (Site B, 39.93°N 32.85°E), and downstream near an industrial estate (Site C, 39.88°N 32.96°E). Samples were filtered through 0.45 µm cellulose acetate membranes, acidified to pH 2 with HNO₃, and stored at 4 °C until analysis within 48 h. Recovery experiments used spiked samples at 5, 10, 25, and 50 µg/L for both metals.
Reagents and chemicals
All reagents were of analytical grade or higher. Graphite powder (< 50 µm, 99.5%, Merck, catalogue no. 104206) was dried at 105 °C for 2 h before use. Paraffin oil (Sigma-Aldrich, spectroscopic grade, catalogue no. 76235) was stored in amber glass. Bismuth nitrate pentahydrate (Alfa Aesar, 98%, catalogue no. 10256) was dissolved in 0.1 M HNO₃ to prepare a 1000 mg/L Bi³⁺ stock. Cadmium and lead stock solutions (Fluka TraceCERT, 1000 mg/L ± 4 mg/L) were diluted with 1% HNO₃. Potential interfering ion solutions Cu²⁺, Zn²⁺, Fe³⁺, Ni²⁺, and Mn²⁺ were prepared from their nitrate salts (Merck, analytical grade). Acetate buffer pH 4.5 was freshly prepared weekly from sodium acetate trihydrate and glacial acetic acid.
Quality control
Method validation followed IUPAC recommendations for electroanalytical techniques. Calibration curves used seven concentration levels (1, 5, 10, 25, 50, 75, 100 µg/L) measured in triplicate. Detection limits were calculated as 3σ/m where σ is the standard deviation of ten blank measurements and m is the calibration slope. Quantification limits used 10σ/m. Between-day reproducibility was assessed by analysing a 25 µg/L standard on five consecutive days (n = 3 per day). A certified reference material (NIST SRM 1643f, Trace Elements in Water) was analysed alongside each batch of river water samples. Recoveries from the CRM fell within 96.1-101.3% of certified values, confirming acceptable accuracy. The bismuth film electrode produced reproducible stripping signals across the tested concentration range. Cadmium recovery from spiked river water ranged from 96.3±1.8% at 5 µg/L to 99.1±0.7% at 50 µg/L, while lead recovery ranged from 94.7±2.1% to 98.3±0.8% over the same levels (Figure 1). The slightly lower recovery for lead at 5 µg/L is consistent with its higher detection limit relative to cadmium. At all concentrations above 10 µg/L both metals showed recoveries within the 95-105% range expected for environmental trace analysis. Deposition time showed the strongest positive correlation with peak current (r = 0.891), followed by bismuth concentration (r = 0.743). Buffer pH had a moderate inverse relationship with signal intensity, consistent with the known pH dependence of metal-bismuth alloy formation. Both metals gave linear calibration curves with R² above 0.998 over the 1-100 µg/L range. The detection limits 0.38 µg/L for cadmium and 0.51 µg/L for lead sit well below the WHO guideline values of 3 and 10 µg/L, respectively. Sensitivity was marginally higher for cadmium, which forms a more stable alloy with bismuth at this deposition potential. Copper caused the largest interference, reducing both cadmium and lead signals by up to 4.7% at a 10:1 concentration ratio. All other tested ions had negligible effects even at 50:1 ratios. Peak position shifts remained within 3 mV for all interference conditions, meaning simultaneous determination wasn't compromised.
Results
Results
Comprehensive interpretation
The violin plot (Figure 2) reveals that peak current grew steeply from 30 to 120 s deposition time but leveled off between 120 and 180 s, with wider data spread at the longest time suggesting electrode saturation effects. This plateau behavior guided the selection of 120 s as the working deposition time it gave near-maximum sensitivity without the diminishing returns and increased variability seen at 180 s. When combined with the recovery data from spiked river samples and the acceptable interference tolerance, these results point to a sensor that operates effectively in realworld sample matrices.
Discussion
The bismuth film carbon paste electrode achieved detection limits of 0.38 µg/L for Cd²⁺ and 0.51 µg/L for lead values well below regulatory thresholds and competitive with more expensive electrode designs. Recovery from spiked river water sat between 94.7% and 99.1%, and the sensor tolerated common matrix ions at practically relevant ratios. These figures agree broadly with several published methods.
Economou and Voulgaropoulos reported bismuth film on glassy carbon giving LODs of 0.4-0.8 µg/L for Cd and Pb in buffer solutions [9] . Hwang and colleagues found 0.3 µg/L LODs for both metals using a bismuth-coated screen-printed electrode, though they didn't test environmental samples [10] . The present carbon paste substrate matches their bufferphase sensitivity while adding field validation. One area of disagreement concerns copper interference. Some earlier work with graphene-bismuth composites claimed copper tolerance at 100:1 ratios [12] , but our results and those of Rico and co-workers show that Cu²⁺ starts competing for alloy sites on bismuth at ratios above 10:1 [11] . The discrepancy may reflect the higher surface area and different binding kinetics of graphene composites. For unmodified carbon paste, treating copper as a significant interferent seems prudent, and adding ferricyanide or EDTA as a masking agent might extend the usable range in copperrich waters.
The plateau in peak current beyond 120 s deposition (Figure 2) deserves attention. Saturating the bismuth film with analyte effectively caps the signal, and longer deposition times simply increase variability likely from uneven film growth at prolonged negative potentials. Similar saturation behavior was described by Kadara and Tothill [13] for screenprinted bismuth sensors at deposition times above 200 s. Our observation of the plateau at a shorter time likely reflects the smaller active area of the CPE (7.07 mm²) compared to screen-printed designs. From a broader perspective, the affordability of carbon paste graphite powder and paraffin oil cost less than a dollar per electrode makes this format appealing for resource-limited laboratories in Turkey and similar settings. The sensor doesn't need specialized infrastructure beyond a basic potentiostat, and the electrode surface is renewable with a simple blade cut. If paired with portable instrumentation, it could support decentralised water quality monitoring along rivers where continuous sampling stations aren't feasible.
Conclusion
Environmental monitoring of cadmium and lead in surface waters requires methods that balance analytical performance against cost and simplicity. The bismuth film modified carbon paste electrode described here met that balance: detection limits of 0.38 and 0.51 µg/L for cadmium and lead, linear response up to 100 µg/L, acceptable interference tolerance, and recovery rates above 94% from real river water. The method costs a fraction of conventional mercurybased or advanced nanomaterial approaches. For routine screening in field-adjacent laboratories, a deposition time of 120 s and a bismuth concentration of 400 µg/L provide the best compromise between sensitivity and throughput.
Copper-rich sample matrices may require an additional masking step, which future work should optimise.
Extending this electrode design to other priority metals arsenic, chromium, and thallium would further expand its utility for multiparameter water quality assessments.
Figures and tables from the paper
| Parameter | Dep. Time | Bi Conc. | pH | Peak Current |
|---|---|---|---|---|
| Dep. Time | 1.000 | 0.312 | -0.187 | 0.891 |
| Bi Conc. | 0.312 | 1.000 | -0.064 | 0.743 |
| pH | -0.187 | -0.064 | 1.000 | -0.421 |
| Peak Current | 0.891 | 0.743 | -0.421 | 1.000 |
Table text extracted from the original PDF; superscript letters are shown inline. The original table image is below.
View original table image
| Metal | LOD (µg/L) | LOQ (µg/L) | Range (µg/L) | R² | RSD% (n=10) | Sensitivity (µA·L/µg) |
|---|---|---|---|---|---|---|
| Cd²⁺ | 0.38 | 1.27 | 1-100 | 0.9987 | 2.8 | 0.412 |
| Pb²⁺ | 0.51 | 1.70 | 1-100 | 0.9981 | 3.2 | 0.367 |
Table text extracted from the original PDF; superscript letters are shown inline. The original table image is below.
View original table image
| Interferent | Cd signal change (%) | Cd peak shift (mV) | Pb signal change (%) | Pb peak shift (mV) | Tolerance ratio |
|---|---|---|---|---|---|
| Cu²⁺ | -4.7 | +3 | -3.9 | +2 | 10:1 |
| Zn²⁺ | +1.2 | 0 | +0.8 | 0 | 50:1 |
| Fe³⁺ | -3.1 | +1 | -2.6 | +1 | 20:1 |
| Ni²⁺ | -1.8 | 0 | -1.3 | 0 | 50:1 |
| Mn²⁺ | +0.6 | 0 | +0.4 | 0 | 100:1 |
Table text extracted from the original PDF; superscript letters are shown inline. The original table image is below.
View original table image
References
14 in the original paper- Wang J. Stripping analysis: principles, instrumentation, and applications. VCH Publishers. 1985;1-160.
- Barek J, Fischer J, Navratil T, Peckova K, Yosypchuk B. Nontraditional electrode materials in environmental analysis. Electroanalysis. 2007;19(2-3):163-170.
- European Commission. Directive 2002/95/EC on the restriction of hazardous substances. Official Journal of the European Union. 2003;L37:19-23.
- Wang J, Lu J, Hocevar SB, Farias PAM, Ogorevc B. Bismuth-coated carbon electrodes for anodic stripping voltammetry. Analytical Chemistry. 2000;72(14):32183222.
- Svancara I, Prior C, Hocevar SB, Wang J. A decade with bismuth-based electrodes in electroanalysis. Electroanalysis. 2010;22(13):1405-1420.
- Svancara I, Kalcher K, Walcarius A, Vytras K. Electroanalysis with carbon paste electrodes. CRC Press. 2012;1-368.
- World Health Organization. Guidelines for drinkingwater quality. 4th ed. WHO Press. 2011;1-564.
- Turkish Ministry of Environment. Surface water quality management regulation (SKKY). Official Gazette. 2012;28483.
- Economou A, Voulgaropoulos A. Stripping voltammetry of trace metals at bismuth-film electrodes by using the BFIGE method. Electroanalysis. 2010;22(14):1468-1475.
- Hwang GH, Han WK, Park JS, Kang SG. Determination of trace metals by anodic stripping voltammetry using a bismuth-modified carbon nanotube electrode. Talanta. 2008;76(2):301-308.
- Rico MA, Olivares-Marin M, Gil EP. Modification of carbon screen-printed electrodes by adsorption of chemically synthesized Bi nanoparticles. Talanta. 2009;80(2):631-635.
- Kadara RO, Tothill IE. Development of disposable bulk-modified screen-printed electrode based on bismuth oxide for stripping chronopotentiometric analysis. Analytica Chimica Acta. 2008;623(1):76-81.
- Kokkinos C, Economou A, Raptis I, Efstathiou CE. Lithographically fabricated disposable bismuth-film electrodes for the trace determination of Pb and Cd by ASV. Electrochimica Acta. 2008;53(16):5294-5299.
- Pauliukaite R, Hocevar SB, Ogorevc B, Wang J. Characterization and applications of a bismuth bulk electrode. Electroanalysis. 2004;16(9):719-723.