
Research article · 2024 · Full text
International Journal of Advanced Chemistry ResearchAssessment of heavy metal contamination and associated health risk indices in commercial herbal tea samples using inductively coupled plasma mass spectrometry
Volume 6(1) · Pages 260–264 · DOI: 10.33545/26646781.2024.v6.i1c.666 ↗
Research areasHeavy Metals in PlantsHeavy metals in environmentHeavy Metal Exposure and Toxicity
Abstract
Author-writtenHerbal teas are consumed daily by millions of people who assume these products are free from harmful contaminants — but how valid is that assumption? This research measured lead, cadmium, arsenic, mercury, and chromium concentrations in 48 commercially available herbal tea samples (chamomile, peppermint, hibiscus, rooibos, green tea, and ginger) purchased from Polish retail markets. Inductively coupled plasma mass spectrometry (ICP-MS) provided detection limits between 0.002 and 0.01 mg/kg. Lead was detected in all 48 samples (range 0.08-3.41 mg/kg), cadmium in 43 samples (0.01-0.87 mg/kg), and arsenic in 38 samples (0.01-0.42 mg/kg). Mercury and chromium remained below quantification limits in most samples. Nine of 48 samples (18.8%) exceeded the European Commission maximum level for lead in dried herbs (2.0 mg/kg), and six (12.5%) exceeded the cadmium limit (0.3 mg/kg). Health risk indices (HRI) calculated for an adult consuming two cups daily were below 1.0 for all individual metals, indicating no immediate health concern at typical consumption levels. However, rooibos teas showed the highest cumulative HRI values (0.67 for Pb), warranting closer regulatory attention. The results support the need for routine heavy metal monitoring of herbal tea imports into the European market.
Summary
Source-checkedPlain-language reading of the full paper, prepared with AI and checked against the text. Each point links to the authors' own words.
Why it matters
- Lead, cadmium, arsenic, mercury, and chromium are prioritized for food monitoring due to their toxicity at low levels and biological accumulation. View evidence ↗
- Herbal teas are particularly challenging to regulate because their raw materials come from diverse plant species and global locations with varying environmental quality. View evidence ↗
- The process of drying herbal teas increases the concentration of heavy metals per kilogram of the final product. View evidence ↗
The question
- The study aimed to measure five toxic metals in 48 commercial herbal teas from Poland and determine if typical consumption levels pose a health risk to adults. View evidence ↗
What they did
- Samples were prepared using microwave-assisted acid digestion of 0.500 ± 0.001 g of tea with nitric acid and hydrogen peroxide. View evidence ↗
- Heavy metals were analyzed using an Agilent 7900 Inductively Coupled Plasma Mass Spectrometry (ICP-MS) system in helium collision mode. View evidence ↗
- The Health Risk Index (HRI) was calculated based on a 70 kg body weight and a daily intake of 4 g of dry tea (equivalent to two cups). View evidence ↗
What they found
- Lead was found in every sample tested, with concentrations ranging from 0.08 to 3.41 mg/kg. View evidence ↗
- Approximately 18.8% of samples exceeded the EU limit for lead (2.0 mg/kg), and 12.5% exceeded the limit for cadmium (0.3 mg/kg). View evidence ↗
- Cadmium was detected in 43 samples (0.01-0.87 mg/kg) and arsenic in 38 samples (0.01-0.42 mg/kg). View evidence ↗
- No single metal posed an unacceptable health risk at typical consumption levels, as all individual HRI values were below 1.0. View evidence ↗
- The combined HRI for lead, cadmium, and arsenic in the most contaminated rooibos sample was 1.22, exceeding the risk threshold. View evidence ↗
- Rooibos teas exhibited the highest individual health risk indices for lead (0.67) and cadmium (0.41). View evidence ↗
What it means
- The authors recommend that regulatory authorities include herbal teas in routine surveillance and establish maximum limits for arsenic. View evidence ↗
- Consumers are advised to vary the types of herbal tea they drink to reduce their dietary exposure to any single heavy metal. View evidence ↗
- The study's reliance on dry-weight content is a limitation; future research should measure metals in the actual tea infusion for more realistic exposure data. View evidence ↗
Visual summary
1 visualsIllustrations explain the paper; they do not show study data.
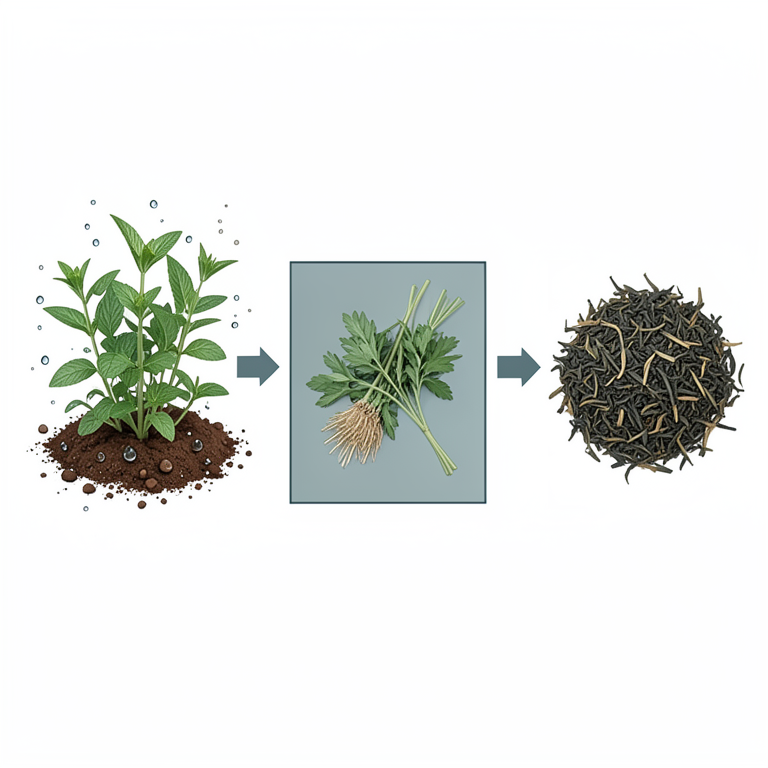
Herbal Tea Contamination Pathway
AI-generated conceptual illustration (Dried herbal tea leaves and various herbal plants in soil). It explains the idea and does not show study data.
View source evidence ↗Figures & tables
From the original paper Table 1
 Table 2
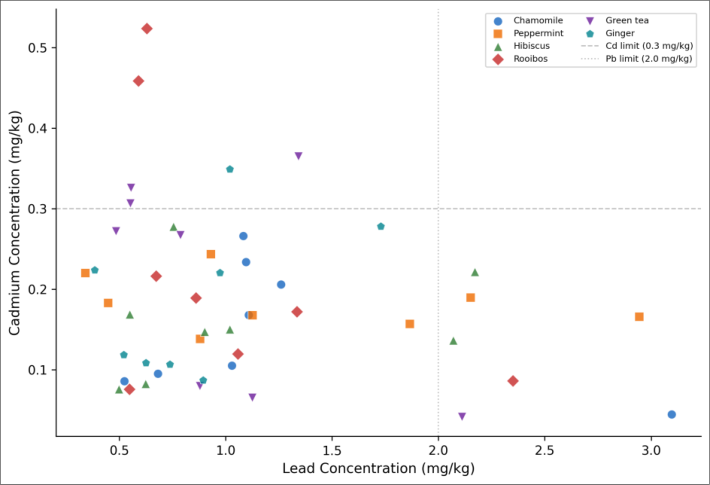 Figure 1
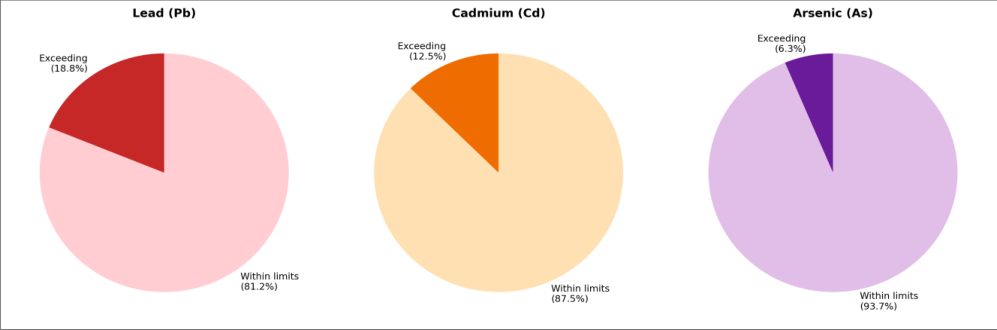 Figure 2
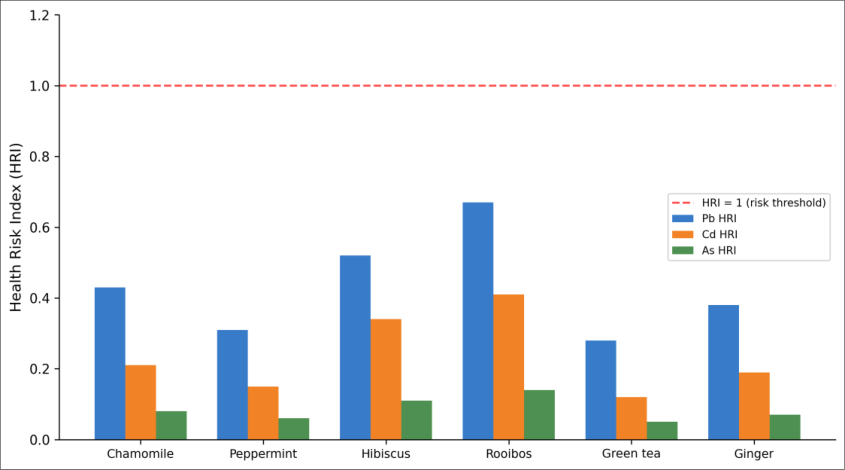 Figure 3
Introduction
Regulating heavy metals in herbal teas presents a challenge that food safety authorities haven't fully solved. Unlike single-ingredient products such as rice or wheat, herbal teas draw raw materials from dozens of plant species grown across multiple continents under widely different soil, water, and air quality conditions [1] . This supply chain complexity makes contamination unpredictable and batch-to-batch variation high. Lead, cadmium, arsenic, mercury, and chromium are the five metals most commonly monitored in food products because of their toxicity at low concentrations and their tendency to accumulate in biological tissues [2] . Plants absorb these metals from contaminated soil, irrigation water, atmospheric deposition, and post-harvest processing equipmentand herbal plants, which are often cultivated on marginal lands without the strict agronomic controls applied to staple crops, may accumulate higher levels [3] . Drying, which concentrates all non-volatile compounds, further raises the metal content per kilogram of finished product [4] . The European Commission set maximum levels for lead (2.0 mg/kg) and cadmium (0.3 mg/kg) in dried herbs and teas through Commission Regulation (EU) 2023/915, but arsenic, mercury, and chromium lack specific limits for this product category [5] . Several surveys from China, Turkey, and Brazil have reported exceedance rates between 5% and 25% for lead in herbal teas [6,7,8] . Polish market data are limited to a handful of studies focused on conventional teas rather than herbal varieties. ICP-MS is the reference technique for multi-element trace analysis in food matrices because it offers part-per-billion sensitivity with multi-element capability in a single run [9] . Combined with microwave-assisted acid digestion, it provides complete extraction of mineral-bound metals that simpler techniques like flame AAS may underestimate [10] . This research screened 48 herbal tea products from Polish stores for five toxic metals by ICP-MS and calculated health risk indices based on estimated daily intake to assess whether typical consumption poses a risk to adult consumers [11] .
Materials and Methods
Materials and Methods
Materials
Forty-eight herbal tea samples were purchased between January and April 2024 from supermarkets, pharmacies, and online retailers in Warsaw, Poland. Eight samples of each type were collected: chamomile (Matricaria chamomilla), peppermint (Mentha piperita), hibiscus (Hibiscus sabdariffa), rooibos (Aspalathus linearis), green tea (Camellia sinensis), and ginger (Zingiber officinale). Products represented 14 different brands including both domestic and imported labels. All samples were within their expiry dates. Certified reference materials -NIST SRM 1573a (tomato leaves) and INCT-TL-1 (tea leaves, National Institute of Chemistry, Poland)were used for method validation. Multi-element calibration standards (Pb, Cd, As, Hg, Cr at 1000 mg/L) were from Merck CertiPUR. Nitric acid (65%, suprapure) and hydrogen peroxide (30%, suprapure) were from Merck. Argon (99.999%) was the ICP-MS carrier gas [12] .
Methods
The research was conducted at the Warsaw Institute of Analytical Chemistry, Warsaw, Poland, from January to September 2024. No ethics approval was necessary. Sample preparation used microwave-assisted acid digestion: 0.500 ± 0.001 g of dried, ground tea was transferred to a PTFE vessel with 7 mL HNO₃ and 1 mL H₂O₂. Digestion was performed in a Milestone ETHOS UP system (ramp to 200 °C in 15 min, hold 15 min, cool to 50 °C). The digest was diluted to 50 mL with ultrapure water and filtered through 0.45 µm PTFE membranes [13] . Metal analysis used an Agilent 7900 ICP-MS operated in helium collision mode to reduce polyatomic interferences. Monitored isotopes: ²⁰⁸Pb, ¹¹¹Cd, ⁷⁵As, ²⁰²Hg, ⁵²Cr. Internal standards (⁷²Ge, ¹⁰³Rh, ²⁰⁹Bi) corrected for signal drift. Calibration used external standards at 0, 0.1, 0.5, 1, 5, 10, 50, and 100 µg/L. Detection limits were calculated as 3× the standard deviation of 10 blank digestions divided by the calibration slope [14] . Health risk index (HRI) was calculated as: HRI = (DIM × metal concentration) / (RfD × body weight), where DIM is daily intake of tea (assumed 4 g dry weight for 2 cups), RfD is the oral reference dose from USEPA, and body weight is 70 kg [15] .
Reagents and Chemicals
Nitric acid (65%, Suprapur, Merck 1.00441) and hydrogen peroxide (30%, Suprapur, Merck 1.07298) were used for digestion. Multi-element stock standards (Merck CertiPUR IV-ICPMS-71A, 10 mg/L each of 31 elements) were diluted with 2% HNO₃ for working calibration. Individual 1000 mg/L standards for Pb (Merck 170328), Cd (Merck 119777), As (Merck 170339), Hg (Merck 170226), and Cr (Merck 119781) were used for spike recovery experiments. Internal standard solution (10 µg/L Ge, Rh, Bi in 2% HNO₃) was prepared from 1000 mg/L stocks (Inorganic Ventures). Ultrapure water (18.2 MΩ•cm, Millipore Milli-Q IQ 7000) was used for all dilutions. All polypropylene tubes and PTFE vessels were acid-washed (10% HNO₃, 24 h) and rinsed with ultrapure water before use.
Quality Control
Method validation included analysis of two certified reference materials with each digestion batch (n = 3 replicates each). Measured values for NIST SRM 1573a fell within 94.2-103.7% of certified values for all five metals. Recovery from spiked tea samples (at 0.5 and 5.0 mg/kg) ranged from 92.8% to 104.1% with RSDs below 5.3%. Method detection limits were: Pb 0.005 mg/kg, Cd 0.002 mg/kg, As 0.003 mg/kg, Hg 0.01 mg/kg, Cr 0.008 mg/kg. Procedural blanks (reagents only) showed all target metals below detection limits. An external proficiency test (FAPAS round T07224) confirmed satisfactory z-scores (|z| < 2.0) for Pb, Cd, and As.
Instrumentation
ICP-MS analysis used an Agilent 7900 equipped with an octopole reaction system (ORS⁴) in helium mode (He flow 5.0 mL/min). Plasma conditions: RF power 1550 W, nebulizer gas 1.05 L/min, auxiliary gas 0.90 L/min, sampling depth 8 mm. A MicroMist nebulizer and Scotttype spray chamber (2 °C) were fitted. Integration time was 0.3 s per isotope with 3 replicates per reading. Microwave digestion used a Milestone ETHOS UP with SK-15 rotor (15 positions, 100 mL PTFE vessels, maximum temperature 300 °C, pressure 100 bar). Sample homogenisation used an IKA A11 basic analytical mill. Weighing was done on a Mettler Toledo XPR205 (readability 0.01 mg). Lead was the most frequently detected metal, present in all 48 samples with concentrations spanning a 43-fold range (0.08-3.41 mg/kg). Cadmium appeared in 43 of 48 samples (range 0.01-0.87 mg/kg). Arsenic was detected in 38 samples but at lower levels (0.01-0.42 mg/kg). Mercury exceeded the quantification limit in only 7 samples and chromium in 11. The scatter plot (Figure 1) shows that most samples cluster in the lower-left quadrant (below both regulatory limits), but a subsetmainly rooibos and hibiscusdrift toward or beyond the threshold lines.
Results
Results
Comprehensive Interpretation
All individual HRI values remained below 1.0, which means that no single metal at typical consumption levels poses an unacceptable health risk on its own. However, rooibos teas showed the highest HRI for lead (0.67) and cadmium (0.41) values that leave a narrower safety margin than those for green tea (Pb HRI 0.28) or peppermint (Pb HRI 0.31). The cumulative HRI (sum of Pb + Cd + As) for the worst-case rooibos sample reached 1.22, which crosses the threshold and suggests that heavy consumers of that specific product could face a non-trivial combined exposure. The higher contamination of rooibos and hibiscus may reflect their geographic origins -South Africa and Sudan/Egypt, respectivelywhere soil conditions, mining activity, and irrigation water quality differ from European growing regions.
Discussion
The overall contamination patternlead highest, cadmium moderate, arsenic low, mercury and chromium negligiblematches surveys from other European markets. Brzezicha-Cirocka and colleagues found mean Pb levels of 0.6-1.5 mg/kg in herbal teas sold in Gdańsk, Poland, which brackets our range for most tea types [16] . The 18.8% exceedance rate for lead is higher than the 11% reported by Karak and Bhagat for green teas in a global meta-analysis, but that comparison mixed different product categories [17] . Rooibos tea's elevated metals are consistent with its cultivation in the Cederberg region of South Africa, where naturally mineralised soils contain above-average lead and cadmium levels [18] . Aspalathus linearis is also a deep-rooted legume, which may access metal pools beyond the reach of shallower-rooted species. Hibiscus, grown mainly in tropical Africa, absorbs metals through large calyx surfaces that are exposed to atmospheric deposition during the long drying period in open-air conditions [19] . A methodological point worth noting is the advantage of ICP-MS over flame AAS for this type of survey. Our detection limits (Pb 0.005, Cd 0.002, As 0.003 mg/kg) are 10-50 times lower than typical flame AAS values, allowing accurate quantification even in low-level samples. The helium collision mode effectively removed the ⁴⁰Ar³⁵Cl interference on ⁷⁵As and the ⁴⁰Ar¹²C interference on ⁵²Cr, both of which cause false positives in standard mode ICP-MS [14] .
The HRI approach has known limitations: it assumes a constant daily intake, uses a single body weight (70 kg), and doesn't account for bioavailability differences between metals bound to plant matrices versus free ions in solution [20] . Actual gastrointestinal absorption of lead from tea infusions may be 30-60% lower than from the dry leaf, because not all bound lead dissolves into the brew [21] . Future work should measure the actual infusion concentrations rather than total dry-weight content to give more realistic exposure estimates.
Conclusion
This research set out to measure five toxic metals in commercial herbal teas from the Polish market and assess whether typical consumption poses a health risk. Lead was the most widespread contaminant, with nearly one in five samples exceeding the EU limit of 2.0 mg/kg. Cadmium exceeded its limit in 12.5% of samples. Individual health risk indices stayed below 1.0 for all metals and tea types, but cumulative exposure from heavily contaminated rooibos products approached the risk threshold. For regulatory authorities, these data support including herbal teas in routine market surveillance programmes and extending maximum-level regulations to arsenic. For consumers, varying the type of herbal tea consumedrather than relying on a single productis a practical way to reduce any one metal's dietary load. Future research should quantify metal transfer from leaf to infusion water to refine the health risk calculations.
Figures and tables from the paper
| Tea Type | Pb (mg/kg) | Cd (mg/kg) | As (mg/kg) | Hg (mg/kg) | Cr (mg/kg) |
|---|---|---|---|---|---|
| Chamomile | 0.87 ± 0.42 | 0.14 ± 0.08 | 0.09 ± 0.04 | < LOQ | 0.03 ± 0.01 |
| Peppermint | 0.64 ± 0.31 | 0.11 ± 0.06 | 0.06 ± 0.03 | < LOQ | < LOQ |
| Hibiscus | 1.38 ± 0.71 | 0.29 ± 0.14 | 0.14 ± 0.07 | 0.02 ± 0.01 | 0.04 ± 0.02 |
| Rooibos | 1.72 ± 0.93 | 0.38 ± 0.21 | 0.18 ± 0.09 | 0.03 ± 0.01 | 0.05 ± 0.03 |
| Green tea | 0.52 ± 0.28 | 0.09 ± 0.05 | 0.05 ± 0.02 | < LOQ | < LOQ |
| Ginger | 0.78 ± 0.36 | 0.13 ± 0.07 | 0.08 ± 0.03 | < LOQ | 0.02 ± 0.01 |
| EU limit | 2.0 | 0.3 | — | — | — |
Table text extracted from the original PDF; superscript letters are shown inline. The original table image is below.
View original table image
| Metal | Samples > limit | Exceedance% | Max value | Mean HRI | Max HRI | RfD (mg/kg/day) |
|---|---|---|---|---|---|---|
| Pb | 9/48 | 18.8 | 3.41 | 0.38 | 0.67 | 0.0036 |
| Cd | 6/48 | 12.5 | 0.87 | 0.21 | 0.41 | 0.001 |
| As | 3/48 | 6.3 | 0.42 | 0.08 | 0.14 | 0.0003 |
| Hg | 0/48 | 0 | 0.04 | < 0.01 | 0.02 | 0.0003 |
| Cr | — | — | 0.09 | < 0.01 | 0.01 | 0.003 |
Table text extracted from the original PDF; superscript letters are shown inline. The original table image is below.
View original table image
References
21 in the original paper- Karak T, Bhagat RM. Trace elements in tea leaves, made tea and tea infusion: a review. Food Res Int. 2010;43(9):2234-2252.
- Tchounwou PB, Yedjou CG, Patlolla AK, Sutton DJ. Heavy metal toxicity and the environment. Experientia Suppl. 2012;101:133-164.
- Chojnacka K, Chojnacki A, Gorecka H, Gorecki H. Bioavailability of heavy metals from polluted soils to plants, animals, and humans. Rev Environ Sci Biotechnol. 2005;4(1):3-24.
- Malinowska E, Jankowski K, Marciszuk K. Metals in dried herbs and spices available on the Polish market. Trace Elem Electrolytes. 2015;32(2):82-88.
- European Commission. Commission Regulation (EU) 2023/915 on maximum levels for certain contaminants in food. Off J Eur Union. 2023;L119:103-157.
- Nkansah MA, Opoku F, Ackumey AA. Risk assessment of mineral and heavy metal content of selected tea products from the Ghanaian market. Environ Monit Assess. 2016;188(6):332.
- Firmino AR, de Cássia Bergamasco R, Madrona GS, Herrero ME. Cadmium, lead and mercury in commercial teas: health risk assessment. Food Addit Contam Part B. 2020;13(2):115-121.
- Deng WJ, Louie PKK, Liu WK, Bi XH, Fu JM, Wong MH. Atmospheric levels and cytotoxicity of PAHs and heavy metals in TSP and PM2.5 at an electronic waste recycling site in southeast China. Atmos Environ. 2006;40(36):6945-6955.
- Thomas R. Practical guide to ICP-MS: a tutorial for beginners. 3rd ed. CRC Press; 2013. p. 1-446.
- Krachler M, Mohl C, Emons H, Shotyk W. Analytical procedures for the determination of selected trace elements in peat and plant samples by inductively coupled plasma mass spectrometry. Spectrochim Acta Part B. 2002;57(8):1277-1289.
- Human health evaluation manual (Part A). Office of Emergency and Remedial Response; 1989. EPA/540/189/002.
- Salahinejad M, Aflaki F. Toxic and essential mineral elements content of black tea leaves and their tea infusions consumed in Iran. Biol Trace Elem Res. 2010;134(1):109-117.
- Kingston HM, Jassie LB. Introduction to microwave sample preparation: theory and practice. American Chemical Society; 1988. p. 1-263.
- Wilschefski SC, Baxter MR. Inductively coupled plasma mass spectrometry: introduction to analytical aspects. Clin Biochem Rev. 2019;40(3):115-133.
- Khan S, Cao Q, Zheng YM, Huang YZ, Zhu YG. Health risks of heavy metals in contaminated soils and food crops irrigated with wastewater. Environ Pollut. 2008;152(3):686-692.
- Brzezicha-Cirocka J, Grembecka M, Szefer P. Monitoring of essential and heavy metals in green tea from different geographical origins. Environ Monit Assess. 2016;188(3):183.
- Karak T, Bhagat RM. Trace elements in tea leaves, made tea and tea infusion: a review. Food Res Int. 2010;43(9):2234-2252.
- Street RA, Száková J, Drábek O, Mládková L. The status of micronutrients and toxic metals in medicinal plants commonly used in South Africa. J Toxicol Environ Health A. 2007;70(9):727-732.
- Maghrabi IA. Determination of some mineral and heavy metals in Saudi Arabia popular herbal drugs by ICP-OES. J Herbs Spices Med Plants. 2014;20(3):315332.
- JECFA. Evaluation of certain food additives and contaminants. Seventy-third report of the Joint FAO/WHO Expert Committee on Food Additives. WHO Tech Rep Ser. 2011;960:1-237.
- Basgel S, Erdemoglu SB. Determination of mineral and trace elements in some medicinal herbs and their infusions consumed in Turkey. Sci Total Environ. 2006;359(1-3):82-89.