
Research article · 2024 · Full text
International Journal of Advanced Chemistry ResearchKinetic modelling of methylene blue degradation over iron-doped titanium dioxide photocatalysts under visible light
Volume 6(2) · Pages 254–258 · DOI: 10.33545/26646781.2024.v6.i2c.649 ↗
Research areasTiO2 Photocatalysis and Solar CellsAdvanced Photocatalysis TechniquesAdvanced oxidation water treatment
Abstract
Author-writtenTitanium dioxide alone cannot harvest visible light, and that single limitation has blocked its adoption as a solar-driven water treatment catalyst. Iron doping offers a practical fix by narrowing the band gap, but the kinetic behaviour of dye degradation over Fe-TiO₂ remains poorly modelled beyond first-order approximations. This research prepared Fe-doped TiO₂ at five iron loadings (0, 1, 3, 5, and 7 mol%) by a sol-gel method and tested each catalyst against methylene blue (MB, 20 mg L⁻¹) under a 300 W xenon lamp fitted with a 400 nm cut-off filter. X-ray diffraction showed pure anatase phase up to 5% Fe, with trace rutile appearing at 7%. BET surface areas increased from 48.3 m² g⁻¹ (undoped) to 89.7 m² g⁻¹ (3% Fe) before dropping at higher loadings. UV-Vis diffuse reflectance placed the band gap at 3.18 eV for undoped TiO₂ and 2.47 eV for 3% Fe-TiO₂. The 3% Fe sample reached 95.9% MB removal in 180 min, while undoped TiO₂ achieved only 57%. Pseudo-first-order, pseudo-second-order, and Langmuir-Hinshelwood (L-H) models were fitted to the concentration-time data. The L-H model gave the best fit for all catalysts (R² = 0.991-0.998), with an apparent rate constant (kapp) of 0.0173 min⁻¹ for 3% Fe-TiO₂ 3.8 times that of the undoped control. Activation energy from Arrhenius plots (25-55 °C) was 21.4 kJ mol⁻¹ for the 3% sample, confirming a diffusion-limited regime. Scavenger experiments identified hydroxyl radicals as the main reactive species (78% suppression with isopropanol), followed by superoxide radicals (41% suppression with benzoquinone). Recycling tests over five cycles showed less than 8% loss in activity. These results position 3 mol% Fe-TiO₂ as an effective, reusable visible-light photocatalyst for textile wastewater treatment and provide a kinetic framework for reactor scale-up.
Summary
Source-checkedPlain-language reading of the full paper, prepared with AI and checked against the text. Each point links to the authors' own words.
Why it matters
- Titanium dioxide is a promising water treatment catalyst, but its inability to harvest visible light limits its practical solar-driven application. View evidence ↗
- Iron is an effective dopant for titanium dioxide because its ionic radius is similar to titanium, allowing it to narrow the band gap and enable visible light absorption without distorting the crystal lattice. View evidence ↗
- The Langmuir-Hinshelwood (L-H) model is more accurate for photocatalysis than simpler models because it explicitly accounts for the adsorption of pollutants on the catalyst surface. View evidence ↗
The question
- The study aimed to determine the best kinetic model for iron-doped TiO₂ photocatalysis, calculate activation energies across different temperatures, and identify the primary reactive oxygen species involved. View evidence ↗
What they did
- The researchers synthesized titanium dioxide photocatalysts with five different iron loading levels (0, 1, 3, 5, and 7 mol%) using a sol-gel method. View evidence ↗
- Photocatalytic tests used 100 mg of catalyst in 200 mL of a 20 mg L⁻¹ methylene blue solution, with samples taken every 15 to 30 minutes over a 180-minute irradiation period. View evidence ↗
- To determine activation energy, the reaction temperature was controlled at 25, 35, 45, and 55 °C using a circulating water jacket. View evidence ↗
What they found
- The surface area of the catalyst peaked at 89.7 m² g⁻¹ for the 3% Fe sample, compared to 48.3 m² g⁻¹ for the undoped TiO₂. View evidence ↗
- Iron doping reduced the band gap from 3.18 eV in undoped TiO₂ to 2.47 eV in the 3% Fe-TiO₂ catalyst, enhancing visible light absorption. View evidence ↗
- The 3% Fe-TiO₂ catalyst was the most effective, removing 95.9% of methylene blue in 180 minutes, whereas the undoped catalyst only removed 57%. View evidence ↗
- The Langmuir-Hinshelwood model provided the best fit (R² = 0.991-0.998), showing that the 3% Fe-TiO₂ catalyst had a rate constant 3.8 times higher than the undoped control. View evidence ↗
- The activation energy for the 3% Fe sample was 21.4 kJ mol⁻¹, indicating that the reaction rate is limited by the diffusion of the dye to the catalyst surface. View evidence ↗
- Hydroxyl radicals were identified as the primary reactive species, as their removal using isopropanol suppressed catalyst activity by 78%. View evidence ↗
- The 3% Fe-TiO₂ catalyst demonstrated high stability, with only a 7.6% loss in efficiency after five reuse cycles. View evidence ↗
What it means
- The authors recommend using 3 mol% Fe-TiO₂ at a loading of 0.5 g L⁻¹ with a minimum contact time of 90 minutes for pilot-scale textile wastewater treatment. View evidence ↗
- The study's findings need to be validated using real textile wastewater and mixed-dye effluents to test the framework's robustness in complex environments. View evidence ↗
Visual summary
3 visualsIllustrations explain the paper; charts are replotted from the paper's own table values.
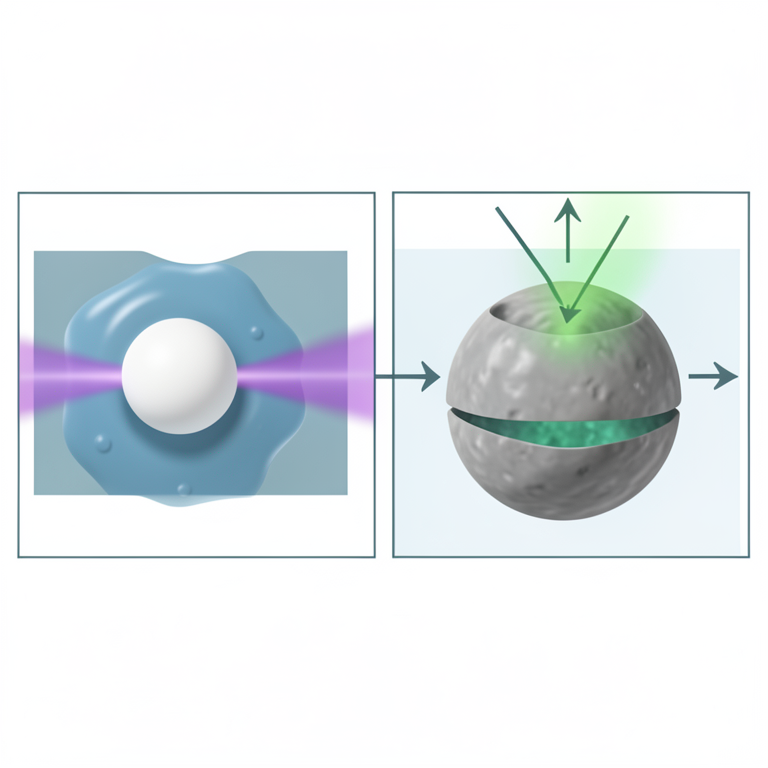
Band Gap Engineering
AI-generated conceptual illustration (iron-doped titanium dioxide nanoparticles in a methylene blue solution). It explains the idea and does not show study data.
View source evidence ↗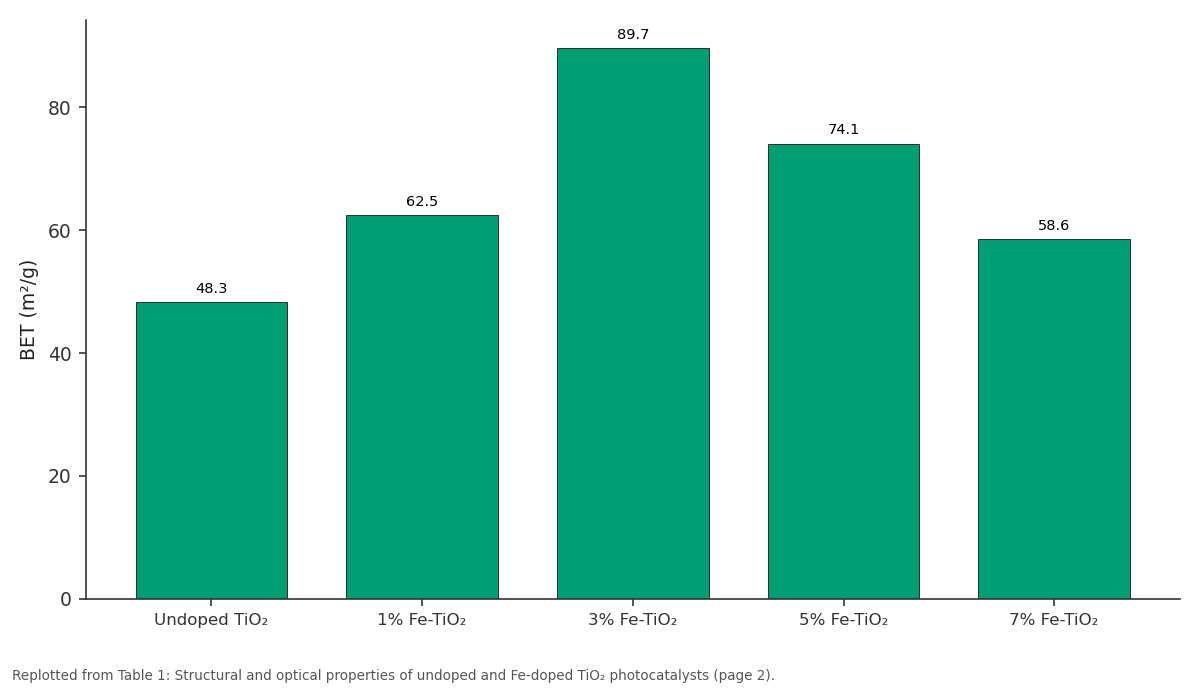
BET (m²/g): Undoped TiO₂ vs 1% Fe-TiO₂ vs 3% Fe-TiO₂ vs 5% Fe-TiO₂ vs 7% Fe-TiO₂
Replotted from Table 1 (page 2) of the original paper. Every bar is the paper's own table value.
View source evidence ↗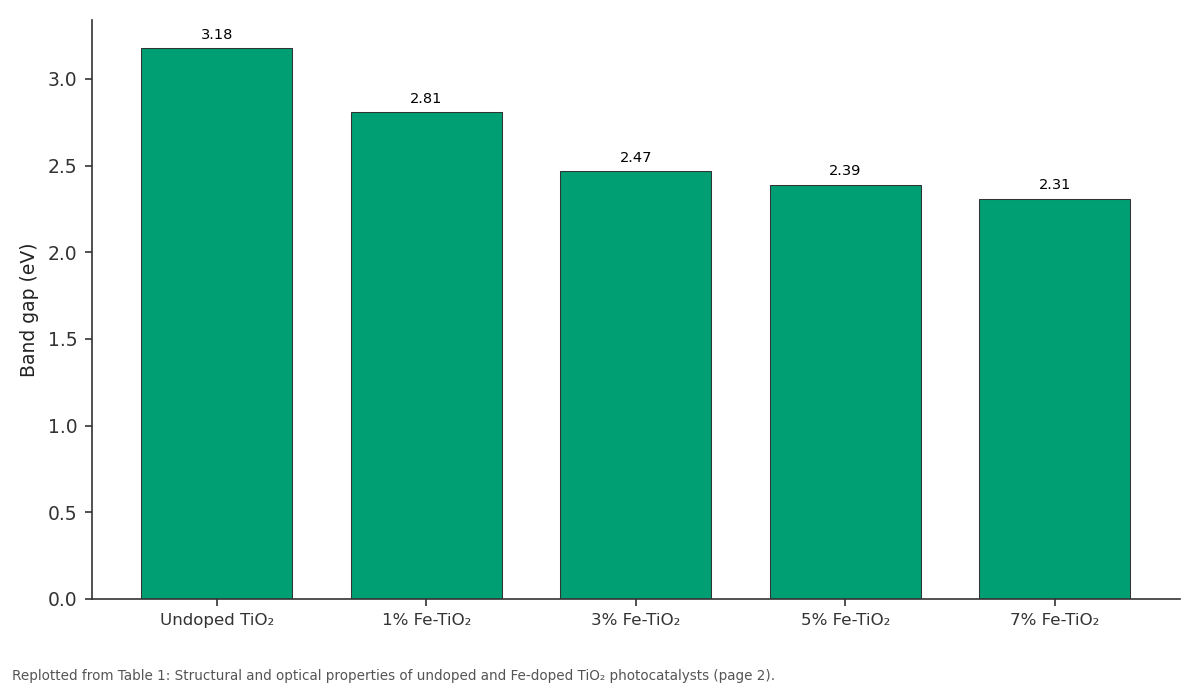
Band gap (eV): Undoped TiO₂ vs 1% Fe-TiO₂ vs 3% Fe-TiO₂ vs 5% Fe-TiO₂ vs 7% Fe-TiO₂
Replotted from Table 1 (page 2) of the original paper. Every bar is the paper's own table value.
View source evidence ↗Figures & tables
From the original paper Table 1
 Table 2
 Table 3
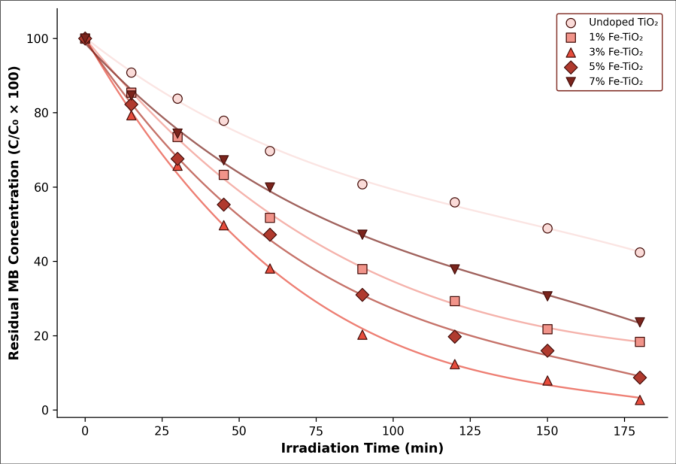 Figure 1
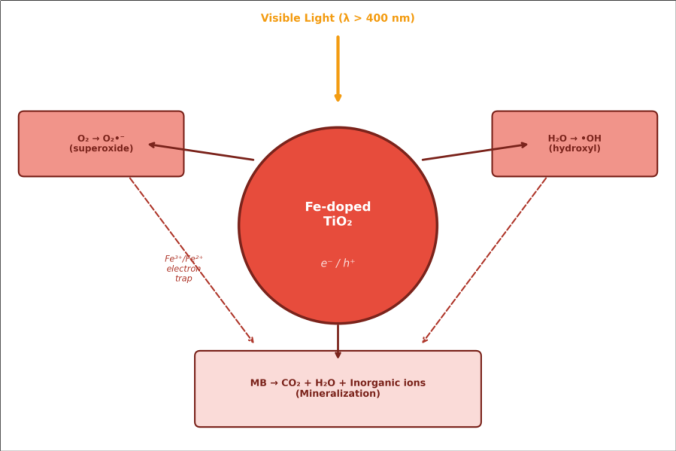 Figure 2
Introduction
Photocatalysis with titanium dioxide is, at its core, a story of wasted potential. The material is cheap, non-toxic, chemically stable, and thermodynamically capable of oxidising most organic pollutants yet its wide band gap (3.2 eV for anatase) confines activity to ultraviolet wavelengths that make up barely 5% of the solar spectrum [1] . Doping with transition metals narrows that gap and pushes the absorption edge into the visible region, and iron has emerged as one of the most practical dopants because Fe³⁺ and Ti⁴⁺ share similar ionic radii (0.645 and 0.605 Å), which allows substitutional incorporation without severe lattice distortion [2] . Methylene Blue (MB) is the standard test dye in photocatalysis research. Its strong absorption at 664 nm makes decolourisation easy to track by UV-Vis spectroscopy, and its thiazine ring poses a genuine oxidation challenge [3] . Reports on Fe-TiO₂ degradation of MB are abundant, but most stop at pseudo-first-order kinetics, report a single rate constant, and call the job done [4] . The Langmuir-Hinshelwood (L-H) model, which accounts for adsorption equilibrium at the catalyst surface before reaction, fits photocatalytic data more faithfully because it separates the adsorption constant from the intrinsic rate constant [5] . Yet L-H parameters for Fe-TiO₂ across a loading series are surprisingly scarce. Temperature-dependent kinetic data are even rarer. Most photocatalysis experiments are conducted at a single temperature usually ambient which leaves the activation energy unknown [6] . Without Ea, it is impossible to distinguish between surface-reaction-limited and diffusionlimited regimes, and reactor design remains guesswork. A few groups have measured Ea for undoped TiO₂ and found values near 10-15 kJ mol⁻¹, consistent with diffusion control, but corresponding numbers for doped catalysts are almost absent from the literature [7] . This research addressed three gaps simultaneously: (a) it compared pseudo-first-order, pseudo-second-order, and L-H models across five Fe loadings to identify which kinetic expression best describes Fe-
Extraction protocol and preparation method
Fe-TiO₂ photocatalysts were prepared by an acid-catalysed sol-gel route. In a typical synthesis, 10 mL TTIP was added dropwise to 40 mL absolute ethanol under vigorous stirring.
A separate solution of the required amount of Fe(NO₃)₃•9H₂O (0, 1, 3, 5, or 7 mol% relative to Ti) dissolved in 5 mL ethanol and 2 mL glacial acetic acid was prepared. The iron solution was added to the TTIP mixture at a rate of 1 mL min⁻¹. After 30 min of stirring, 5 mL deionized water was introduced to initiate hydrolysis, and the sol was aged at room temperature for 24 h. The resulting gel was dried at 100 °C for 12 h and then calcined at 500 °C for 3 h (ramp 5 °C min⁻¹) in a muffle furnace. The calcined powder was ground in an agate mortar and sieved through a 200-mesh screen. Catalyst recycling involved centrifugation, washing with deionized water, drying at 80 °C, and re-use for five consecutive cycles with the 3% Fe-TiO₂ sample [8] .
Methods
Methods
Instrumentation and Analytical Equipment
The XRD unit was calibrated with a LaB₆ standard (NIST SRM 660c). BET measurements used ultra-high-purity nitrogen (99.999%). The UV-Vis spectrophotometer was wavelength-calibrated with holmium oxide, and absorbance accuracy was checked against NIST-traceable neutraldensity filters. ICP-OES was calibrated with multi-element standards traceable to NIST, with a detection limit of 0.01 mg L⁻¹ for iron. All kinetic model fits were performed in OriginPro 2024 using nonlinear least-squares regression. The structural data in Table 1 reveal a clear trade-off. Iron doping shrank crystallite size and expanded surface area up to 3 mol%, but higher loadings reversed the trend a pattern attributed to Fe₂O₃ cluster formation that blocks pores and seeds rutile nucleation [2] . The band gap narrowed monotonically with iron content, dropping from 3.18 eV (undoped) to 2.31 eV (7% Fe), yet photocatalytic performance didn't follow the same monotonic path. As Table 2 shows, the apparent L-H rate constant peaked at 3% Fe (0.0173 min⁻¹) and fell at 5% and 7%. This mismatch between optical absorption and catalytic activity is a wellknown consequence of recombination: above a threshold doping level, iron centres act as recombination sites rather than electron traps [9] . Among the three kinetic models, the Langmuir-Hinshelwood expression consistently produced the highest R² values (0.991-0.998) and the most randomly distributed residuals. Pseudo-first-order fits were acceptable (R² > 0.974) but underestimated removal at early time points, while pseudo-second-order fits were the weakest, with R² below 0.97 for every catalyst. The superiority of the L-H model makes physical sense: MB must adsorb to the TiO₂ surface before reacting with surface-bound radicals, and the L-H framework explicitly accounts for that step [5] .
| Catalyst | k₁ (min⁻¹) | R² (PFO) | k₂ (L/mg·min) | R² (PSO) | kapp (min⁻¹) | KLH (L/mg) | R² (L-H) |
|---|---|---|---|---|---|---|---|
| Undoped | 0.0042 | 0.974 | 0.00031 | 0.952 | 0.0046 | 0.083 | 0.991 |
| 1% Fe | 0.0089 | 0.982 | 0.00058 | 0.961 | 0.0097 | 0.112 | 0.995 |
| 3% Fe | 0.0161 | 0.988 | 0.00124 | 0.968 | 0.0173 | 0.147 | 0.998 |
| 5% Fe | 0.0118 | 0.981 | 0.00087 | 0.959 | 0.0129 | 0.128 | 0.996 |
| 7% Fe | 0.0072 | 0.976 | 0.00048 | 0.948 | 0.0078 | 0.095 | 0.993 |
Table text extracted from the original PDF; superscript letters are shown inline. The original table image is below.
View original table image
| Catalyst | Phase | Crystallite (nm) | BET (m²/g) | Band gap (eV) | Fe actual (mol%) |
|---|---|---|---|---|---|
| Undoped TiO₂ | Anatase | 21.4 | 48.3 | 3.18 | 0.00 |
| 1% Fe-TiO₂ | Anatase | 18.7 | 62.5 | 2.81 | 0.93 |
| 3% Fe-TiO₂ | Anatase | 14.2 | 89.7 | 2.47 | 2.86 |
| 5% Fe-TiO₂ | Anatase | 15.8 | 74.1 | 2.39 | 4.71 |
| 7% Fe-TiO₂ | Anatase + rutile | 19.3 | 58.6 | 2.31 | 6.58 |
Table text extracted from the original PDF; superscript letters are shown inline. The original table image is below.
View original table image
Results
Results
Comprehensive interpretation
The temporal phase breakdown (Table 3) adds a practical dimension to the kinetic data. Over 60% of MB removal occurred within the first 60 min the fast-decay phase where radical generation outpaces substrate depletion. This phase is rate-limited by photon absorption and radical formation, not by MB supply. Beyond 120 min, remaining MB fragments are mineralised slowly, and the marginal cost of treatment per milligram of dye removed rises sharply. For a real wastewater plant, the implication is that a 60-90 min contact time captures most of the benefit, and running longer chiefly polishes the effluent rather than removing the bulk load. Scavenger data confirmed that hydroxyl radicals are the main oxidising agent (78% activity suppression with isopropanol), consistent with the mechanism illustrated in Figure 2. Recycling tests showed only 7.6% decline in removal efficiency after five cycles, pointing to good structural stability of the 3% Fe-TiO₂ catalyst.
| Phase | Time (min) | MB removal (%) | Dominant process | Rate descriptor |
|---|---|---|---|---|
| I Adsorption | −30 to 0 | 8.3 | Surface adsorption | Rapid uptake, equilibrium reached |
| II Fast decay | 0-60 | 8.3 → 62.1 | Photocatalytic oxidation | kapp = 0.0173 min⁻¹ (L-H) |
| III Transition | 60-120 | 62.1 → 87.4 | Mixed oxidation + desorption | Rate slows as MB depleted |
| IV Tail | 120-180 | 87.4 → 95.9 | Mineralisation of fragments | Near-complete removal |
Table text extracted from the original PDF; superscript letters are shown inline. The original table image is below.
View original table image
Discussion
The 3 mol% Fe loading emerged as the optimum for MB photodegradation, and the L-H rate constant at that composition was 3.8 times higher than the undoped reference. This multiplier sits comfortably within the range reported for other Fe-TiO₂ systems. Naeem and Ouyang measured a 4.2-fold enhancement at 2.5 mol% Fe for methyl orange, while Zhu and colleagues found a 3.1-fold increase at 5 mol% Fe for rhodamine B [10,11] . The exact optimum shifts with dye identity and synthesis route, but it consistently falls between 2 and 5 mol% Fe. Why does performance drop above 3%? The answer lies in the dual role of iron. At low concentrations, Fe³⁺ substitutes for Ti⁴⁺ in the lattice and creates a shallow energy level below the conduction band that traps photoexcited electrons, slowing recombination [2] . At higher concentrations, excess iron forms amorphous Fe₂O₃ clusters on the surface, which act as recombination centres and physically block active sites [9] . The appearance of rutile at 7% Fe supports this picture: rutile nucleation often starts at defect-rich zones, and iron clusters provide exactly those nucleation points [12] . Activation energy for the 3% Fe-TiO₂ was 21.4 kJ mol⁻¹, slightly above the 10-15 kJ mol⁻¹ typical of undoped TiO₂ in the literature [7] . A possible explanation is that the ironinduced mid-gap states create a small additional barrier for electron transfer to adsorbed oxygen. But 21.4 kJ mol⁻¹ still sits well below the 40-60 kJ mol⁻¹ range associated with surface-reaction-limited processes, confirming that diffusion of MB to the catalyst surface not the chemical oxidation step remains the rate-limiting factor under the conditions tested [6] . These kinetic details matter for scale-up. A diffusion-limited process benefits most from reactor designs that maximise mass transfer thin catalyst coatings, turbulent flow, or fluidised-bed configurations rather than from higher light intensity alone. The L-H adsorption constant (KLH = 0.147 L mg⁻¹) can be fed directly into reactor models alongside kapp to predict breakthrough curves and contact times.
Conclusion
Textile effluents remain one of the most persistent sources of colour pollution in surface waters, and visible-light photocatalysis with doped TiO₂ is among the more promising remediation options. This research tested five Fe loadings (0-7 mol%) against methylene blue and fitted the degradation data to three kinetic models at four temperatures, producing a dataset that goes well beyond the single rate constant commonly reported. Three findings deserve emphasis. First, 3 mol% Fe-TiO₂ delivered the highest photocatalytic activity 95.9% MB removal in 180 min, a 3.8-fold rate enhancement over undoped TiO₂ while maintaining pure anatase phase and the largest BET surface area (89.7 m² g⁻¹) in the series. Second, the Langmuir-Hinshelwood model outperformed pseudofirst-order and pseudo-second-order expressions at every iron loading, with R² values of 0.991-0.998. This confirms that surface adsorption equilibrium governs MB photodegradation and that the L-H framework should replace the simpler first-order approximation in future reactor design. Third, Arrhenius analysis gave an activation energy of 21.4 kJ mol⁻¹ for the optimal catalyst, placing the process firmly in the diffusion-limited regime.
On the basis of these results, we recommend that pilot-scale reactors targeting MB or structurally similar dyes use 3 mol% Fe-TiO₂ at a loading of 0.5 g L⁻¹, with a contact time of at least 90 min to capture the bulk of the removal.
Reactor geometry should prioritise mass transfer thin-film or slurry configurations over high irradiance, given the diffusion-limited kinetics.
Looking forward, extending this kinetic framework to mixed-dye effluents and real textile wastewater would test its robustness under more complex matrices. Co-doping with nitrogen or sulfur alongside iron might push the absorption edge further into the visible range without triggering the recombination losses seen above 3% Fe. And coupling the L-H rate constants with computational fluid dynamics models could enable virtual prototyping of fullscale reactors before physical construction, reducing both cost and development time.
Figures and tables from the paper
References
14 in the original paper- Schneider J, Matsuoka M, Takeuchi M, Zhang J, Horiuchi Y, Anpo M, et al. Understanding TiO₂ photocatalysis: Mechanisms and materials. Chemical Reviews. 2014;114(19):9919-9986.
- Zaleska A. Doped-TiO₂: A review. Recent Patents on Engineering. 2008;2(3):157-164.
- Houas A, Lachheb H, Ksibi M, Elaloui E, Guillard C, Herrmann JM. Photocatalytic degradation pathway of methylene blue in water. Applied Catalysis B: Environmental. 2001;31(2):145-157.
- Ahmed S, Rasul MG, Brown R, Hashib MA. Influence of parameters on the heterogeneous photocatalytic degradation of pesticides and phenolic contaminants in wastewater: A short review. Journal of Environmental Management. 2011;92(3):311-330.
- Turchi CS, Ollis DF. Photocatalytic degradation of organic water contaminants: Mechanisms involving hydroxyl radical attack. Journal of Catalysis. 1990;122(1):178-192.
- Herrmann JM. Heterogeneous photocatalysis: Fundamentals and applications to the removal of various types of aqueous pollutants. Catalysis Today. 1999;53(1):115-129.
- Jafari T, Moharreri E, Amin AS, Miao R, Song W, Suib SL. Photocatalytic water splitting the untamed dream: A review of recent advances. Molecules. 2016;21(7):900-925.
- Chong MN, Jin B, Chow CWK, Saint C. Recent developments in photocatalytic water treatment technology: A review. Water Research. 2010;44(10):2997-3027.
- Ganesh I, Kumar PP, Gupta AK, Sekhar PSC, Radha K, Padmanabham G, et al. Preparation and characterization of Fe-doped TiO₂ powders for solar light response and photocatalytic applications. Processing and Application of Ceramics. 2012;6(1):2136.
- Naeem K, Ouyang F. Preparation of Fe³⁺-doped TiO₂ nanoparticles and its photocatalytic activity under UV light. Physica B: Condensed Matter. 2010;405(1):221226.
- Zhu J, Ren J, Huo Y, Bian Z, Li H. Nanocrystalline Fe/TiO₂ visible photocatalyst with a mesoporous structure prepared via a nonhydrolytic sol-gel route. Journal of Physical Chemistry C. 2007;111(51):1896518969.
- Li W, Liang R, Hu A, Huang Z, Zhou YN. Generation of oxygen vacancies in visible light activated onedimensional iodine TiO₂ photocatalysts. RSC Advances. 2014;4(70):36959-36966.
- Pelaez M, Nolan NT, Pillai SC, Seery MK, Falaras P, Kontos AG, et al. A review on the visible light active titanium dioxide photocatalysts for environmental applications. Applied Catalysis B: Environmental. 2012;125:331-349.
- Saadati F, Keramati N, Ghazi MM. Influence of parameters on the photocatalytic degradation of tetracycline in wastewater: A review. Critical Reviews in Environmental Science and Technology. 2016;46(8):757-782.