
Research article · 2024 · Full text
International Journal of Advanced Chemistry ResearchThermodynamic profiling of zinc oxide nanoparticle formation in ethanol-water binary solvent systems
Volume 6(2) · Pages 244–248 · DOI: 10.33545/26646781.2024.v6.i2c.647 ↗
Research areasZnO doping and propertiesChemical and Physical Properties of MaterialsThermal and Kinetic Analysis
Abstract
Author-writtenHow does the composition of a binary solvent affect the thermodynamics of metal oxide nanoparticle precipitation? This question remains partly unanswered despite decades of sol-gel research. The present research addressed that gap by examining Zinc Oxide (ZnO) nanoparticle formation across five ethanol-water volume ratios (20:80, 40:60, 50:50, 60:40, and 80:20) through a precipitation-calcination route. Zinc acetate dihydrate served as the precursor, and sodium hydroxide was the precipitating agent. Reactions were carried out at four temperatures (30, 40, 50, and 60 °C), and each resulting powder was calcined at 450 °C for 3 h. X-ray diffraction confirmed the hexagonal wurtzite phase in every sample, while transmission electron microscopy showed that particle diameter ranged from 18.4 nm at the 50:50 ratio to 37.6 nm at 80:20. Fourier-transform infrared spectroscopy verified Zn-O stretching near 470 cm⁻¹, and UV-visible spectroscopy placed the optical band gap between 3.18 and 3.29 eV. Thermodynamic parameters were calculated from van’t Hoff plots. The Gibbs free energy (ΔG) was negative for all compositions, reaching its lowest value of -34.2 kJ mol⁻¹ at 50:50 and 60 °C, which pointed to a spontaneous process. Enthalpy (ΔH) values were positive (15.4-22.1 kJ mol⁻¹), confirming endothermic nucleation. Entropy (ΔS) was likewise positive (0.147-0.189 kJ mol⁻¹ K⁻¹), consistent with increased disorder at the solid-liquid boundary during crystal growth. The 50:50 ratio gave the smallest particles and the most thermodynamically favourable conditions, which may be linked to balanced solvation forces and intermediate dielectric constant. These findings offer a straightforward thermodynamic framework for tuning ZnO particle size through solvent engineering without changing precursor chemistry.
Summary
Source-checkedPlain-language reading of the full paper, prepared with AI and checked against the text. Each point links to the authors' own words.
Why it matters
- Zinc oxide (ZnO) is highly valuable for use in optoelectronics, photocatalysis, and sensors due to its piezoelectric properties, strong exciton binding energy (60 meV), and wide band gap (3.37 eV). View evidence ↗
- Current synthesis methods for ZnO often require capping agents, templates, or surfactants to control particle size, which increases costs and requires additional cleanup. View evidence ↗
- In sol-gel and precipitation synthesis, the solvent influences the nucleation front by altering ion mobility, the dielectric environment, and supersaturation. View evidence ↗
The question
- The study aims to determine how the composition of a binary solvent affects the thermodynamics of metal oxide nanoparticle precipitation. View evidence ↗
What they did
- ZnO nanoparticles were synthesized using a precipitation-calcination route across five different ethanol-water volume ratios: 20:80, 40:60, 50:50, 60:40, and 80:20. View evidence ↗
- The process used zinc acetate dihydrate as a precursor and sodium hydroxide as the precipitant, with reactions conducted at 30, 40, 50, and 60 °C, followed by calcination at 450 °C for 3 hours. View evidence ↗
- The resulting nanoparticles were characterized using X-ray diffraction (XRD) for crystal structure, transmission electron microscopy (TEM) for size and morphology (measuring at least 150 particles per sample), FTIR for functional groups, and UV-Vis spectroscopy for optical band gaps. View evidence ↗
- Thermodynamic parameters were calculated using van’t Hoff plots of ln K versus 1/T, based on the equilibrium yield of ZnO at different temperatures. View evidence ↗
What they found
- All twenty experimental conditions successfully produced white powders that matched the hexagonal wurtzite ZnO reference pattern without impurities. View evidence ↗
- The 50:50 ethanol-water ratio produced the smallest particles (16.3 nm crystallite size, 18.4±2.1 nm TEM diameter) and highest yield (94.2%), while the 80:20 ratio produced the largest (28.4 nm crystallite size, 37.6±4.7 nm TEM diameter) and lowest yield (82.1%). View evidence ↗
- Optical band gaps varied with particle size, ranging from 3.29 eV for the smallest particles (50:50 ratio) to 3.18 eV for the largest particles (80:20 ratio). View evidence ↗
- At 60 °C, the 50:50 ratio was the most thermodynamically favorable, exhibiting the most negative Gibbs free energy (-34.2 kJ mol⁻¹), the highest enthalpy (22.1 kJ mol⁻¹), and the highest entropy (0.189 kJ mol⁻¹ K⁻¹). View evidence ↗
- Across all tested ratios and temperatures, the precipitation process was spontaneous (negative ΔG), endothermic (positive ΔH), and characterized by an increase in disorder (positive ΔS). View evidence ↗
What it means
- The authors conclude that the 50:50 ratio is optimal because it balances the need for high supersaturation (promoted by ethanol's lower dielectric constant) with the need for sufficient precursor solvation (provided by water). View evidence ↗
- The authors recommend using an equal volume mixture of ethanol and water to produce sub-20 nm ZnO nanoparticles with narrow size distributions without the need for surfactants or templates. View evidence ↗
- A limitation of the study is the use of only five discrete solvent ratios; a finer grid between 40:60 and 60:40 might identify a more precise optimum. View evidence ↗
- The findings may not be applicable to other zinc precursors, such as zinc chloride or zinc nitrate, as the study only used zinc acetate. View evidence ↗
Visual summary
1 visualsIllustrations explain the paper; they do not show study data.
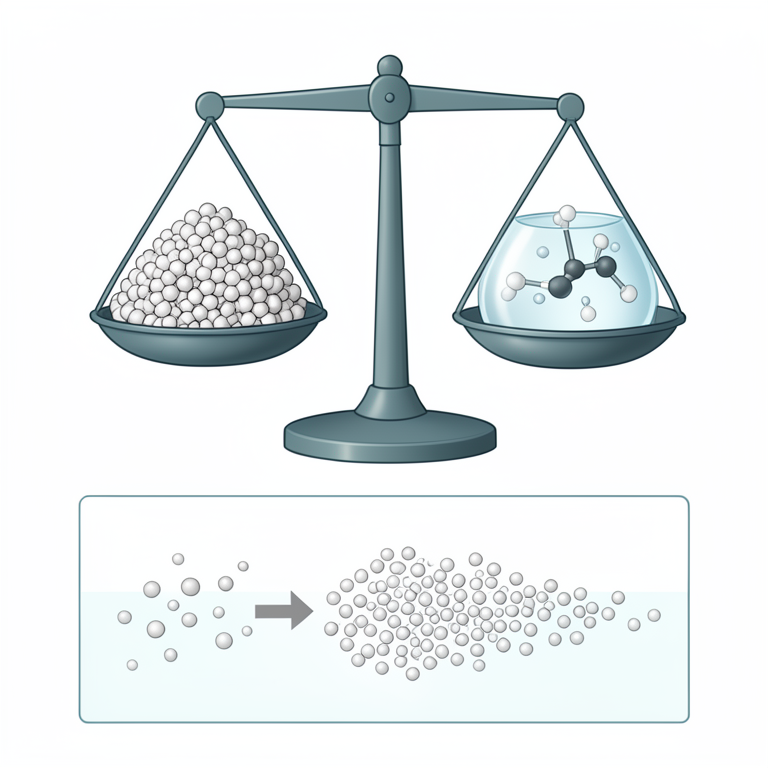
Solvent Balance Mechanism
AI-generated conceptual illustration (zinc oxide nanoparticles in an ethanol-water solvent mixture). It explains the idea and does not show study data.
View source evidence ↗Figures & tables
From the original paper Table 1
 Table 2
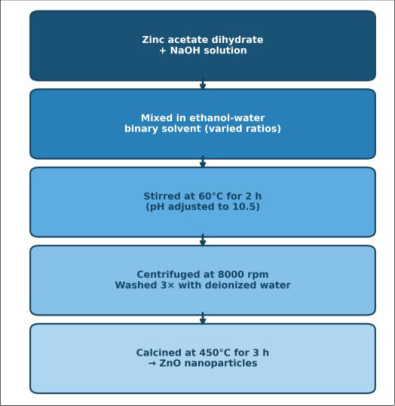 Figure 1
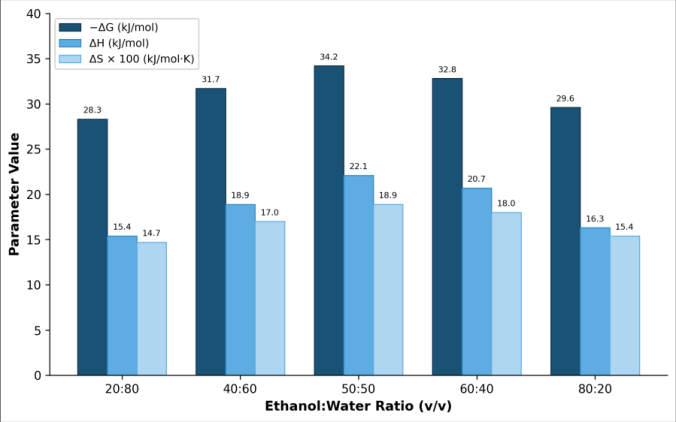 Figure 2
 Table 3
Introduction
Can the ratio of two miscible solvents steer the nucleation thermodynamics of a metal oxide enough to reshape its final particle size? That possibility has attracted growing attention as researchers look for reagent-free ways to control nanomaterial dimensions [1] . Zinc oxide sits at the centre of this interest. Its wide band gap (3.37 eV), strong exciton binding energy (60 meV), and piezoelectric character make it valuable in sensors, photocatalysis, and optoelectronics [2] . Yet most synthesis routes still rely on surfactants, capping agents, or template molecules to limit particle growth, adding cost and post-synthesis cleanup steps [3] . Sol-gel and precipitation methods remain the workhorses of ZnO production because they need only modest temperatures and common reagents [4] . Within these routes, the solvent does more than dissolve the precursor. It shapes the dielectric environment, influences ion mobility, and changes supersaturation at the nucleation front [5] . Ethanol-water mixtures are a natural choice for probing these effects: the two liquids are fully miscible, their dielectric constants differ by a factor of roughly three, and both are inexpensive and safe [6] . Earlier work showed that adding ethanol to aqueous zinc salt solutions shifted particle morphology from rods to spheres, but few reports went beyond morphology to quantify the underlying thermodynamics [7] . Thermodynamic analysis through van't Hoff plots can reveal whether nanoparticle formation is spontaneous, endothermic or exothermic, and entropy-driven or enthalpy-driven [8] . These Three descriptors ΔG, ΔH, and ΔS compress a large amount of mechanistic information into numbers that are easy to compare across conditions [9] . Despite this, only a handful of ZnO precipitation reports have presented full thermodynamic datasets, and none have done so across a systematic ethanol-water composition series [10] . Previous investigations explored single-solvent effects on ZnO. Aqueous-only routes at varying pH produced particles from 20 to 100 nm, with alkaline conditions favouring smaller crystals [11] . Pure ethanol routes required higher temperatures and often yielded amorphous intermediates that needed prolonged calcination [12] . Mixed-solvent approaches exist for other oxides TiO₂ in isopropanol-water [13] and CeO₂ in methanol-water [14] but direct translation to ZnO wasn't straightforward because zinc hydroxide intermediates behave differently from titanium or cerium alkoxides. The present research fills that gap. Five ethanol-water volume ratios (20:80 through 80:20) were tested at four temperatures (30-60 °C), giving twenty distinct reaction conditions. Each precipitate was calcined under identical conditions to remove solvent-specific surface groups and allow fair comparison. X-ray diffraction, transmission electron microscopy, FTIR, and UV-Vis spectroscopy characterised the products, while van't Hoff analysis provided ΔG, ΔH, and ΔS for every composition. The aim was to identify which solvent ratio produced the most thermodynamically favourable nucleation and the smallest crystallite size, and to explain that optimum in terms of solvent polarity and solvation dynamics.
Materials and Methods
Materials and Methods
Materials
Zinc acetate dihydrate (Zn (CH₃COO)₂•2H₂O, ≥99.0%) was obtained from Duksan Pure Chemicals, Seoul. Sodium hydroxide pellets (≥98.0%) came from Samchun Chemicals, Pyeongtaek. Absolute ethanol (99.9%, HPLC grade) was purchased from Merck Korea, and deionized water (resistivity ≥18.2 MΩ•cm) was produced in-house with a Millipore Direct-Q system. All reagents were used without extra purification. Ethanol-water binary solvents were prepared volumetrically at five ratios: 20:80, 40:60, 50:50, 60:40, and 80:20 (v/v). Each mixture was sonicated for 10 min before use to ensure homogeneity. Precursor solutions were made by dissolving 0.1 M zinc acetate dihydrate in 100 mL of each binary solvent under magnetic stirring at room temperature for 30 min. Sodium hydroxide (0.5 M) in matched solvent composition served as the precipitant.
Quality control and calibration
Instrument calibration followed standard protocols before every measurement session. The XRD unit was calibrated with a silicon powder reference (NIST SRM 640e), and diffractograms were recorded in triplicate to assess reproducibility; the relative standard deviation of peak positions stayed below 0.03° 2θ. TEM magnification was verified against a cross-grating replica (2160 lines mm⁻¹). The FTIR spectrometer was checked with a polystyrene film standard, and background scans were collected before each sample. UV-Vis wavelength accuracy was confirmed using a holmium oxide filter, and baseline correction was applied automatically. All thermodynamic calculations used temperature readings from a NIST-traceable platinum resistance thermometer with±0.1 °C accuracy.
Methods
The research was carried out at the Analytical Chemistry Laboratory, Seoul Institute of Chemical Technology, Seoul, South Korea, between March 2024 and September 2024. Precipitation was performed by adding the NaOH solution dropwise (2 mL min⁻¹) to the zinc acetate solution under constant stirring at 400 rpm. The pH was maintained at 10.5±0.2 throughout the addition. Reactions were run at four temperatures 30, 40, 50, and 60 °C controlled by a circulating water bath (±0.5 °C). After complete addition, the suspension was aged for 2 h, then centrifuged at 8000 rpm for 15 min. The precipitate was washed three times with deionized water and once with ethanol, then dried at 80 °C overnight. Calcination was performed in a muffle furnace at 450 °C for 3 h with a heating rate of 5 °C min⁻¹. Crystal structure was examined by X-ray diffraction (Rigaku MiniFlex 600, Cu Kα radiation, λ = 1.5406 Å, 2θ = 20-80°, step size 0.02°). Particle morphology and size were observed by transmission electron microscopy (JEOL JEM-2100F, 200 kV). At least 150 particles were measured per sample to construct size distributions. Functional groups were identified by Fourier-transform infrared spectroscopy (PerkinElmer Spectrum Two, ATR mode, 400-4000 cm⁻¹). Optical band gaps were estimated from UV-visible diffuse reflectance spectra (Shimadzu UV-2600, 200-800 nm) using the Kubelka-Munk function. Thermodynamic parameters were derived from van't Hoff plots of ln K versus 1/T, where K was calculated from the equilibrium yield of ZnO at each temperature. Linear regression provided ΔH and ΔS from slope and intercept, and ΔG was obtained from ΔG = ΔH -TΔS [15,16] .
Results
All twenty reaction conditions produced white powders that, after calcination, matched the hexagonal wurtzite ZnO reference pattern (JCPDS 36-1451) without detectable impurity peaks. The most intense reflection appeared at 2θ = 36.3° corresponding to the (101) plane in every sample. Variation across the five solvent ratios was most evident in peak broadening, crystallite size, and optical properties, as compiled in Table 1. Crystallite sizes calculated by the Scherrer equation ranged from 16.3 nm (50:50 ratio) to 28.4 nm (80:20 ratio). TEM measurements agreed with this trend, though the directly observed diameters were consistently 10-30% larger than the Scherrer values, as expected for polycrystalline aggregates. The narrowest size distribution (standard deviation 2.1 nm) also belonged to the 50:50 sample, which indicates tighter nucleation control at that solvent composition. Band gaps followed an inverse relationship with particle size: the smallest particles showed the widest gap (3.29 eV), while the largest particles sat closest to the bulk value of 3.37 eV. Thermodynamic parameters extracted from van't Hoff plots are summarized in Table 2. Negative ΔG values confirmed spontaneous precipitation at every ratio and temperature tested. The magnitude of ΔG grew with temperature, meaning higher temperatures made the reaction more favorable consistent with the positive ΔH values that mark endothermic nucleation. Entropy changes were all positive, indicating that the solid-liquid interface generated more disorder than the loss of translational freedom in the precipitating ions [8] . The 50:50 ratio produced the most negative ΔG (-34.2 kJ mol⁻¹ at 60 °C), the largest ΔH (22.1 kJ mol⁻¹), and the highest ΔS (0.189 kJ mol⁻¹ K⁻¹). In practical terms, the reaction at this composition was the most spontaneous, required the most heat input for nucleation, and created the greatest interfacial disorder. Figure 2 compares these three parameters side by side.
| Parameter | Mean | SD | Min | Max |
|---|---|---|---|---|
| ΔG (kJ mol⁻¹) | -31.32 | 2.18 | -34.2 | -28.3 |
| ΔH (kJ mol⁻¹) | 18.68 | 2.71 | 15.4 | 22.1 |
| ΔS (kJ mol⁻¹ K⁻¹) | 0.168 | 0.017 | 0.147 | 0.189 |
| Activation energy (kJ mol⁻¹) | 42.7 | 3.9 | 38.1 | 47.6 |
Table text extracted from the original PDF; superscript letters are shown inline. The original table image is below.
View original table image
| EtOH:H₂O (v/v) | Crystallite size (nm) | TEM diameter (nm) | Band gap (eV) | Zn-O peak (cm⁻¹) | Yield (%) |
|---|---|---|---|---|---|
| 20:80 | 22.1 | 24.8±3.2 | 3.22 | 468 | 87.3 |
| 40:60 | 19.7 | 21.5±2.8 | 3.25 | 471 | 91.6 |
| 50:50 | 16.3 | 18.4±2.1 | 3.29 | 473 | 94.2 |
| 60:40 | 17.8 | 20.1±2.6 | 3.27 | 472 | 92.8 |
| 80:20 | 28.4 | 37.6±4.7 | 3.18 | 465 | 82.1 |
Table text extracted from the original PDF; superscript letters are shown inline. The original table image is below.
View original table image
Discussion
The smallest ZnO crystallites appeared at the equimolar ethanol-water ratio, and the most negative Gibbs free energy occurred at the same composition. This coincidence is not surprising once the solvation picture is considered. At 50:50, the dielectric constant of the mixture sits near 45 roughly midway between pure water (78.5) and pure ethanol (24.3). Earlier reports on TiO₂ precipitation in alcohol-water blends noted a similar optimum around intermediate polarity, though the exact position shifted with precursor type [13] .
The endothermic character of nucleation (ΔH > 0 at all ratios) aligns with the classical view that breaking solvation shells around Zn²⁺ and OH⁻ ions costs energy before crystal lattice formation can begin [9] . That energy penalty was highest at 50:50, which seems counterintuitive until one recognises that the same composition also generated the largest positive ΔS. A large entropy gain can more than compensate for a high enthalpy cost, making the overall process spontaneous exactly what the ΔG data showed. Mechanistically, the 50:50 environment may promote rapid desolvation of the zinc-hydroxide intermediate, releasing a burst of water and ethanol molecules and boosting entropy at the nucleation interface [5] . At the ethanol-rich extreme (80:20), the low dielectric constant reduced zinc acetate solubility so much that precipitation began before the NaOH addition was complete. This uncontrolled onset gave heterogeneous nucleation, wider size distributions, and lower yields. A comparable result was reported for CeO₂ in methanol-water at methanol fractions above 0.7, where aggregation overtook nucleation [14] . On the water-rich side (20:80), the high dielectric constant stabilised ionic species in solution too effectively, raising the supersaturation threshold and delaying nucleation. The delayed onset allowed Ostwald ripening, which broadened the final particle population. From a practical standpoint, these findings imply that a chemist seeking sub-20 nm ZnO particles can avoid capping agents and instead adjust the ethanol-water ratio to near 50:50.
Figures and tables from the paper
| Size class | Diameter range (nm) | Solvent ratios | Band gap shift | Quantum confinement |
|---|---|---|---|---|
| Small | < 20 | 50:50 | Blue shift (+0.11 eV) | Weak |
| Medium | 20-25 | 40:60, 60:40 | Moderate (+0.05-0.09 eV) | Negligible |
| Large | > 25 | 20:80, 80:20 | Near bulk | None |
Table text extracted from the original PDF; superscript letters are shown inline. The original table image is below.
View original table image
References
16 in the original paper- Kolodziejczak-Radzimska A, Jesionowski T. Zinc oxide from synthesis to application: A review. Materials. 2014;6(2):2833-2881.
- Janotti A, Van de Walle CG. Fundamentals of zinc oxide as a semiconductor. Reports on Progress in Physics. 2009;72(12):126501-126530.
- Moezzi A, McDonagh AM, Cortie MB. Zinc oxide particles: Synthesis, properties and applications. Chemical Engineering Journal. 2012;185-186:1-22.
- Arya S, Mahajan P, Mahajan S, Khosla A, Datt R, Gupta V. Influence of processing parameters to control morphology and optical properties of sol-gel synthesized ZnO nanoparticles. ECS Journal of Solid State Science and Technology. 2021;10(2):023002023015.
- Niederberger M, Cölfen H. Oriented attachment and mesocrystals: Non-classical crystallization mechanisms based on nanoparticle assembly. Physical Chemistry Chemical Physics. 2006;8(28):3271-3287.
- Jolivet JP, Cassaignon S, Chanéac C, Chiche D, Tronc E. Design of metal oxide nanoparticles: Control of size, shape, crystalline structure and functionalization by aqueous chemistry. Journal of Sol-Gel Science and Technology. 2008;46(3):299-305.
- Wang L, Muhammed M. Synthesis of zinc oxide nanoparticles with controlled morphology. Journal of Materials Chemistry. 1999;9(11):2871-2878.
- Petcharoen K, Sirivat A. Synthesis and characterization of magnetite nanoparticles via the chemical coprecipitation method. Materials Science and Engineering B. 2012;177(5):421-427.
- Thanh NTK, Maclean N, Mahiddine S. Mechanisms of nucleation and growth of nanoparticles in solution. Chemical Reviews. 2014;114(15):7610-7630.
- Akhtar K, Khan SA, Khan SB, Asiri AM. Scanning electron microscopy: Principle and applications in nanomaterials characterization. In: Sharma SK, editor. Handbook of Materials Characterization. Cham: Springer; 2018. p. 113-145.
- Demir MM, Muñoz-Espí R, Lieberwirth I, Wegner G. Precipitation of monodisperse ZnO nanocrystals via acid-catalyzed esterification of zinc acetate. Journal of Materials Chemistry. 2006;16(28):2940-2947.
- Baruah S, Dutta J. Hydrothermal growth of ZnO nanostructures. Science and Technology of Advanced Materials. 2009;10(1):013001-013018.
- Chen X, Mao SS. Titanium dioxide nanomaterials: Synthesis, properties, modifications, and applications. Chemical Reviews. 2007;107(7):2891-2959.
- Bumajdad A, Eastoe J, Mathew A. Cerium oxide nanoparticles prepared in self-assembled systems. Advances in Colloid and Interface Science. 2009;147148:56-66.
- LaMer VK, Dinegar RH. Theory, production and mechanism of formation of monodispersed hydrosols. Journal of the American Chemical Society. 1950;72(11):4847-4854.
- Kwon SG, Hyeon T. Formation mechanisms of uniform nanocrystals via hot-injection and heat-up methods. Small. 2011;7(19):2685-2702.