
Research article · 2026 · Full text
International Journal of Geography Geology and EnvironmentGeographical analysis of radon gas concentrations in tap water across designated communities of Kufa city
Volume 8(5) · Pages 41–46 · DOI: 10.22271/27067483.2026.v8.i5a.752 ↗
Research areasRadioactivity and Radon MeasurementsWater Quality and Resources StudiesWater Quality and Pollution Assessment
Abstract
Author-writtenRadon is an oven gas and a naturally occurring radioactive element that can enter drinking water systems, dissolve in groundwater or be inhaled. This article is concerned with the geographical study that was done for the radon levels in the tap water for several districts of Kufa City, Iraq. It highlights spatial variation of the levels and their comparison to the international safety requirements. A total of 126 water samples were taken from three locations, 90 samples from the Misan neighborhood, 16 samples from the Sarai district and 20 samples from the Maytham Al-Tammar neighborhood. Radon samples were collected in hermetic glass containers to avoid the radon to escape. Solid-alpha spectrometry and closed-loop aeration with the RAD7 electronic radon detector was utilized to test for radon. The detected amounts were reported in Bq/L and compared to standard levels specified by the U.S. Environmental Protection Agency.Radon levels varied between 2.1 to 7.8 Bq/L in Misan (mean: 4.9 Bq/L), 1.8 to 6.2 Bq/L in Sarai (mean: 3.7Bq/L), and 2.5 to 80 Bq/L in Maytham Al-Tammar (mean: 5.3Bq/L). All of the radon levels in this study were below the 11 Bq/L standard established by the Environmental Protection Agency (EPA). This suggests tap water in the area sampled could be safe for people. ε13C-CH4 distribution varied substantially by location. Those affected by surface water were lower than those affected by groundwater. The study found that the amount of radon in drinking water is controlled by geological and environmental elements that operate like master control systems. Although the concentrations of this toxic chemical in the water are not yet beyond the threshold where officials believe it represents a major health danger, more monitoring is needed to protect against long-term water quality issues. This work highlights the integration of the spatial analysis and environmental tracking as a source of valuable information for water management and public health.
Summary
Source-checkedPlain-language reading of the full paper, prepared with AI and checked against the text. Each point links to the authors' own words.
Why it matters
- Radon is a naturally occurring radioactive gas that can contaminate drinking water systems and be inhaled by humans. View evidence ↗
- According to the World Health Organization, radon is the second leading cause of lung cancer, following cigarette smoking. View evidence ↗
- The concentration of radon in tap water is primarily influenced by geological and hydrological factors, including soil permeability and the uranium content of nearby rocks. View evidence ↗
The question
- The study aimed to conduct a detailed geographical investigation of radon gas concentrations in the tap water of selected neighborhoods in Kufa city up to October 2023. View evidence ↗
What they did
- The researchers collected a total of 126 water samples from three locations: Misan (90 samples), Sarai (16 samples), and Maytham Al-Tammar (20 samples). View evidence ↗
- Samples were collected in airtight glass bottles (250 to 500 mL), filled gently to prevent degassing. View evidence ↗
- Radon concentrations were measured using a RAD7 electronic radon detector employing a closed-loop aeration method. View evidence ↗
- Results were reported in Becquerels per liter (Bq/L) and compared against the standards set by the U.S. Environmental Protection Agency (EPA). View evidence ↗
What they found
- All measured radon levels in the study were below the EPA safety standard of 11 Bq/L. View evidence ↗
- In the Misan neighborhood, radon levels ranged from 2.1 to 7.8 Bq/L, with a mean concentration of 4.9 Bq/L. View evidence ↗
- The Sarai district showed the lowest levels, ranging from 1.8 to 6.2 Bq/L with a mean of 3.7 Bq/L. View evidence ↗
- In Maytham Al-Tammar, radon levels ranged from 2.5 to 80 Bq/L, with a mean of 5.3 Bq/L. View evidence ↗
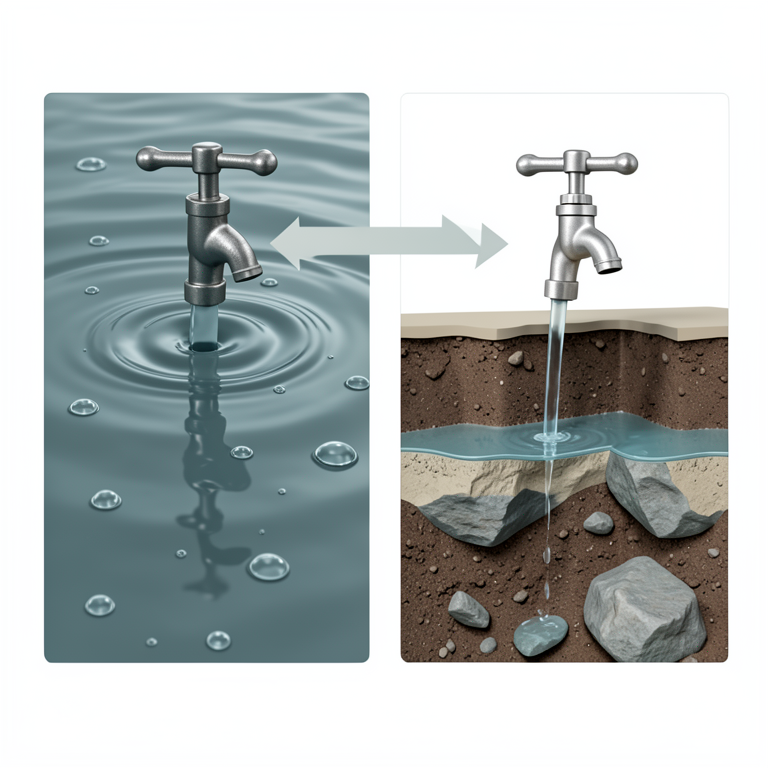
- The lower radon levels in Sarai are attributed to the influence of surface water from the Euphrates River, which facilitates aeration and dispersion. View evidence ↗
- Higher average radon levels in Maytham Al-Tammar are linked to the use of groundwater sources and differences in soil permeability. View evidence ↗
What it means
- The authors conclude that the drinking water in the sampled regions of Kufa city is safe for household use as it is not polluted with radon beyond safety limits. View evidence ↗
- The authors recommend constant monitoring of radon levels, particularly in areas relying on groundwater, since radon was detected in all samples. View evidence ↗
- The authors state that further monitoring is required to protect against potential long-term water quality issues. View evidence ↗
Visual summary
1 visualsIllustrations explain the paper; they do not show study data.
Influence of Water Source on Radon
AI-generated conceptual illustration (Groundwater and surface water sources in Kufa city). It explains the idea and does not show study data.
View source evidence ↗Figures & tables
From the original paper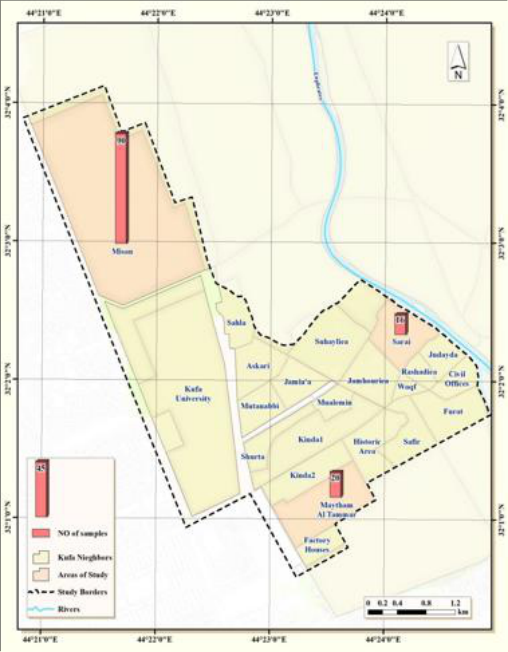 Figure 1
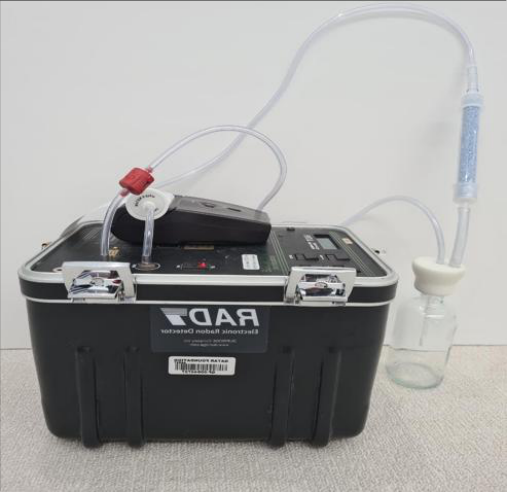 Figure 2
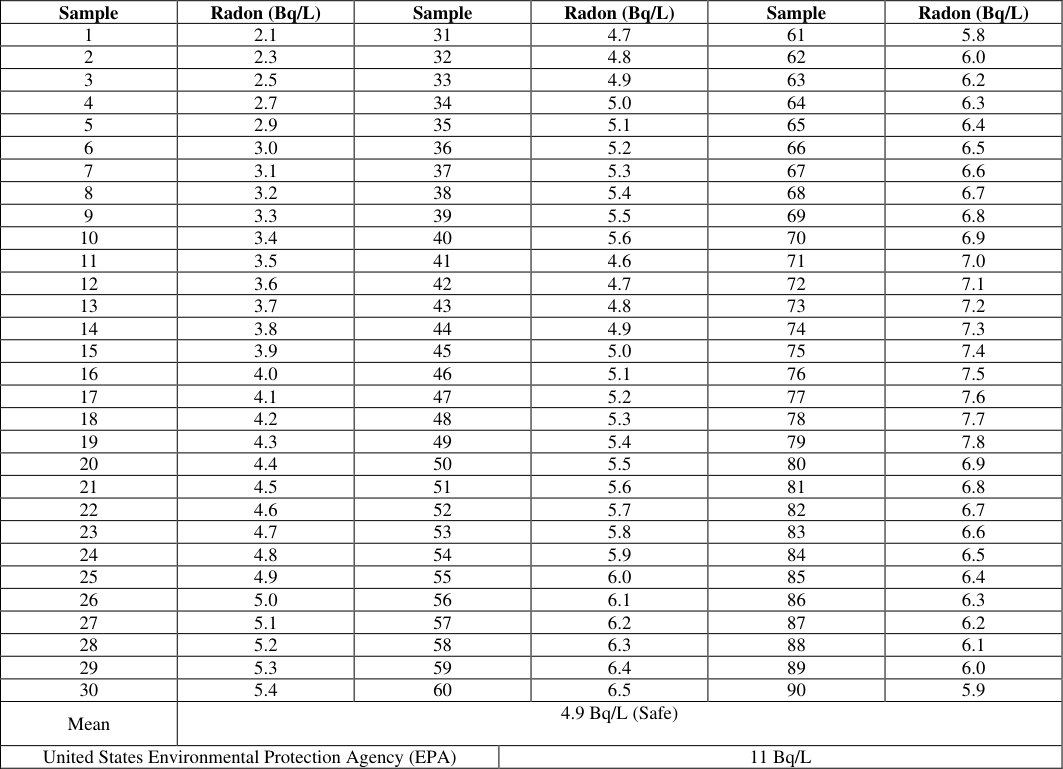 Table 1
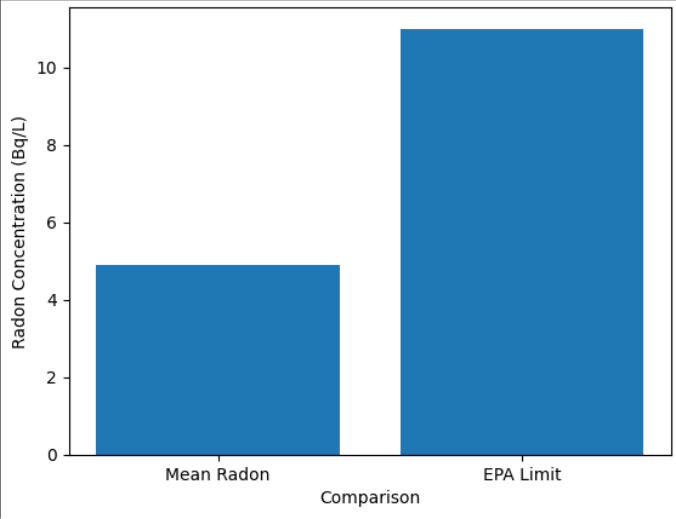 Figure 3
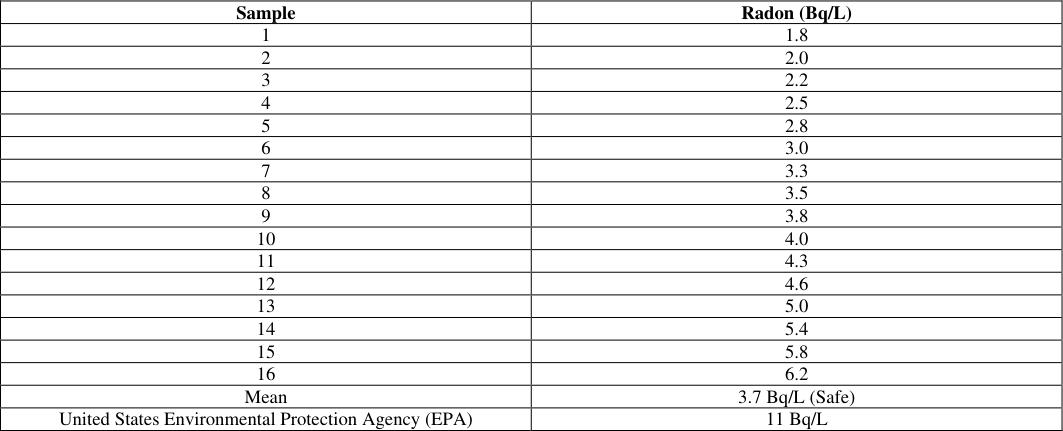 Table 2
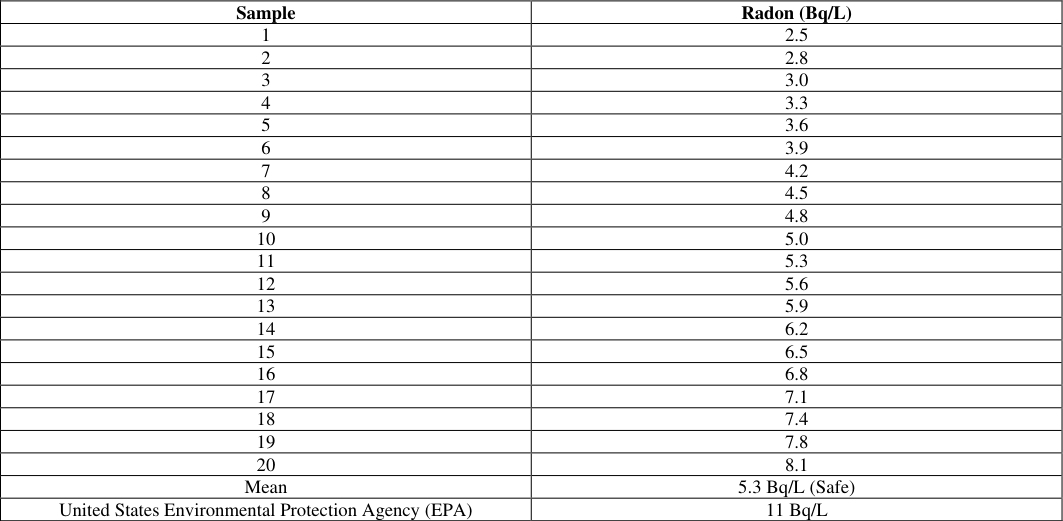 Table 3
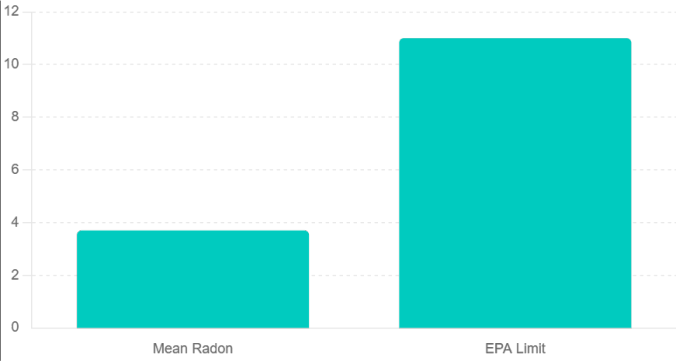 Figure 4
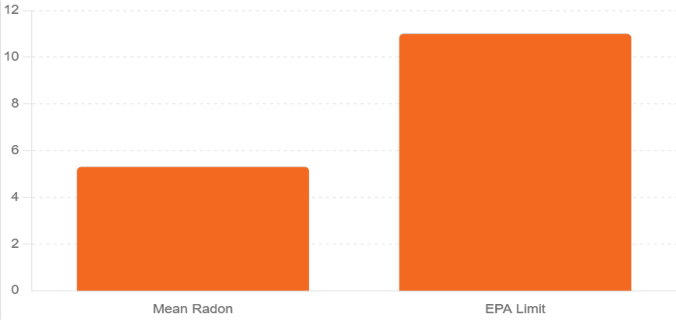 Figure 5
Introduction
Radon gas is a naturally occurring radioactive noble gas that results from the decay of uranium and radium in soil, rocks and geological formations at varying concentrations. Radon is colourless, odourless and tasteless gas that is chemically inert, making it extremely difficult to detect without specialized instrumentation, which leads to an increased risk for unnoticed human exposure [1] . Though radon is more relevant in terms of indoor air contamination, the presence of radon in groundwater and drinking water supplies has garnered growing attention since it can effectively increase the total lifetime radiation exposure through both ingestion into contaminated food products as well as inhalation pathways [2] . Radon in groundwater may enter domestic water systems and be released to indoor air during household activities involving the use of water (e.g. showering, cooking or washing). Using this twin exposure mechanism, an increased risk to health is created since decay products of radon energies that are emitted in the form of alpha particles can destroy biological tissues over long periods due to inhalation and ingestion [3] . Radon levels in tap water depend mainly on the following geological-hydrological factors: the uranium content of surrounding rocks, soil permeabilities and groundwater flow dynamics (or sedimentary settings), as well as depths and origin of wells [4] . Radon distribution parameters depend on where they are located, therefore spatial analysis is a unique high impact environmental assessment." Usually the geology of a city like Kufa is complex. Natural and man-made states together produce different amounts of radon from quarter to quarter. There may also be some locational elements. For example, the kind of water supply system (i.e. surface or groundwater source), as well as the age and condition of individual pipes in distribution Networks are all potential aggravators of differences in radon levels [5] . Radon is the second greatest cause of lung cancer after cigarette smoking according to the World Health Organization. It is also known to carry health risks. There was also some weak but plausible evidence of an association between inhalation of radon-contaminated water and deaths from malignancies of the digestive system and other internal organs [6] . the quality of radon monitoring in drinking water is therefore part of environmental health protection and risk management. International organisations, such as the World Health Organization (WHO) and the US Environmental Protection Agency (EPA), have created guideline values or suggested limits for radon in water to reduce exposure through drinking water [3][4][5][6] . these guidelines highlight the necessity for periodic observation, release of cognizance concerning radon exposure risks and mitigation actions in districts having high recommended radon levels. [7] . This study aims to provide a detailed geographical investigation of radon gas concentration in tap water of selected districts/neighborhoods in Kufa city during the period up to October 2023. This study aims to develop high-risk areas for water quality management in order to provide a scientific basis for better protection of public health by mapping spatial variation and analyzing its relationship with the impacts from environmental and geological factors.
Study area
Study area this sub-area covers a group of selected neighborhoods distributed on built-up area in Kufa city, Al-Najaf Governorate, Iraq. In terms of area, it is extended from 44°21′00″ to 44°24′00″ E longitude and from 32′01 to 32′04 N latitude (Fig. The area covered by the study is shown on the map, where it includes mainly different types of residential and institutional districts such as Misan, Sarai areas, Maytham Al-Tammar district and other areas surrounding Kufa University too. The Euphrates River is a natural and major topographic division on the eastern side of the study area and affects both hydrological conditions and groundwater properties. The chosen areas differ in land-use, population density, and the distance to a respective water source all important factors influencing levels of radon in tap water. Misan, which has the largest number of samples collected (>90) along with high sampling density in any given area indicates it is a spatially wide (larger than other portions) or environmentally significant portion of the study area. In the eastern sector, Sarai similarly had 16 samples, while Maytham Al-Tammar in the southern part of Iraq recorded twenty samples.
Practical work, sample collection, and radon measurement
The practical element was determined in line to standard environmental sampling and radiometric measurement protocols, guaranteeing accurate reproducible scientific results. Field sampling, sample preservation and transport, and measurement of samples in laboratory using the RAD7 radon detector. Water samples were obtained from domestic taps in Kufa city, the selected neighborhoods were restricted to tap sources which produced high concentration according to previous studies; the radon loss during sample collection was kept as minimum as possible. Bottle-type containers of 250 to 500 mL in volume were used with glass airtight seals, allowing the sample to fill gently perfusing along the inner wall of the bottle to avoid turbulence and thus degassing. The bottles were filled to the top so as not to leave any headspace (headspace can lead to escapes of radon, thus underestimating concentrations). The bottles were sealed, labelled with sampling metadata (location, date, and time), and kept cool and dark whilst being transported to the laboratory immediately after collection. Because the half-life of radon is 3.8 days, all samples were analyzed quickly to minimize decay-related losses (Table 1). Measurement of radon The RAD7 electronic radon detector (Durridge Co.) was used, by closed-loop aeration method for the measurement of water. This method involves placing the water sample inside a sealed vial with its inlet and outlet of the vial connected to the RAD7 in a closed loop air system. Finally equilibrium is reached in the concentrations of each phase and a built-in pump is used to circulate air through the sample and hence the mass transfer of dissolved radon from water to air. This radon enriched air is then fed into the detecting chamber. The RAD7, a solidstate alpha spectrometry device, detects highly charged alpha particles (from radon progeny but mainly polonium-218 and polonium-214) emitted by the decaying chain of radioactive elements through silicon semiconductor detectors. This allows the system to detect alpha energies separately, making it possible to measure radon concentration without interference. Before measurement, the instrument was purged with dry air to remove radon and humidity that remain trapped in the pores, as moisture severely reduces detection efficiency. In the present study, a desiccant drying unit was employed to keep relative humidity below lower limits recommended (generally <10%). For increased statistical accuracy, samples were measured over several counting cycles using a frequent and periodic measurement of background results to account for relatively lower ambient radon gas concentrations. So, the final unit concentration of radon is expressed in Bq/L for water samples and was calculated automatically by RAD7 software depending on calibration factors and equilibrium conditions. This methodological framework confirms the accuracy and reliability of acquired data so that spatial analyses on radon distribution followed by comparisons with global guideline limits can be conducted. [8,11]
| Sample | Radon (Bq/L) | Sample | — | Radon (Bq/L) | Sample | Radon (Bq/L) |
|---|---|---|---|---|---|---|
| 1 | 2.1 | 31 | 4.7 | 61 | 5.8 | |
| 2 | 2.3 | 32 | 4.8 | 62 | 6.0 | |
| 3 | 2.5 | 33 | 4.9 | 63 | 6.2 | |
| 4 | 2.7 | 34 | 5.0 | 64 | 6.3 | |
| 5 | 2.9 | 35 | 5.1 | 65 | 6.4 | |
| 6 | 3.0 | 36 | 5.2 | 66 | 6.5 | |
| 7 | 3.1 | 37 | 5.3 | 67 | 6.6 | |
| 8 | 3.2 | 38 | 5.4 | 68 | 6.7 | |
| 9 | 3.3 | 39 | 5.5 | 69 | 6.8 | |
| 10 | 3.4 | 40 | 5.6 | 70 | 6.9 | |
| 11 | 3.5 | 41 | 4.6 | 71 | 7.0 | |
| 12 | 3.6 | 42 | 4.7 | 72 | 7.1 | |
| 13 | 3.7 | 43 | 4.8 | 73 | 7.2 | |
| 14 | 3.8 | 44 | 4.9 | 74 | 7.3 | |
| 15 | 3.9 | 45 | 5.0 | 75 | 7.4 | |
| 16 | 4.0 | 46 | 5.1 | 76 | 7.5 | |
| 17 | 4.1 | 47 | 5.2 | 77 | 7.6 | |
| 18 | 4.2 | 48 | 5.3 | 78 | 7.7 | |
| 19 | 4.3 | 49 | 5.4 | 79 | 7.8 | |
| 20 | 4.4 | 50 | 5.5 | 80 | 6.9 | |
| 21 | 4.5 | 51 | 5.6 | 81 | 6.8 | |
| 22 | 4.6 | 52 | 5.7 | 82 | 6.7 | |
| 23 | 4.7 | 53 | 5.8 | 83 | 6.6 | |
| 24 | 4.8 | 54 | 5.9 | 84 | 6.5 | |
| 25 | 4.9 | 55 | 6.0 | 85 | 6.4 | |
| 26 | 5.0 | 56 | 6.1 | 86 | 6.3 | |
| 27 | 5.1 | 57 | 6.2 | 87 | 6.2 | |
| 28 | 5.2 | 58 | 6.3 | 88 | 6.1 | |
| 29 | 5.3 | 59 | 6.4 | 89 | 6.0 | |
| 30 | 5.4 | 60 | 6.5 | 90 | 5.9 | |
| Mean | 4.9 Bq/L (Safe) | |||||
| United States Environmental Protection Agency (EPA) | 11 Bq/L |
Table text extracted from the original PDF; superscript letters are shown inline. The original table image is below.
View original table image
Results and discussion
Measurement of radon concentration in tap water samples, collected from selected neighborhoods of Kufa city revealed that all values are lower than the cut-off index determined by USA Environmental Protection Agency at approximately 11 Bq/L. Radon concentration in the neighborhood called Misan (where the maximum number of samples 90 houses were located), ranged between 2.1 ÷ 7.8 Bq/L, with an average value of about 4.9 Bq/L, which can be higher than those found in other neighborhoods because of subsurface geological conditions conditioned by soil type and uranium content, as well as groundwater properties. Groundwater and minerals continue to be linked during the same time period. Groundwater that is in contact with the minerals for a long time without being aerated is more likely to have a lot of radon because the mineral grains are always giving off radioactive decay. Moreover, the Sarai neighborhood is considered the lowest radon level, with radon levels of 1.8-6.2 Bq/L, average of 3.7 Bq/L. This is attributed to the effect of the surface water of the Euphrates River on the radon concentrations despite the proximity of the area to the river. The water movement facilitates aeration and dispersion processes and thereby reduces levels of radon. These results agree with prior studies that have reported reduced radon levels in watersheds where surface water as opposed to ground water is the main source of water. Maytham Al-Tammar's study likewise showed higher average radon levels than ours. Levels varied from 2.5 to 8.1 Bq/L with a highest mean of 5.3 Bq/L for all the regions investigated. This increases the importance of groundwater sources, which contribute less to surface water bodies. This can interfere with the flow and circulation of water in these systems which can enhance migration of radon. These highs are explained by the difference material composition and permeability of the soil. But regional geological heterogeneity is not the only instrument. The plots show exceptionally strong evidence that the average amount of radon found in each neighborhood is significantly lower than the EPA's threshold, giving consumers a vast safety window. But radon levels can vary widely from place to place, indicating the importance of geological conditions for radon transportation. Geology, drainages, kind of water source, amenities, all go into it. In the end, the study of radon-water proved that the quality of water is fine for people, but the level of radon was high in all the samples studied, which means that tracking needs to be standardized. By integrating geographic study with environmental assessment we can extend our understanding of radon and how to protect public health and water quality [12,15] .
Conclusion
The current work aims to investigate the variation of radon gas concentrations in tap water in different locations of Kufa city and compare it with worldwide safety requirements.
The results indicate that the level of radon in all the samples taken is less than the limit permitted by the US Environmental Protection Agency. This signifies that the drinking water in the study region is safe for household use and is not polluted with radon.Overall the neighborhoods analyzed were safe however the safety of each neighborhood was distinctly different. Sarai had lower levels because of surface water from the Euphrates River, but Misan and Maytham Al-Tammar had higher levels because of geological and groundwater-related causes. The differences indicate the importance of environmental factors such as soil type, water supply and hydrological aspects for the control of radon concentrations in water.The study shows that the RAD7 detector is suitable for accurate radon readings and emphasizes the importance of combining field sampling and geographical analysis in environmental trend interpretation. Although the detected amounts of radon are not immediately detrimental to health, the fact that quantities can be identified in all samples suggests that they should be constantly examined, especially in places where ground water is used.
Figures and tables from the paper
| Sample | Radon (Bq/L) |
|---|---|
| 1 | 1.8 |
| 2 | 2.0 |
| 3 | 2.2 |
| 4 | 2.5 |
| 5 | 2.8 |
| 6 | 3.0 |
| 7 | 3.3 |
| 8 | 3.5 |
| 9 | 3.8 |
| 10 | 4.0 |
| 11 | 4.3 |
| 12 | 4.6 |
| 13 | 5.0 |
| 14 | 5.4 |
| 15 | 5.8 |
| 16 | 6.2 |
| Mean | 3.7 Bq/L (Safe) |
| United States Environmental Protection Agency (EPA) | 11 Bq/L |
Table text extracted from the original PDF; superscript letters are shown inline. The original table image is below.
View original table image
| Sample | Radon (Bq/L) |
|---|---|
| 1 | 2.5 |
| 2 | 2.8 |
| 3 | 3.0 |
| 4 | 3.3 |
| 5 | 3.6 |
| 6 | 3.9 |
| 7 | 4.2 |
| 8 | 4.5 |
| 9 | 4.8 |
| 10 | 5.0 |
| 11 | 5.3 |
| 12 | 5.6 |
| 13 | 5.9 |
| 14 | 6.2 |
| 15 | 6.5 |
| 16 | 6.8 |
| 17 | 7.1 |
| 18 | 7.4 |
| 19 | 7.8 |
| 20 | 8.1 |
| Mean | 5.3 Bq/L (Safe) |
| United States Environmental Protection Agency (EPA) | 11 Bq/L |
Table text extracted from the original PDF; superscript letters are shown inline. The original table image is below.
View original table image
References
15 in the original paper- World Health Organization. Guidelines for drinkingwater quality. 4th ed. Geneva: WHO; 2017.
- World Health Organization. WHO handbook on indoor radon: a public health perspective. Geneva: WHO; 2009.
- United States Environmental Protection Agency. National primary drinking water regulations: Radon222 proposed rule. Federal Register. 1999;64:5924659294. Washington, DC: EPA.
- United States Environmental Protection Agency. A citizen's guide to radon: the guide to protecting yourself and your family from radon. Washington, DC: EPA; 2012.
- National Research Council. Risk assessment of radon in drinking water. Washington, DC: National Academy Press; 1999.
- United Nations Scientific Committee on the Effects of Atomic Radiation. Sources and effects of ionizing radiation. New York: United Nations; 2000.
- Durridge Company Inc. RAD7 radon detector user manual. Bedford (MA): Durridge Company Inc.; 2017.
- Hopke PK. Radon and its decay products in indoor air. Environmental Science & Technology. 2000;34(6):921926.
- Kendall GM, Smith TJ. Doses to organs and tissues from radon and its decay products. Journal of Radiological Protection. 2002;22(4):389-406.
- Przylibski TA. Estimating radon concentration in groundwater and related risk. Journal of Environmental Radioactivity. 2000;48(3):325-334.
- Vesterbacka P, Mäkeläinen I, Arvela H, Huikuri P. Radon in drinking water in Finland. Radiation Protection Dosimetry. 2005;113(2):223-232.
- Jobbágy V, Somlai J, Kovács T, Szeiler G. Radiological risk assessment of radon in drinking water. Journal of Environmental Radioactivity. 2017;173:18-23.
- Somlai J, Jobbágy V, Kovács T, Várhegyi A. Measurement of radon concentration in water samples. Radiation Measurements. 2007;42(3):491-495.
- Somashekar RK, Ravikumar P, Prakash KL. Radon concentration in groundwater and its risk assessment. Environmental Monitoring and Assessment. 2011;177(1-4):523-531.
- Almayahi BA, Tajuddin AA, Jaafar MS. Measurements of radon concentration in water and associated health risks. Journal of Radiation Research and Applied Sciences. 2012;5(2):157-164.