
Research article · 2026 · Full text
International Journal of Agriculture and NutritionFuzzy logic technology via inverse-distance method to predict the temporal variability of soil degradation in District Saddha Al-Hindia, Iraq
Volume 8(5) · Pages 01–06 · DOI: 10.33545/26646064.2026.v8.i5a.634 ↗
Research areasSoil erosion and sediment transportSoil and Land Suitability AnalysisSoil Geostatistics and Mapping
Abstract
Author-writtenThe present research work aimed to employ a fuzzy logic model as a developed tool that represents the integration between remote sensing and geographic information systems to assess the prevailing status of land use and land cover in District Saddha Al-Hindia, Babil, Iraq. The results revealed that there are five types of land degradation in the study area including i) area without deterioration comprising 69.4% (195 Km2) of the area, ii) area with mild deterioration comprising 11.9% (32.6 Km2) of the area, iii) area with medium deterioration comprising 6.11% (17.2 Km2) area, iv) area with severe deterioration comprising 8.6% (24.2 Km2) area, and v) very severely deteriorated area comprising 4.3% (12.2 Km2) of the area studied. Based on overall study results, it was concluded that the area studied is dominated by the non-deterioration category followed by the mild deterioration category. The largest percentage of the study area is sited within three irrigated reclamation sites.
Summary
Source-checkedPlain-language reading of the full paper, prepared with AI and checked against the text. Each point links to the authors' own words.
Why it matters
- Fuzzy logic is a control system used to derive clear conclusions from vague or imprecise problems. View evidence ↗
- This technology is particularly useful for making fast and effective decisions when dealing with huge or incomplete datasets. View evidence ↗
- Fuzzy logic addresses the inaccuracies in descriptive values that often limit traditional applications. View evidence ↗
The question
- The study aimed to forecast the temporal variability of soil degradation and land cover classes in the Saddha Al-Hindia District of Babil, Iraq, using a fuzzy logic technology and an Inverse Distance Weighted (IDW) model. View evidence ↗
What they did
- The research was conducted in a study area totaling 388 square kilometers. View evidence ↗
- The assessment focused on four specific soil characteristics: salinity, calcium carbonate, organic matter, and the percentage of exchangeable sodium. View evidence ↗
- The Inverse Distance Weighting (IDW) method was employed to create soil characteristic maps, as it is suitable for regular changes in characteristics on flat lands. View evidence ↗
- A Map Algebra geoprocessing technique within a GIS environment was used to calculate a disturbance index based on weighted soil characteristics. View evidence ↗
What they found
- The largest portion of the study area, 69.4% (195 square kilometers), was categorized as having no deterioration (D0). View evidence ↗
- Mild deterioration (D1) affected 11.9% of the area, covering 32.6 square kilometers. View evidence ↗
- Medium deterioration (D2) was found in 6.11% of the area, totaling 17.2 square kilometers. View evidence ↗
- Severe deterioration (D3) occupied 8.6% of the study area, which is 24.2 square kilometers. View evidence ↗
- Very severe deterioration (D4) was the least common, covering 4.3% of the area or 12.2 square kilometers. View evidence ↗
- Reclamation projects in the Hilla-Kifl area helped maintain water depths above 200 cm, reducing salinization and contributing to the prevalence of non-deteriorated soil. View evidence ↗
- Severe and very severe deterioration (8.6% and 4.3%) occurred in the Alexandria Mahaweel project due to poor drainage, lack of vegetation, and high evaporation. View evidence ↗
What it means
- The authors concluded that the irrigated reclamation sites in the study area are primarily dominated by non-degradation and light degradation categories. View evidence ↗
- To prevent high salinity levels, the authors recommend continuous agricultural rotation and the cultivation of vegetables under palm groves. View evidence ↗
Visual summary
3 visualsIllustrations explain the paper; charts are replotted from the paper's own table values.
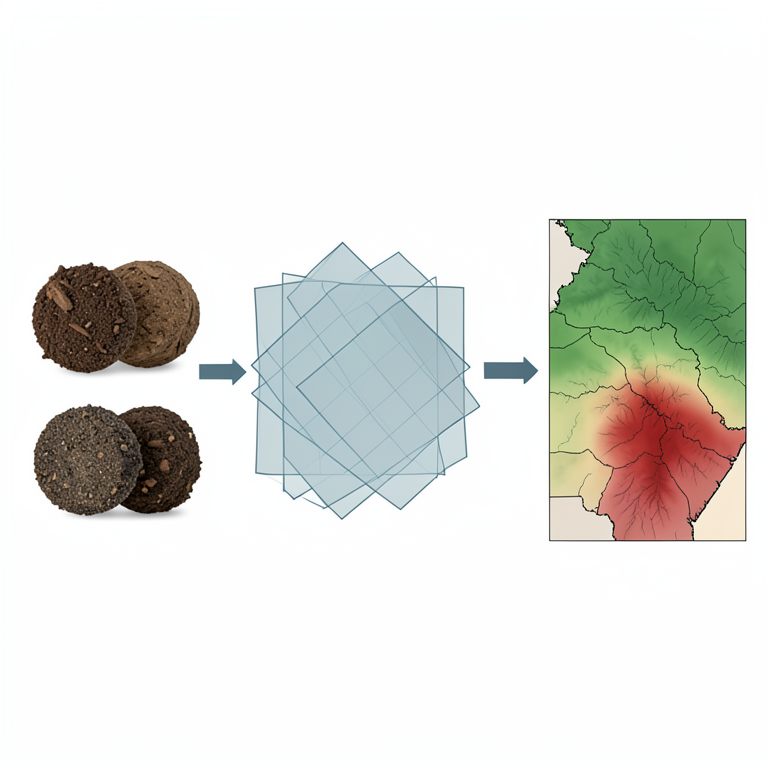
Fuzzy Logic Soil Assessment Workflow
AI-generated conceptual illustration (Soil profiles and geographic maps of the Saddha Al-Hindia District, Iraq). It explains the idea and does not show study data.
View source evidence ↗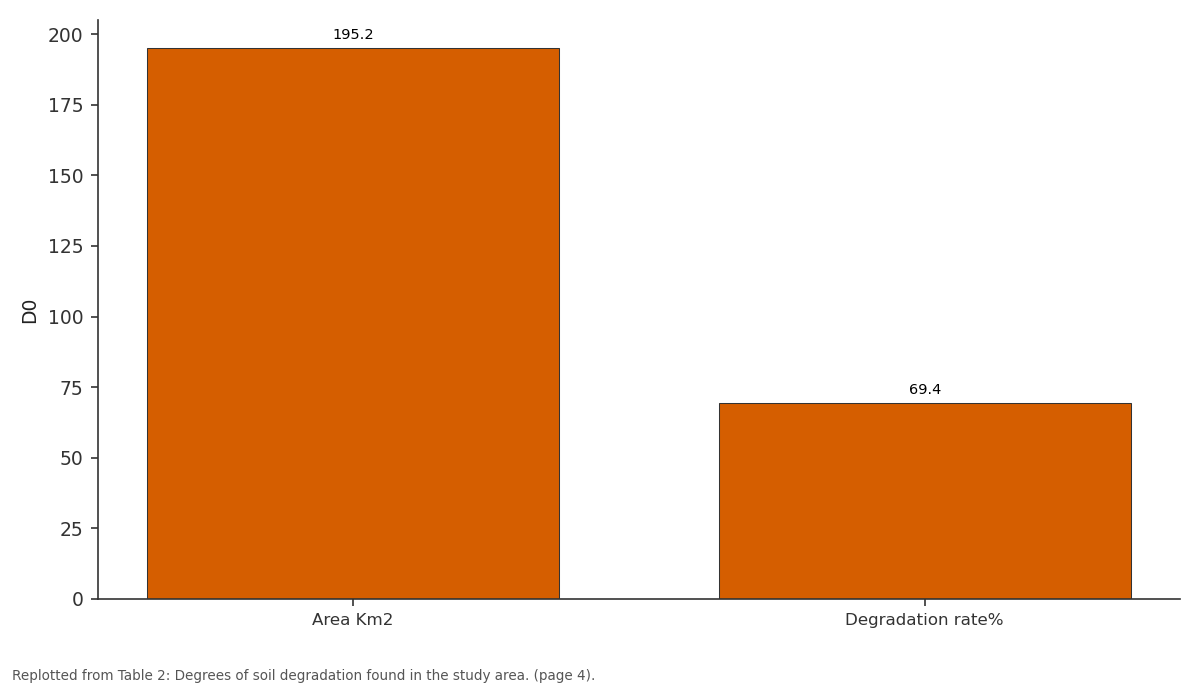
D0: Area Km2 vs Degradation rate%
Replotted from Table 2 (page 4) of the original paper. Every bar is the paper's own table value.
View source evidence ↗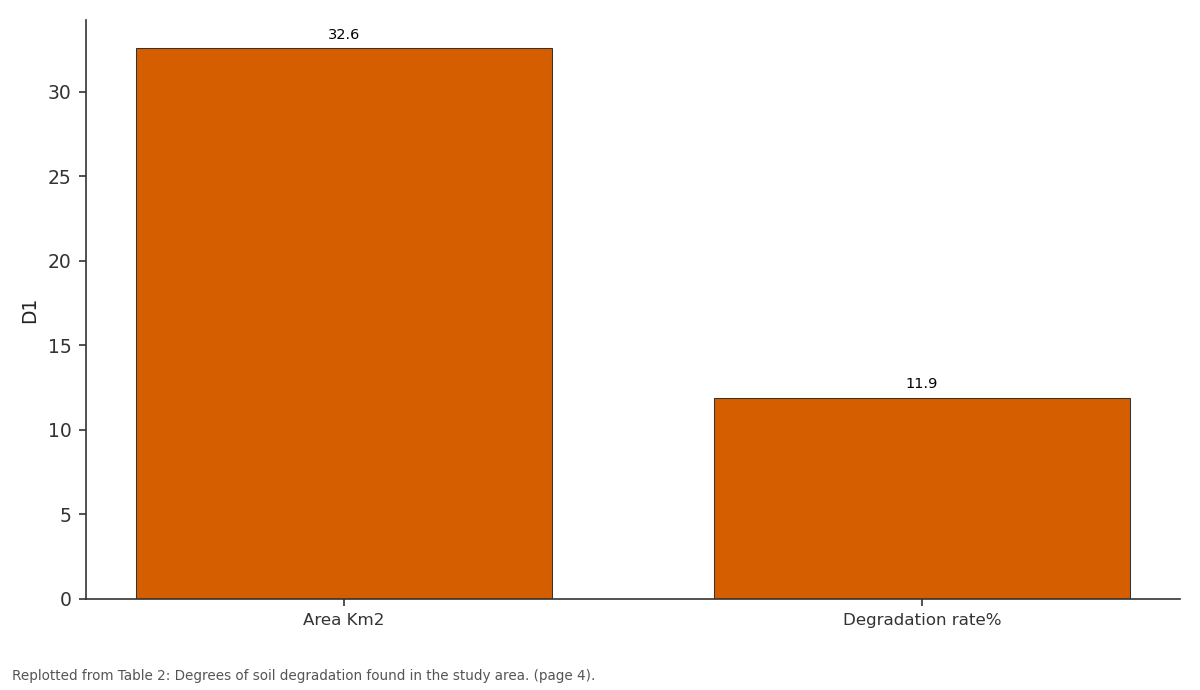
D1: Area Km2 vs Degradation rate%
Replotted from Table 2 (page 4) of the original paper. Every bar is the paper's own table value.
View source evidence ↗Figures & tables
From the original paper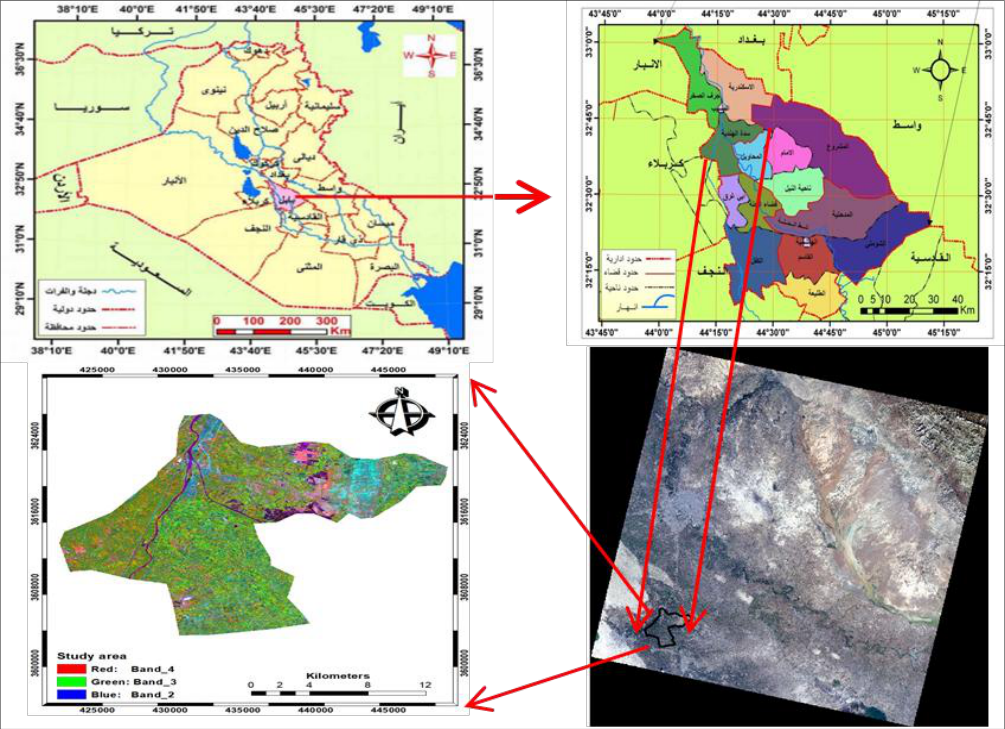 Figure 1
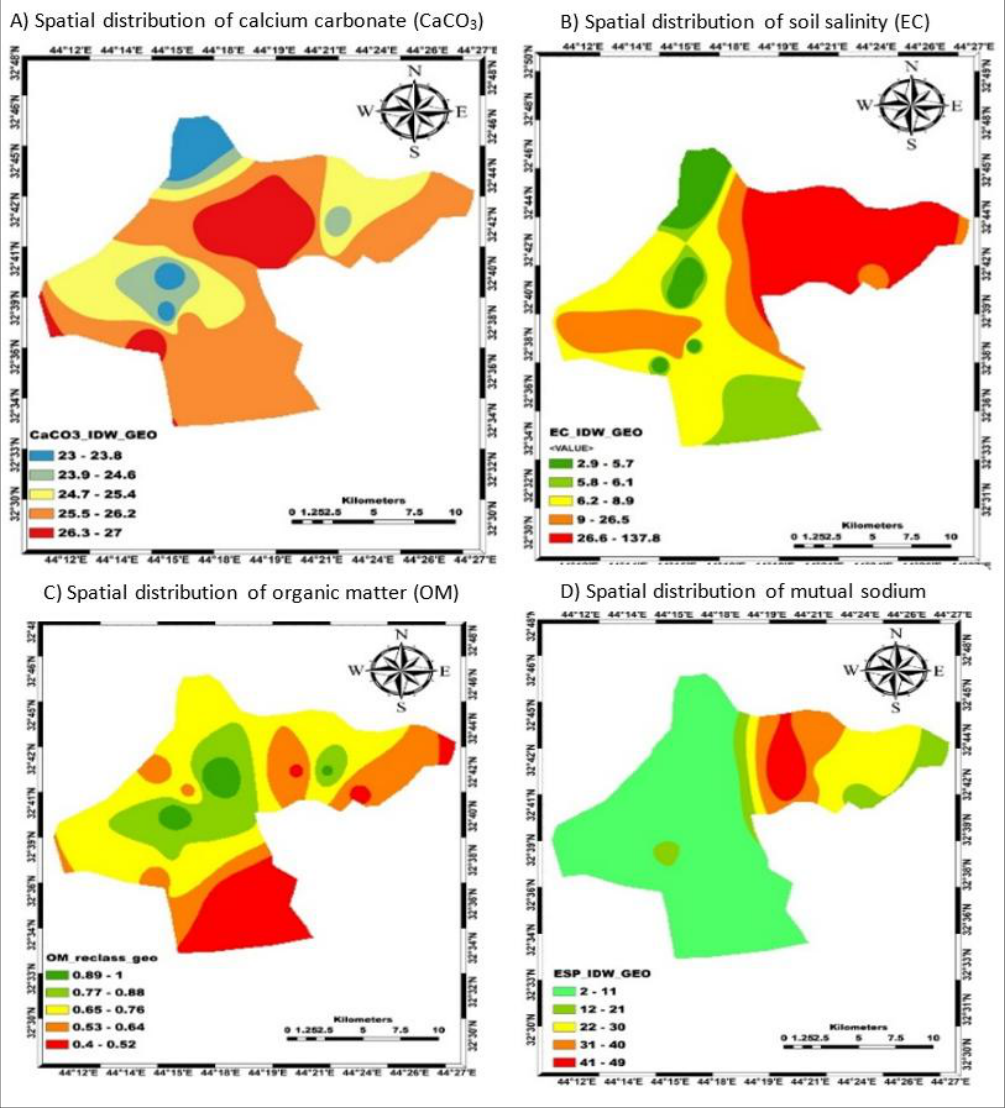 Figure 2
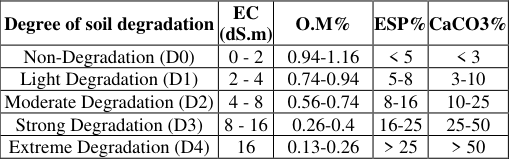 Table 1
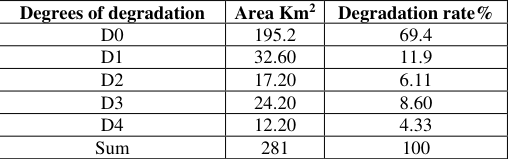 Table 2
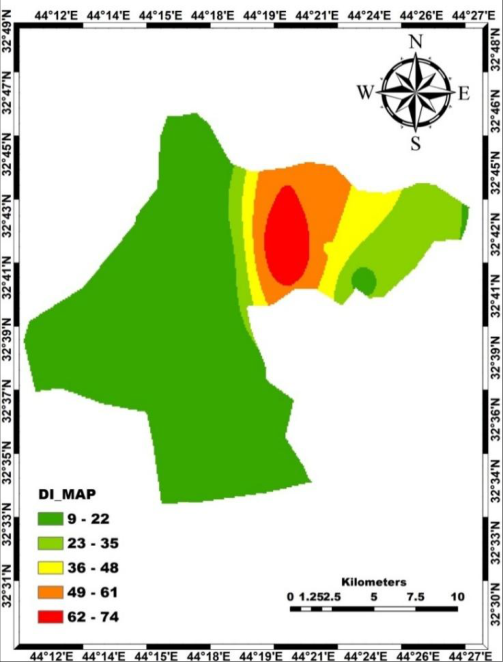 Figure 3
Introduction
The concept of fuzzy logic or ambiguous logic is the logic that is applied with artificial intelligence applications in different expert systems which are being deployed to process data in a better way. Fuzzy logic applications primarilty based on a fuzzy logic chip, that has is being utilized in various sectors like in photography (De Campos, 2020; Omran et al., 2025) [11, 23] . It has been indicated that there is a kind of close relationship between the phrase logicalism that has been characterized since the inception of the science of logic with strictness and strength confusion and ambiguity (Patyra and Mlynek, 2012; Peckol, 2021) [23,25] . Fuzzy logic is a control system for solving systematic problems, where it provides a way to reach a clear conclusion based on a vague problem, and imprecise meaning. When the information is huge or incomplete, it is possible through the use of fuzzy logic also takes control of new problems and make snap decisions faster and more effectively (Bezdek, 2013; Verma et al., 2023) [10,29] . Various motives directed the researchers improve the fuzzy logic work. Along with the advancement of computer-based softwares and logistics, the humans' intention intensified to develop such programs or to invent such systems which can handle imprecise information. However, it was a challenging demand as the computers could interpret and process the accurate dataset only. This situation resulted in the creation of some expert systems, also known as artificial intelligence, and fuzzy logic is a many-valued logic theory by which these expert systems are desgined (Mamdani, 1981; Maria et al., 2021) [19,20] . It is a technique for defining complex models with simple and understandable fuzzy variables and rules that take care of the imprecision of the event or concept itself. Objectives of the current study provides a mathematically accurate method for dealing with uncertainty in experience systems that handle real-time data. Sobriety and ignoring the minor failure of the traditional systems of experience, as they use one rule and this rule applied, impresses the outcome.
According to Aghadadashi et al. (2019) [3] , fuzzy logic is an important for transforming fragile aggregates into fuzzy aggregates and mathematics simplifies and accurately explains operations. It is a renewed way of thinking to address cases of ambiguity and inaccuracy that exist in our daily lives. Fuzzy logic is used in GIS analysis, so it uses binary models, and the degree of affiliation of each value of the data aggregates corresponding to the criteria that was specified to reach them is determined, it takes a value between (0-1) where zero indicates the inability to belong to the group, while the value of 1 indicates the actual belonging to the group. Therefore, the fuzzy logic came to solve the problems resulting from traditional applications and solve the problem of inaccuracy in descriptive values, as the fuzzy logic prepares a technology to solve all kinds of inaccuracies (Dubey et al., 2013) [12] . According to Khavarian-Garmsir and Rezaei (2015) [16] , Puente et al. (2019) [26] and Hembram and Saha (2025) [14] , fuzzy logic and geographic information systems can be used in various applications, particularly in selecting ideal locations for pedestrians and urban planning. Some previous studies such as Al-Sulaiman et al. (2014) [9] and Abidi et al. (2024) [1] concluded that fuzzy logic could predict the presence of high concentrations of salts in irrigation water samples to find the concentration of each of the following elements (iron, magnesium, and calcium). It has proven that the technology of fuzzy logic is used in uncertain and fuzzy information by setting laws and relationships by the researcher, as well as by producing accurate results that are close to the values that were predicted utilizing multiple linear regression (Hembram and Saha, 2025) [14] . This study aimed to use artificial intelligence with fuzzy logic technology via Inverse Distance Weighted (IDW) model for forecasting the temporal variability of appearances and land cover class of soil degradation in Saddha Al-Hindia District, Babil, Iraq.
Materials and Methods
This research work was based on some sort of spatiotemporal analyses of a phenomenon outlining its path from a temporal perspective and engisaging who this phenomenon reached to its prevailing state (Al Othman, 2009) [8] . Quantitative approach based on the utilization of statistical systems and models is used in this work which depends on the analysis and measurement, and use of numerical values to attain specific and accurate research objectives (Yahia et al., 2006) [30] . This is done by fabrication of spatio-temporal data in some numerical or descriptive or tabular way, and by predicting the operations according on the basis of different statistical models.
Area of study
Area of study
Methodology
Methodology
IDW based spatial interpolation in cartography
The inverse-distance weighting (IDW) method is used when the change of characteristics is regular, especially in flat lands, This method was used to produce maps of soil characteristics included in the land degradation assessment equation, and maps are usually produced in ten ranges, starting from the low values to the high values of the characteristic after it, and then reclassifying them as shown in Figure 2 (A,B,C,D), and Table 1. For each of the four soil characteristics which are salinity, calcium carbonate, organic matter and the percentage of exchangable sodium. For the conduction of land cover prediction process, remote sensing programs and geographical information systems were implemented for the technical integration of data because these systems or programs support each other rather than nullifying each other. The geographic information system (GIS) was utilized in the initialization and conversion of data into different digital file formats.
| Degree of soil degradation | EC (dS.m) | O.M% | ESP% | CaCO3% |
|---|---|---|---|---|
| Non-Degradation (D0) | 0 - 2 | 0.94-1.16 | < 5 | < 3 |
| Light Degradation (D1) | 2 - 4 | 0.74-0.94 | 5-8 | 3-10 |
| Moderate Degradation (D2) | 4 - 8 | 0.56-0.74 | 8-16 | 10-25 |
| Strong Degradation (D3) | 8 - 16 | 0.26-0.4 | 16-25 | 25-50 |
| Extreme Degradation (D4) | 16 | 0.13-0.26 | > 25 | > 50 |
Table text extracted from the original PDF; superscript letters are shown inline. The original table image is below.
View original table image
Production of the final map
Geoprocessing technique of Map Algebra was used in the GIS environment to apply the equation (Abuzaid et al., 2022) [2] after reclassifying the map of the soil characteristics included in the equation below, depending on the weights given for each soil characteristic.
Results and Discussion
The image-based disturbance index (DI) based map created on the basis of study results, as shown in Figure 3 and Table 2, indicates that there are five types of land degradation in the study area, represented by the following types: The first category (without deterioration) and was symbolized by "D 0 ", where it reached 69.4% of the total studied land with an area of 195 Km 2 , and the second category (mild deterioration) was symbolized by "D1") and reached a rate of 11.9% of the area, as it occupied an area of 32.6 Km 2 , whereas the third category (medium deterioration), symbolized by "D 2 ", reached a rate of 6.11% and consisting of an area of 17.2 Km 2 , while the fourth category (severe deterioration), is symbolized by "D 3 ", occupied almost 8.6%, of the atudy area that is 24.2 Km 2 . As for the fifth category (very severe deterioration), symbolized by "D 4 ", that is 4.3% of the total study with covering area is 12.2 Km 2 . Accordingly, the study area has the non-deterioration class predominates, followed by the mild deterioration class as a larger percentage compared to the rest of the other degrees of deterioration. The fact that part of the study area located within the Hilla-Kifl project was subjected to complete reclamation projects, which had an effective role in achieving a salt-water balance and maintaining a water depth of more than 200 cm so that the soil does not reach the critical depth and reduce salinization because of the effectiveness of reclamation operation (Haj-Amor et al., 2017; Nourani et al., 2024) [13,22] , and they are still effective with some exceptions for specific sites where re-salination operations may occur (Alkarawi and Zotz, 2014; Qureshi and Al-Falahi, 2015; Liu et al., 2021) [4,27,6,9,18] . As well as the presence of agricultural rotation and the cultivation of soils with vegetables under the palm orchards helped to prevent the salinity levels from rising, as it was classified under the degree of mathsf S0 to mathsf S1 at specific sites (Zabar et al., 2012 [15,7,31] . Whereas sedimentary soils with good drainage prevail in current study, followed in terms of the common percentage within the study area, the average degrees of degradation is 25.9%. It is located within the Husseiniya Bani Hassan project, adjacent to the old Husseiniya Bani Hassan canal, and as a result of the (seepages) leaching operations from water sources, which led to a rise in ground water levels to 150 cm, which was reflected in the hydrological and humid conditions of the soil of the study area, that led to the supremacy of the moisture regime (aquatic) as for the severe and very severe deterioration that is 8.6% and 4.3%, respectively. It was located within the Alexandria Mahaweel project due to the high evaporation processes, the lack of drainage and the lack of vegetative cover (Nassif et al., 2021) [21] . In addition to the lack of land use, the decrease in the area affected the classification of the soil into saline soils (Al-Ibrahimi and Ghalib, 2018; Li et al., 2024) [5,17] .
| Degrees of degradation | Area Km2 | Degradation rate% |
|---|---|---|
| D0 | 195.2 | 69.4 |
| D1 | 32.60 | 11.9 |
| D2 | 17.20 | 6.11 |
| D3 | 24.20 | 8.60 |
| D4 | 12.20 | 4.33 |
| Sum | 281 | 100 |
Table text extracted from the original PDF; superscript letters are shown inline. The original table image is below.
View original table image
Conclusion
It has been concluded that the study area (irrigated reclamation sites) is dominated by the nondegradation category, followed by the light degradation category, which has the largest percentage compared to the rest of the degrading degrees. Cultivating fields with vegetables under palm groves with continuous agriculture rotation is recommended to prevent the high levels of salinity, as it was classified under the degree mathsf S0 to mathsf S1 (in some sites). Therefore, this part is dominated by well-drained sedimentary soil.
Acknowledgement
International Journal of Agriculture and Nutrition https://www.agriculturejournal.net
Figures and tables from the paper
References
31 in the original paper- Abidi JH, Elzain HE, Sabarathinam C, Selmane T, Selvam S, Farhat B, et al. Evaluation of groundwater quality indices using multi-criteria decision-making techniques and a fuzzy logic model in an irrigated area. Groundwater for Sustainable Development. 2024;25:101122. doi:10.1016/j.gsd.2024.101122.
- Abuzaid AS, Mazrou YS, El Baroudy AA, Ding Z, Shokr MS. Multi-indicator and geospatial based approaches for assessing variation of land quality in arid agroecosystems. Sustainability. 2022;14(10):5840. doi:10.3390/su14105840.
- Aghadadashi V, Molaei S, Mehdinia A, Mohammadi J, Moeinaddini M, Bakhtiari AR. Using GIS, geostatistics and fuzzy logic to study spatial structure of sedimentary total PAHs and potential eco-risks; an Eastern Persian Gulf case study. Marine Pollution Bulletin. 2019;149:110489. doi:10.1016/j.marpolbul.2019.110489.
- Al-Hamad AD, Alnajjar MA, Ibrahim MA. The effect of alternating salinity of irrigation water and cultivation level on some soil properties and growth of date palm (Phoenix dactylifera L.) offshoots of Hillawi cultivar in clay soils. International Journal of Agricultural and Statistical Sciences. 2021;17(1):63-72.
- Al-Ibrahimi YA, Ghalib HB. Hydrogeochemical modelling of groundwater at Al-Nile area, center of Babylon Governorate, Iraq. Journal of University of Babylon for Engineering Sciences. 2018;26(9):180-197.
- Alkarawi HH, Zotz G. Phytic acid in green leaves of herbaceous plants temporal variation in situ and response to different nitrogen/phosphorus fertilizing regimes. AoB Plants. 2014;6:plu048. doi:10.1093/aobpla/plu048.
- Al Kharusi L, Assaha DV, Al-Yahyai R, Yaish MW. Screening of date palm (Phoenix dactylifera L.) cultivars for salinity tolerance. Forests. 2017;8(4):136. doi:10.3390/f8040136.
- Al-Othman AK. A fuzzy state estimator based on uncertain measurements. Measurement. 2009;42(4):628-637. doi:10.1016/j.measurement.2008.10.007.
- Al-Sulaiman MA, Aboukarima AM, Attaher SM. Estimation of total dissolved salts of irrigation water using adaptive neuro fuzzy inference system. Egyptian Journal of Agricultural Research. 2014;92(3):10971116. doi:10.21608/ejar.2014.156447.
- Bezdek JC. Pattern recognition with fuzzy objective function algorithms. New York: Springer Science & Business Media; 2013. doi:10.1007/978-1-4757-04501.
- de Campos Souza PV. Fuzzy neural networks and neuro-fuzzy networks: a review of the main techniques and applications used in the literature. Applied Soft Computing. 2020;92:106275. doi:10.1016/j.asoc.2020.106275.
- Dubey S, Pandey RK, Gautam SS. Literature review on fuzzy expert system in agriculture. International Journal of Soft Computing and Engineering. 2013;2(6):289291.
- Haj-Amor Z, Hashemi H, Bouri S. Soil salinization and critical shallow groundwater depth under saline irrigation condition in a Saharan irrigated land. Arabian Journal of Geosciences. 2017;10(14):301. doi:10.1007/s12517-017-3093-y.
- Hembram TK, Saha S. Spatial land degradation vulnerability assessment in a plateau fringe river basin of Jharkhand, India. Environmental Monitoring and Assessment. 2025;197(2):143. doi:10.1007/s10661024-13529-7.
- Hussain MI, Danish S, Naqvi SA, Jaskani MJ, Asghar MA, Khan IA, et al. Physiological, biochemical, and comparative genome analysis of salt and drought stress impact on date palm (Phoenix dactylifera L.): tolerance mechanism and management. Plant Growth Regulation. 2024;104(3):1261-1283. doi:10.1007/s10725-02401225-y.
- Khavarian-Garmsir AR, Rezaei MR. Selection of appropriate locations for industrial areas using GISfuzzy methods: a case study of Yazd Township, Iran. Journal of Settlements and Spatial Planning. 2015;6(1):19-25.
- Li A, Wu YZ, Cao SZ. Effects of land use-land cover on soil water and salinity contents. Ecology Frontiers. 2024;44(2):307-314. doi:10.1016/j.chnaes.2023.07.002.
- Liu J, Zhang L, Dong T, Wang J, Fan Y, Wu H, et al. The applicability of remote sensing models of soil salinization based on feature space. Sustainability. 2021;13(24):13711. doi:10.3390/su132413711.
- Mamdani EH. A fuzzy rule-based method of controlling dynamic processes. In: Proceedings of the 20th IEEE Conference on Decision and Control including the Symposium on Adaptive Processes; 1981 Dec 16; IEEE. p. 1098-1103. doi:10.1109/CDC.1981.269389.
- Maria AJ, Castiello C, Luis M, Mencar C. Explainable fuzzy systems: paving the way from interpretable fuzzy systems to explainable AI systems. Studies in Computational Intelligence. 2021;970:1-253.
- Nassif WG, Ahmed MM, Al-Taai OT. Influence of precipitation and evaporation on water balance in Iraq. Indian Journal of Ecology. 2022;48:117-123.
- Nourani V, Maleki S, Najafi H, Baghanam AH. A fuzzy logic-based approach for groundwater vulnerability assessment. Environmental Science and Pollution Research. 2024;31(12):18010-18029. doi:10.1007/s11356-023-26236-6.
- Omran SH, Shneen SW, Ali MH, Jawad QA, Gitaffa SA, Salman HM. Comparative traditional methods of attributes with fuzzy quality control charts for improving the quality of a product. Journal of Fuzzy Systems and Control. 2025;3(1):22-29. doi:10.59247/jfsc.v3i1.273.
- Patyra MJ, Mlynek DJ, editors. Fuzzy logic: implementation and applications. New York: Springer Science & Business Media; 2012.
- Peckol JK. Introduction to fuzzy logic. Hoboken: John Wiley & Sons; 2021. doi:10.1002/9781119772644.
- Puente J, Gascon F, Ponte B, de la Fuente D. On strategic choices faced by large pharmaceutical laboratories and their effect on innovation risk under fuzzy conditions. Artificial Intelligence in Medicine. 2019;100:101703. doi:10.1016/j.artmed.2019.101703. International Journal of Agriculture and Nutrition https://www.agriculturejournal.net
- Qureshi AS, Al-Falahi AA. Extent, characterization and causes of soil salinity in central and southern Iraq and possible reclamation strategies. International Journal of Engineering Research and Applications. 2015;5(1):8494.
- Smith ET. Why the Japanese are going in for this 'fuzzy logic'. Business Week. 1993;39.
- Verma H, Gupta A, Kirar JS, Prasad M, Lin CT. Introduction to computational methods: machine and deep learning perspective. In: Computational Intelligence Aided Systems for Healthcare Domain. Boca Raton: CRC Press; 2023. p. 1-32. doi:10.1201/9781003368342-1.
- Yahia ME, Saeed ME, Salih AM. An intelligent algorithm for Arabic soundex function using intuitionistic fuzzy logic. In: Proceedings of the 3rd International IEEE Conference on Intelligent Systems; 2006; IEEE. p. 711-715. doi:10.1109/IS.2006.348506.
- Zabar AF, Borowy A. Cultivation of date palm in Iraq. Annales Universitatis Mariae Curie-Skłodowska Sectio EEE Horticultura. 2012;22(1).