
Research article · 2026 · Full text
International Journal of Biology SciencesGenetic diversity analysis in cotton i.e. (Gossypium hirsutum L.) genotypes using RAPD markers
Volume 8(5) · Pages 36–39 · DOI: 10.33545/26649926.2026.v8.i5a.825 ↗
Research areasResearch in Cotton CultivationGenetic Mapping and Diversity in Plants and AnimalsGenetics and Plant Breeding
Abstract
Author-writtenGenetic Diversity and Molecular Characterization of cotton genotypes is essential for breeding and conservation programs. This study evaluates the genetic diversity of eight cotton genotypes (Phule Tarang, Phule Shubhra, Phule Mahi, Phule 688, Phule 388, Phule Anmol, Phule 492, and Phule Dhanwantari) using Random Amplified Polymorphic DNA (RAPD) markers. Genomic DNA was extracted via the CTAB method, with quality assessment through electrophoresis and spectrophotometry (1.7-2.0 ng/µl). PCR amplification using six RAPD primers generated 20 amplicons, 16 of which were polymorphic (80% polymorphism). Jaccard’s similarity coefficient ranged from 0.33 to 0.87, with the highest similarity (0.87) between Phule 388 and Phule Anmol and the lowest (0.33) between Phule Tarang and Phule Dhanwantari. Dendrogram analysis classified the genotypes into two major clusters: Cluster A (sub-clusters A1 and A2) and Cluster B. Phule Tarang exhibited genetic similarity ranging from 33% to 50%, indicating moderate to distant relationships. These findings provide valuable insights and highlight the high genetic diversity in cotton varieties, crucial for breeding and genetic improvement.
Summary
Source-checkedPlain-language reading of the full paper, prepared with AI and checked against the text. Each point links to the authors' own words.
Why it matters
- Cotton (Gossypium hirsutum L.) is a globally significant textile and fiber crop grown in over 60 countries. View evidence ↗
- Beyond textiles, cotton is a multipurpose crop providing oil, protein, seeds, and linters. View evidence ↗
- Molecular characterization and the study of genetic diversity are critical for the success of cotton conservation and breeding programs. View evidence ↗
The question
- The study aimed to evaluate the genetic diversity of eight specific cotton genotypes using Random Amplified Polymorphic DNA (RAPD) markers. View evidence ↗
What they did
- Genomic DNA was isolated using the CTAB method, with quality confirmed via spectrophotometry, showing concentrations between 1.7 and 2.0 ng/µl. View evidence ↗
- The researchers used six specific RAPD primers (OPA-01, OPA-02, OPA-07, OPA-08, OPA-09, and OPA-10) for PCR amplification. View evidence ↗
- PCR reactions were conducted in 10 µl total volumes, including 35 cycles of annealing. View evidence ↗
What they found
- The use of six RAPD primers produced 20 amplicons, with 16 being polymorphic, resulting in an 80% polymorphism rate. View evidence ↗
- The genetic similarity among the genotypes, measured by Jaccard's coefficient, varied from 0.33 to 0.87. View evidence ↗
- The highest genetic similarity (0.87) was found between Phule 388 and Phule Anmol, while the lowest (0.33) was between Phule Tarang and Phule Dhanwantari. View evidence ↗
- Dendrogram analysis grouped the cotton genotypes into two primary clusters, with Cluster A further divided into two sub-clusters. View evidence ↗
- Phule Tarang showed a genetic similarity of 33% to 50%, suggesting it has moderate to distant relationships with the other genotypes. View evidence ↗
What it means
- The authors conclude that the high genetic diversity observed in these cotton varieties is essential for future genetic improvement and breeding efforts. View evidence ↗
Visual summary
1 visualsIllustrations explain the paper; they do not show study data.
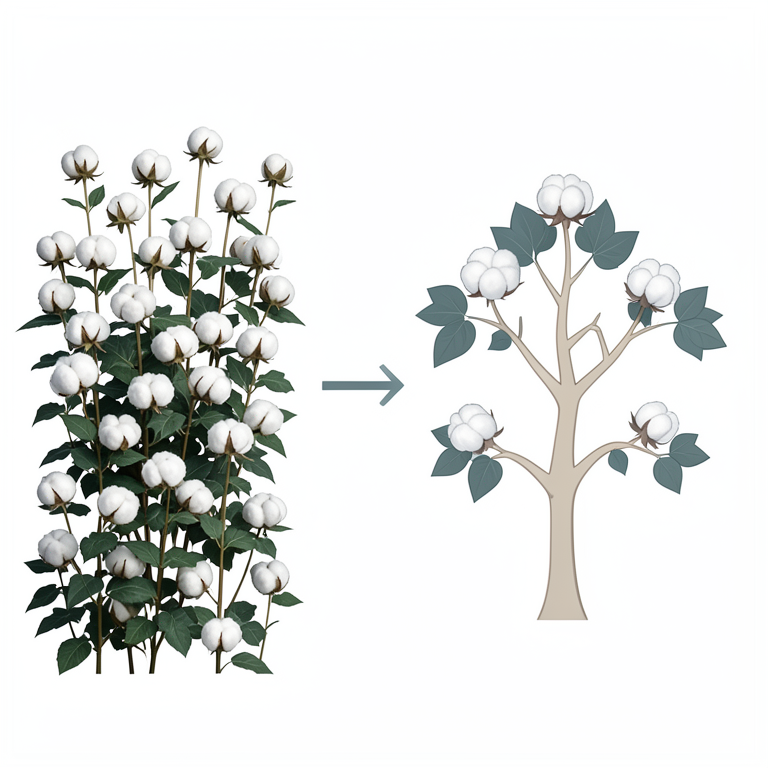
Genotype Clustering Concept
AI-generated conceptual illustration (Cotton plants (Gossypium hirsutum L.)). It explains the idea and does not show study data.
View source evidence ↗Figures & tables
From the original paper Table 1
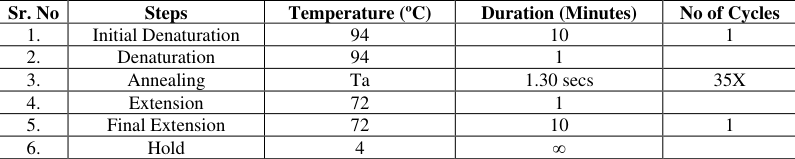 Table 2
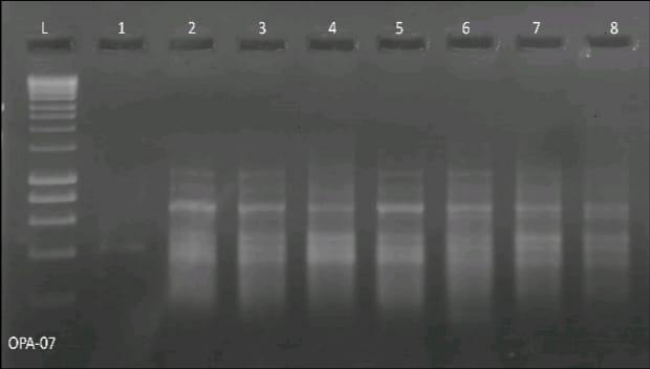 Figure 1
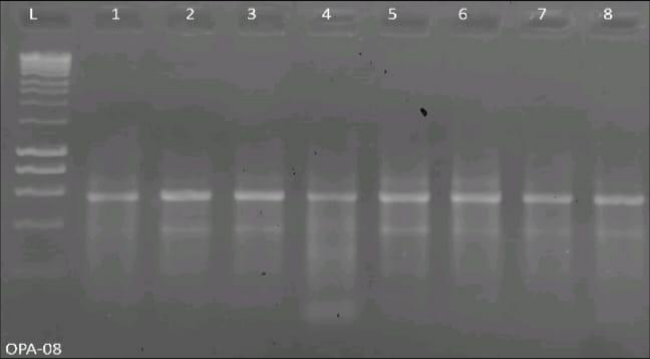 Figure 2
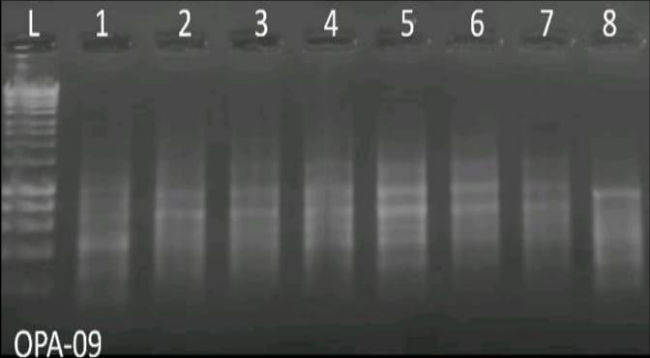 Figure 3
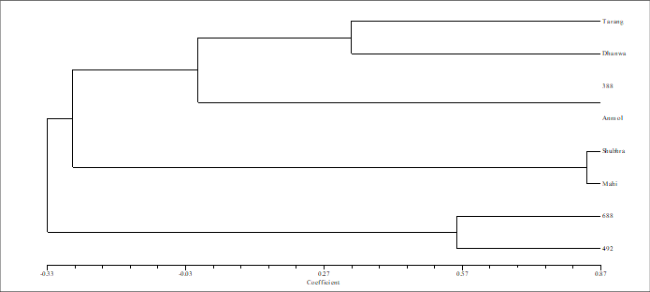 Figure 4
Introduction
Cotton (Gossypium hirsutum L.) is one of the most important fibre and textile crop of the world that is cultivated in subtropical and tropical regions of more than 60 nations (Feng et al. 2017) [5]. Cotton is also famous for its name as “King of fibre plants”. It has many uses in the form of lint fibres and as other cotton by- products. Upland cotton is likewise referred to as “pure white gold” (Kumar and Katageri, 2017) [8].
Cotton belongs to the genus Gossypium af the Malvaceae family which contains 50 species. Out of these, four species are under commercial cultivation viz., Gossypium herbacium (2n=26), Gossypium arboreum (2n=26), Gossypium hirsutum (2n= 52) and Gossypium barbadense (2n=52). Cotton is a fibre, oil and protein yielding crop of global significance. Cotton is a multipurpose crop that gives rise to much primary merchandise like seed, lint, oil, hull and linters.
The most economically important product from the cotton plant provides a source of high- quality fibre for the textile industry. The cotton genus Gossypium (Malvaceae) comprises four cultivated species: two New World tetraploid species, Gossypium hirsutum L. [n=2x=26 (AD)1] and Gossypium barbadense L. [n=2x=26(AD)2] and two old World diploid species, Gossypium arboreum L. [n=x=13, A1] and Gossypium herbaceum L. [n=x=13, A2] (Brubaker et al. 1999] [1].
Materials And Methods
Plant Materials: Eight Cotton (Gossypium hirsutum L.) genotypes were collected from MPKV, Agricultural Research Station, Rahuri. Cotton genotypes used as experimental material such as 1) Phule Tarang, 2) Phule Shubhra, 3) Phule Mahi, 4) Phule 688, 5) Phule 388, 6) Phule Anmol, 7) Phule 492, 8) Phule Dhanwantari. DNA Isolation: The isolation Plant genomic DNA from Seperatly used Eight genotypes of Cotton (Gossypium hirsutum L.) leaves by using modified CTAB method. DNA extracted confirmation by Agarose Gel Electrophorosis method. NAAS Rating (2026): 4.82 IJBS 2026; 8(5): 36-39 MR Shelke Department of Microbial and Environmental Biotechnology, College of Agricultural Biotechnology, Loni, Maharashtra, India SA Fargade Department of Microbial and Environmental Biotechnology, College of Agricultural Biotechnology, Loni, Maharashtra, India SR Shelke Department of Microbial and Environmental Biotechnology, College of Agricultural Biotechnology, Loni, Maharashtra, India MR Shelke Department of Microbial and Environmental Biotechnology, College of Agricultural Biotechnology, Loni, Maharashtra, India https://www.biologyjournal.net Markers’.
Genetic analysis and RAPD polymorphism in soybean genotypes was carried out using 05 RAPD Primer. In these study 8 varieties of cotton crop used to amplification by RAPD primers in PCR in PCR master cycler. The banding pattern thus obtained by RAPD marker clearly distinguished varieties into different clusters showing genetic diversity as shown in Fig 01 to Fig 03. Genetic Similarity estimate based on RAPD banding pattern used for cluster analysis to present genetic relationship in the form of dendrogram Cluster (Fig. 04). PCR Amplification for RAPD Analysis: Reaction mixture was prepared thin walled PCR tubes containing the following components as shown in Table No.01 and Table No.02 shown cyclic parameter of thermal cycler for RAPD.
The RAPD Primers used for amplification such as 1) OPA-01, 2) OPA-02, 3) OPA-07, 4) OPA-08 and 5) OPA-09 6) OPA-10.
Results And Discussions
The present study entitled ‘Genetic Diversity Analysis in Cotton i.e. (Gossypium hirsutum L.) genotypes using RAPD Table 1: Reagents for PCR reaction mix Sr.no Components Volume(µl) 1 PCR Reaction Mix(Taq DNA polymerase, dNTPs, MgCl2and reaction buffer). 5 2 Primer 2 3 Molecular Grade water 1 4 Template DNA 2 Total 10 Table 2: Temperature Profile for PCR Amplification Sr. No Steps Temperature (ºC) Duration (Minutes) No of Cycles 1. Initial Denaturation 94 10 1 2. Denaturation 94 1 3.
| Sr. No | Steps | Temperature (ºC) | Duration (Minutes) | No of Cycles |
|---|---|---|---|---|
| 1. | Initial Denaturation | 94 | 10 | 1 |
| 2. | Denaturation | 94 | 1 | |
| 3. | Annealing | Ta | 1.30 secs | 35X |
| 4. | Extension | 72 | 1 | |
| 5. | Final Extension | 72 | 10 | 1 |
| 6. | Hold | 4 | ∞ |
Table text extracted from the original PDF; superscript letters are shown inline. The original table image is below.
View original table image
| Sr.no | Components | Volume(µl) |
|---|---|---|
| 1 | PCR Reaction Mix(Taq DNA polymerase, dNTPs, MgCl2and reaction buffer). | 5 |
| 2 | Primer | 2 |
| 3 | Molecular Grade water | 1 |
| 4 | Template DNA | 2 |
| Total | 10 |
Table text extracted from the original PDF; superscript letters are shown inline. The original table image is below.
View original table image
Annealing Ta 1.30 secs 35X 4. Extension 72 1 5. Final Extension 72 10 1 6. Hold 4 ∞ Fig 1: RAPD profile of Cotton genotypes created by OPA 07 Fig 2: RAPD profile of Cotton genotypes created by OPA 08 https://www.biologyjournal.net Fig 3: RAPD profile of Cotton genotypes created by OPA 09 Fig 4: Dendrogram showing results of RAPD analysis of Cotton varieties 2.
Bukhari SA, Iqbal MA, Naz S. Studies on genetic diversity of cotton using RAPD markers. Pure Appl Biol. 2021;3(3):95-100. 3. Chaudhary L, Sindhu A, Kumar M, Kumar R, Saini M.
Estimation of genetic divergence among some cotton varieties by RAPD analysis. J Plant Breed Crop Sci. 2010;2(3):39-43. 4. Esmail RM, Zhang JF, Abdel-Hamid AM. Genetic diversity in elite cotton germplasm lines using field performance and RAPD markers.
World J Agric Sci. 2008;4(3):369-375. 5. Feng L, Dai J, Tian L, Zhang H, Li W, Dong H. Review of the technology for high-yielding and efficient cotton cultivation in the northwest inland cotton-growing region of China. Field Crops Res. 2017;208:18-26. 6.
Iqbal MJ, Aziz N, Saeed NA, Zafar Y, Malik KA. Genetic diversity evaluation of some elite cotton varieties by RAPD analysis. Theor Appl Genet. 1997;94:139-144. 7. Khan AI, Awan FS, Sadia B, Rana RM, Khan IA.
Genetic diversity studies among coloured cotton genotypes by using RAPD markers. Pak J Bot. 2010;42(1):71-77. 8. Kumar NM, Katageri IS. Genetic variability and heritability study in F2 population of Gossypium barbadense L. cotton for yield and its components.
Int J Curr Microbiol Appl Sci. 2017;6(6):975-983. 9. Kumar P, Singh K, Vikal Y, Randhawa LS, Chahal GS.
Summary
and Conclusion Cotton (Gossypium hirsutum L.) is one of the most important fibre and textile crops cultivated in over 60 countries worldwide. Known as the "King of Fibre Plants" and "Pure White Gold," cotton provides high-quality fibre for the textile industry and serves multiple purposes, including oil and protein production. The genus Gossypium belongs to the Malvaceae family and consists of 50 species, with four being commercially cultivated: Gossypium herbaceum (2n=26), Gossypium arboreum (2n=26), Gossypium hirsutum (2n=52), and Gossypium barbadense (2n=52). Apart from fibre, cotton by-products have applications in food, pharmaceuticals, cosmetics, and industrial manufacturing.
In this study, genomic DNA was extracted from eight cotton genotypes (Phule Tarang, Phule Shubhara, Phule Mahi, Phule 688, Phule 388, Phule Anmol, Phule 492, and Phule Dhanwantari) using the CTAB method. DNA quality was confirmed through electrophoresis, with spectrometer measurements ranging from 1.7 to 2.0 ng/µl. The DNA samples were diluted to 20 ng/µl for further genetic diversity analysis using six RAPD primers. The amplification process generated 20 amplicons, with an average of 3.3 per primer, out of which 16 were polymorphic, leading to an 80% polymorphism rate.
The Jaccard's similarity coefficient ranged from 0.33 to 0.87, with the highest genetic similarity (0.87) observed between Phule 388 and Phule Anmol and the lowest similarity (0.33) between Phule Tarang and Phule Dhanwantari.
References
7 in the original paper- Brubaker CL, Paterson AH, Wendel JF. Comparative Genetic diversity studies of elite cotton germplasm lines using RAPD markers and morphological characteristics. Indian J Genet. 2003;63(1):5-10. genetic mapping of allotetraploid cotton and its diploid progenitors. Genome. 1999;42(2):184-203. https://www.biologyjournal.net
- Parre S, Patil RS. Assessment of molecular diversity using RAPD markers in elite genotypes of cotton (Gossypium hirsutum L.). 2021.
- Patil MD, Biradar DP, Patil VC, Janagoudar BS, Nadaf HL. Analysis of genetic diversity of cotton genotypes using RAPD PCR technique. Karnataka J Agric Sci. 2007;20(2):215.
- Tyagi S, Verma SK, Nehra K, Bajya DR. Molecular marker based genetic diversity analysis in cotton using RAPD and SSR markers. J Cotton Res Dev. 2015;29(2):232-236.
- Verma SK, Tuteja OP. Genetic diversity analysis of CGMS lines A, B and restorer lines in tetraploid cotton (Gossypium hirsutum L.) using RAPD markers. J Pharmacogn Phytochem. 2021;10(1):2549-2554.
- Welsh J, McClelland M. Fingerprinting genomes using PCR with arbitrary primers. Nucleic Acids Res. 1990;18(24):7213-7218.
- Williams JG, Kubelik AR, Livak KJ, Rafalski JA, Tingey SV. DNA polymorphisms amplified by arbitrary primers are useful as genetic markers. Nucleic Acids Res. 1990;18(22):6531-6535.