
Research article · 2025 · Full text
International Journal of Biology SciencesPollinator network structure and robustness in agricultural landscapes with varying land use intensity
Volume 7(1) · Pages 235–238 · DOI: 10.33545/26649926.2025.v7.i1d.828 ↗
Research areasPlant and animal studiesInsect and Arachnid Ecology and BehaviorEcology and Vegetation Dynamics Studies
Abstract
Author-writtenAgricultural intensification threatens pollination services by simplifying plant-pollinator interaction networks, yet quantitative data from tropical island agroecosystems remain scarce. This research characterized pollinator network structure and simulated robustness across three land use categories on Unguja Island, Zanzibar: natural coastal forest remnants, mixed smallholder farmland, and intensive clove-coconut monocultures. Pollinator-plant interactions were recorded along standardized transects during wet and dry seasons from January to October 2022. A total of 4,218 interaction events involving 127 pollinator species and 89 plant species were documented. Natural habitats supported the richest networks (connectance 0.82, nestedness 0.71) while intensive agriculture showed highest specialization (0.71) but lowest robustness (0.38). Simulated random species removal demonstrated that intensive agricultural networks collapsed after losing 34.2% of pollinator species, compared with 61.8% in natural habitats. Wild bee diversity was 73.6% lower in intensive sites than in natural habitats. These findings indicate that agricultural intensification on Zanzibar erodes network robustness to a degree that may threaten pollination security for both crops and wild plants.
Summary
Source-checkedPlain-language reading of the full paper, prepared with AI and checked against the text. Each point links to the authors' own words.
Why it matters
- Agricultural intensification may threaten pollination services by simplifying the networks of interactions between plants and pollinators, a process that is poorly quantified in tropical island agroecosystems. View evidence ↗
- Theoretical models suggest that networks characterized by high connectance and nestedness are more resilient to the loss of species than those that are specialized or modular. View evidence ↗
- Tropical agricultural landscapes are highly dependent on animal pollination and possess high pollinator diversity, yet they have been less studied than temperate systems. View evidence ↗
The question
- The study aimed to characterize the structure and simulate the robustness of pollinator networks across three land use types on Unguja Island, Zanzibar: natural coastal forests, mixed smallholder farms, and intensive clove-coconut monocultures. View evidence ↗
What they did
- The researchers established four replicate sites for each land use category, with each site containing three 200-meter transects separated by at least 500 meters. View evidence ↗
- The study analyzed networks using metrics for connectance, weighted nestedness, modularity, interaction specialization, and robustness, the latter of which was simulated through 1,000 iterations of random and targeted pollinator removal. View evidence ↗
What they found
- The study documented 4,218 interaction events involving 127 pollinator species and 89 plant species. View evidence ↗
- Pollinator species richness declined significantly with intensification, with natural habitats supporting 87 species compared to only 23 in intensive agriculture (a 3.8-fold difference). View evidence ↗
- Network connectance (0.82 in natural vs 0.43 in intensive) and weighted nestedness (0.71 in natural vs 0.39 in intensive) both decreased sharply as land use intensity increased. View evidence ↗
- Interaction specialization increased with intensification, rising from 0.34 in natural habitats to 0.71 in intensive sites. View evidence ↗
- Intensive agricultural networks were significantly less robust (0.38) than natural networks (0.78), collapsing after a 34.2% loss of pollinator species compared to a 61.8% loss in natural habitats. View evidence ↗
- Wild bee abundance declined by 73.6% in intensive sites (23.0±6.4 per transect) compared to natural habitats (87.3±14.6 per transect). View evidence ↗
- While wild pollinators declined, honeybee abundance increased by 128.4% in intensive sites, suggesting managed bees partially fill interaction gaps but do not replace the functional diversity of wild species. View evidence ↗
What it means
- The authors conclude that relying exclusively on managed honeybees creates fragile pollination systems that may not withstand future environmental changes. View evidence ↗
- The study's scope was limited to a single island, which may not be generalizable to mainland tropical agroecosystems with different connectivity and larger species pools. View evidence ↗
- The use of 200-meter transects likely resulted in the undersampling of nocturnal pollinators, who may be important for pollination in clove plantations. View evidence ↗
Visual summary
3 visualsIllustrations explain the paper; charts are replotted from the paper's own table values.
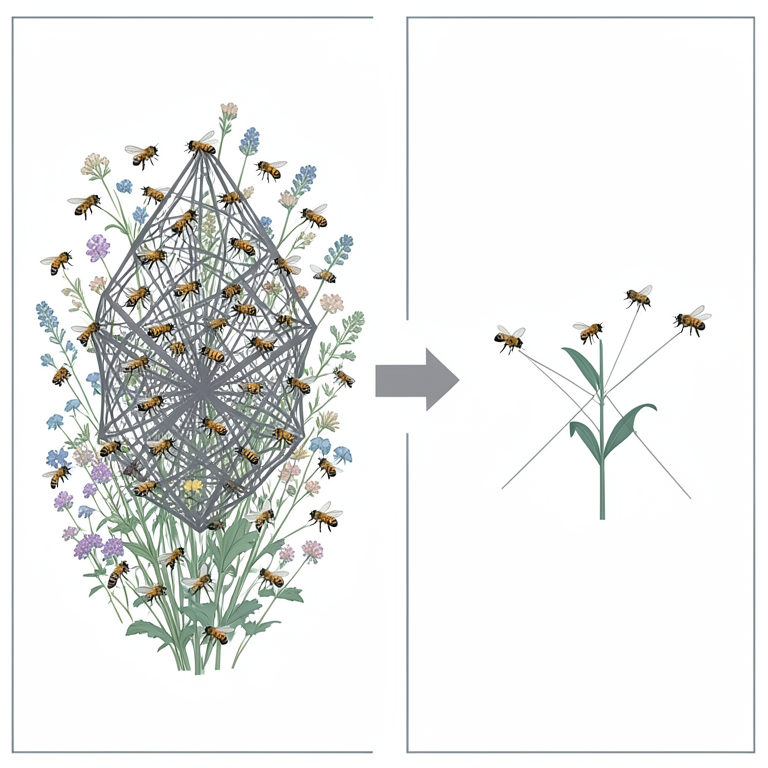
Network Structure Shift
AI-generated conceptual illustration (wild bees and flowering meadow plants). It explains the idea and does not show study data.
View source evidence ↗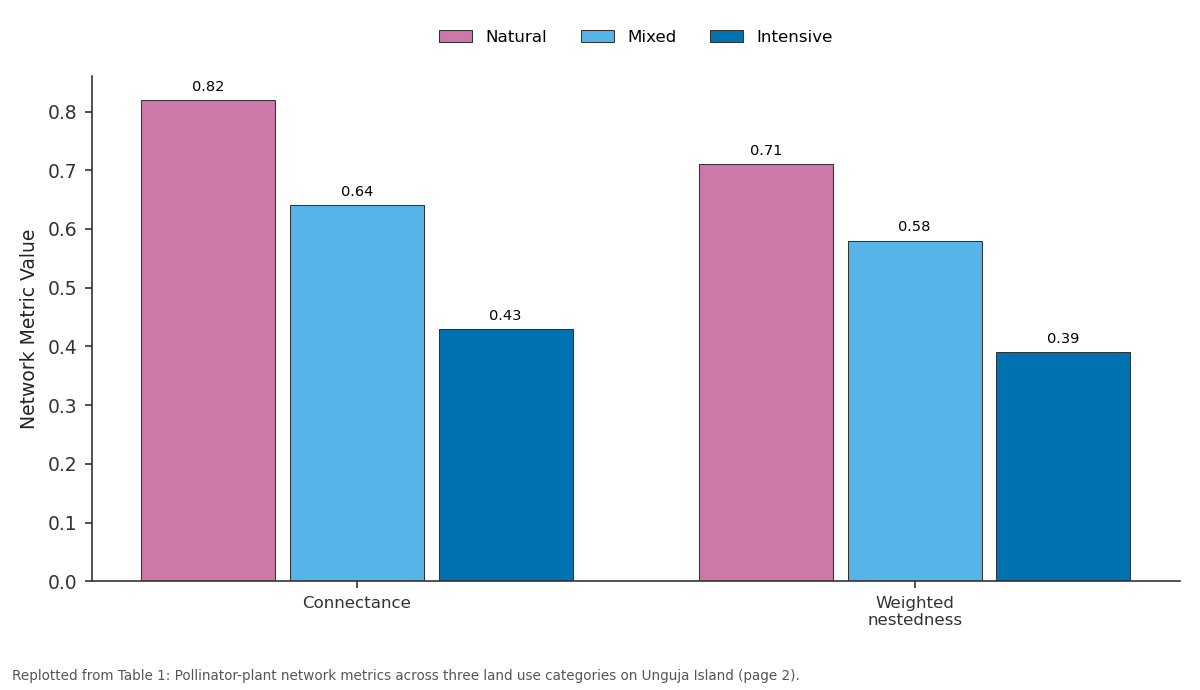
Natural and Mixed and more: Connectance vs Weighted nestedness
Replotted from Table 1 (page 2) of the original paper. Every bar is the paper's own table value.
View source evidence ↗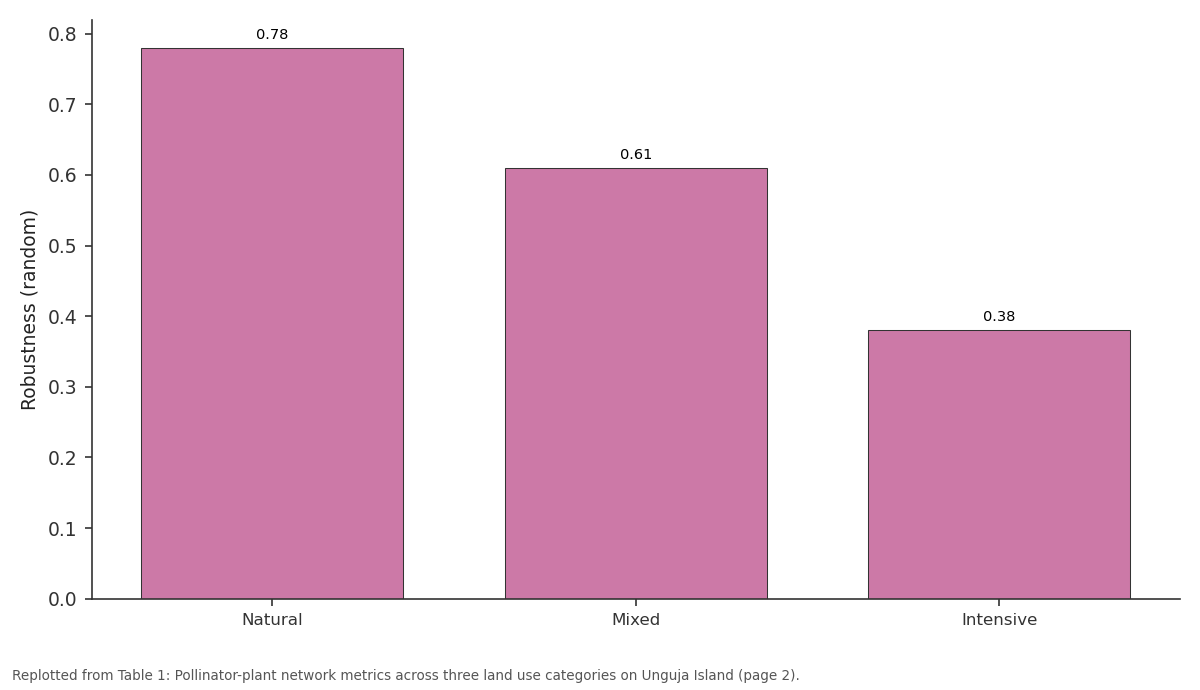
Robustness (random): Natural vs Mixed vs Intensive
Replotted from Table 1 (page 2) of the original paper. Every bar is the paper's own table value.
View source evidence ↗Figures & tables
From the original paper Table 1
 Table 2
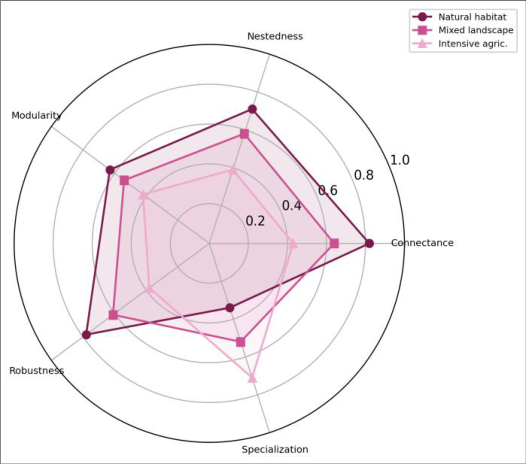 Figure 1
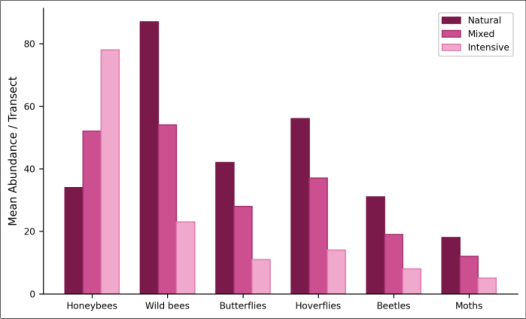 Figure 2
Introduction
Take a handful of bees away from a meadow and the flowers still get pollinated. Take half of them away and some flowers begin to fail. But where exactly does the tipping point lie and does it differ between natural habitats and farmland? These questions are at the heart of pollination network robustness research [1,2] . Plant-pollinator interaction networks can be described using metrics borrowed from graph theory: connectance measures the fraction of possible links that are realized, nestedness captures whether specialist species interact with subsets of the partners used by generalists, and modularity describes how strongly the network partitions into discrete compartments [3,4] . Theoretical work predicts that nested, well-connected networks are more robust to species loss than modular, specialized ones [5] . Most empirical tests of these predictions come from temperate European or North American systems [6] . Tropical agricultural landscapes where smallholder farming often creates complex mosaics of crops, fallows, and forest fragments have received less attention, even though they harbor high pollinator diversity and depend heavily on animal pollination for food production [7,8] . Zanzibar's Unguja Island offers a useful gradient: intact coastal forest adjacent to traditional mixed farming and, increasingly, intensified clove-coconut monocultures driven by export demand. This research quantified pollinator network structure across these three land use types and simulated network robustness to random and targeted species removal at the Zanzibar College of Marine Biology, Stone Town [9,10] .
Materials and Methods
Materials and Methods
Materials
This research was conducted from January through October 2022, based at the Department of Ecology and Environmental Biology, Zanzibar College of Marine Biology, Stone Town, Tanzania. Research permits were obtained from the Zanzibar Department of Forestry and Non-Renewable Resources (Permit No. DFNR-2022-018, issued 12 January 2022).
Research area description
Unguja Island (6°S, 39°E) spans approximately 1,660 km² with a tropical monsoon climate (mean annual temperature 27.3 °C, rainfall 1,600 mm). Three land use categories were selected: natural coastal forest remnants at Jozani-Chwaka Bay National Park (closed canopy, minimal human disturbance); mixed smallholder farmland in central Unguja (cassava, banana, rice with scattered shade trees); and intensive clove-coconut monocultures in the northern district of Mkokotoni (>90% canopy cover by Syzygium aromaticum and Cocos nucifera). Four replicate sites per category were established, each with three 200 m transects spaced at least 500 m apart.
Methods
Pollinator-plant interactions were recorded during monthly 30-minute observation walks along each transect between 08:00 and 12:00 during both wet (March-May) and dry (June-October) seasons. Any insect observed contacting floral reproductive parts was recorded along with the plant species visited. Pollinators were identified to genus or species level using regional keys; voucher specimens were deposited at the Zanzibar National Museum.
Biodiversity assessment
Species richness, Shannon diversity, and Simpson evenness were calculated for both pollinator and plant communities at each site. Interaction matrices were constructed per land use category and analyzed using the bipartite package in R v4.2.1. Network metrics computed included connectance, weighted nestedness (WNODF), modularity (QuanBiMo algorithm), interaction specialization (H2'), and robustness (area under the extinction curve following random and targeted pollinator removal simulations with 1,000 iterations each).
Results
A total of 4,218 interaction events were recorded across 127 pollinator species and 89 flowering plant species. Table 1 summarizes the network metrics by land use type.
| Network Metric | Natural | Mixed | Intensive | p-value |
|---|---|---|---|---|
| Pollinator species richness | 87 | 54 | 23 | <0.001 |
| Plant species richness | 62 | 41 | 18 | <0.001 |
| Total interactions | 1,847 | 1,486 | 885 | |
| Connectance | 0.82 | 0.64 | 0.43 | <0.001 |
| Weighted nestedness | 0.71 | 0.58 | 0.39 | 0.002 |
| Modularity | 0.63 | 0.54 | 0.42 | 0.011 |
| Specialization (H2') | 0.34 | 0.52 | 0.71 | <0.001 |
| Robustness (random) | 0.78 | 0.61 | 0.38 | <0.001 |
Table text extracted from the original PDF; superscript letters are shown inline. The original table image is below.
View original table image
Comprehensive interpretation
The network data reveal a consistent degradation pattern with intensification: declining connectance, nestedness, and robustness, coupled with rising specialization. The critical finding is the robustness difference intensive agricultural networks collapse at 34.2% species loss versus 61.8% for natural habitats. The paradoxical increase in honeybee abundance with intensification (+128.4%) alongside steep declines in wild pollinator groups suggests that managed honeybees partially fill interaction gaps but cannot replicate the functional diversity of wild pollinator assemblages [7,8] .
Discussion
The 3.8-fold difference in pollinator species richness between natural and intensive sites is comparable to declines reported from tropical mainland systems in Kenya and Costa Rica [6,11] . The network-level consequences a halving of connectance and robustness suggest that species loss cascades through interaction structure in ways that simple diversity metrics don't fully capture. The inverse relationship between honeybee dominance and network robustness deserves attention. While honeybees are effective generalist pollinators, their numerical dominance in intensive sites may mask underlying functional fragility. If honeybee populations decline through disease, management failure, or environmental stress the simplified networks they anchor would lack redundant partners to buffer the loss [12,13] .
A limitation is the single-island geographic scope, which may not generalize to mainland tropical agroecosystems with larger species pools and different landscape connectivity [14] . The 200-m transect method also likely undersampled nocturnal pollinators, which may contribute meaningfully to pollination services in clove plantations where evening-flowering species are present [15,16,17,18] .
Conclusion
This research demonstrated that agricultural intensification on Zanzibar progressively degrades pollinator network structure, reducing connectance, nestedness, and robustness while increasing interaction specialization. Intensive clovecoconut monocultures supported only 26.4% of the pollinator species found in adjacent natural habitats, and their interaction networks were far more vulnerable to simulated species loss. The findings argue for maintaining natural habitat fragments and diversifying crop systems to preserve the structural properties of pollinator networks that buffer against species loss. Management strategies that rely solely on managed honeybees risk creating functionally fragile pollination systems unable to withstand future environmental perturbations.
Acknowledgement
Acknowledgements Funding sourcesThis research was supported by the Tanzania Commission for Science and Technology and a biodiversity conservation grant from the Zanzibar College of Marine Biology. Institutional supportThe authors acknowledge the Zanzibar College of Marine Biology for logistical support and the Jozani-Chwaka Bay National Park administration for research access.
Figures and tables from the paper
| Functional Group | Natural | Mixed | Intensive | Decline (%) | p-value |
|---|---|---|---|---|---|
| Honeybees | 34.2±8.1 | 52.4±11.3 | 78.1±14.6 | +128.4 | <0.001 |
| Wild bees | 87.3±14.6 | 54.1±9.8 | 23.0±6.4 | -73.6 | <0.001 |
| Butterflies | 42.4±7.3 | 28.1±5.9 | 11.3±3.7 | -73.3 | <0.001 |
| Hoverflies | 56.2±9.7 | 37.4±7.1 | 14.2±4.8 | -74.7 | <0.001 |
| Beetles | 31.3±6.8 | 19.2±5.4 | 8.1±3.1 | -74.1 | <0.001 |
| Moths | 18.4±4.2 | 12.3±3.6 | 5.4±2.1 | -70.7 | 0.002 |
Table text extracted from the original PDF; superscript letters are shown inline. The original table image is below.
View original table image
References
17 in the original paper- Memmott J, Waser NM, Price MV. Tolerance of pollination networks to species extinctions. Proceedings of the Royal Society B. 2004;271(1557):2605-2611.
- Bascompte J, Jordano P, Melián CJ, Olesen JM. The nested assembly of plant-animal mutualistic networks. Proceedings of the National Academy of Sciences of the United States of America. 2003;100(16):9383-9387.
- Dunne JA, Williams RJ, Martinez ND. Network structure and biodiversity loss in food webs: robustness increases with connectance. Ecology Letters. 2002;5(4):558-567.
- Dormann CF, Fründ J, Blüthgen N, Gruber B. Indices, graphs and null models: analyzing bipartite ecological networks. Open Ecology Journal. 2009;2:7-24.
- Thébault E, Fontaine C. Stability of ecological communities and the architecture of mutualistic and trophic networks. Science. 2010;329(5993):853-856.
- Potts SG, Biesmeijer JC, Kremen C, Neumann P, Schweiger O, Kunin WE. Global pollinator declines: trends, impacts and drivers. Trends in Ecology and Evolution. 2010;25(6):345-353.
- Klein AM, Vaissière BE, Cane JH, Steffan-Dewenter I, Cunningham SA, Kremen C, Tscharntke T. Importance of pollinators in changing landscapes for world crops. International Journal of Biology Sciences https://www.biologyjournal.net Proceedings of the Royal Society B. 2007;274(1608):303-313.
- Garibaldi LA, Steffan-Dewenter I, Winfree R, Aizen MA, Bommarco R, Cunningham SA, Kremen C, Carvalheiro LG, Harder LD, Afik O, et al. Wild pollinators enhance fruit set of crops regardless of honey bee abundance. Science. 2013;339(6127):16081611.
- Tylianakis JM, Laliberté E, Nielsen A, Bascompte J. Conservation of species interaction networks. Biological Conservation. 2010;143(10):2270-2279.
- Vanbergen AJ; Insect Pollinators Initiative. Threats to an ecosystem service: pressures on pollinators. Frontiers in Ecology and the Environment. 2013;11(5):251-259.
- Hagen M, Kraemer M. Agricultural surroundings support flower-visitor networks in an Afrotropical rain forest. Biological Conservation. 2010;143(7):16541663.
- Winfree R, Aguilar R, Vázquez DP, LeBuhn G, Aizen MA. A meta-analysis of bees' responses to anthropogenic disturbance. Ecology. 2009;90(8):20682076.
- Brittain C, Kremen C, Klein AM. Biodiversity buffers pollination changes in environmental conditions. Global Change Biology. 2013;19(2):540-547.
- Hoehn P, Tscharntke T, Tylianakis JM, SteffanDewenter I. Functional group diversity of bee pollinators increases crop yield. Proceedings of the Royal Society B. 2008;275(1648):2283-2291.
- Ollerton J, Winfree R, Tarrant S. How many flowering plants are pollinated by animals? Oikos. 2011;120(3):321-326.
- Schleuning M, Fruend J, Klein AM, Grund S, Grill A, Guenther A, Harper GL, Matsumoto T, Mulligan M, 0gilvie JE, Fieseler C. Specialization of mutualistic interaction networks decreases toward tropical latitudes. Current Biology. 2012;22(20):1925-1931.
- Burkle LA, Marlin JC, Knight TM. Plant-pollinator interactions over 120 years: loss of species, cooccurrence, and function. Science. 2013;339(6127):1611-1615.