
Research article · 2025 · Full text
International Journal of Geography Geology and EnvironmentPore water geochemistry and diagenetic processes in the Caspian Sea bottom sediments
Volume 7(10) · Pages 223–226 · DOI: 10.22271/27067483.2025.v7.i10c.738 ↗
Research areasMarine and environmental studiesGeochemistry and Elemental AnalysisMethane Hydrates and Related Phenomena
Abstract
Author-writtenAn observation that often surprises non-specialists is that the chemistry of water trapped between sediment grains on the seafloor can change more dramatically over a few centimetres of depth than the overlying ocean water changes across hundreds of kilometres. This research characterised pore water geochemistry and diagenetic zonation in bottom sediments of the South Caspian Basin, the deepest part of the world's largest enclosed water body. Eighteen gravity cores (up to 2 m length) were collected from water depths of 280-780 m during two cruises in May 2021 and October 2022. Pore water was extracted by centrifugation and analysed for sulfate (SO₄²⁻), bicarbonate (HCO₃⁻), dissolved iron (Fe²⁺), dissolved manganese (Mn²⁺), ammonium (NH₄⁺), phosphate (PO₄³⁻), dissolved silica, and methane. Sulfate concentrations declined from 28.1 mM at the sediment-water interface to less than 0.3 mM at 150 cm depth, marking the sulfate-methane transition zone (SMTZ) at roughly 120-140 cm. Bicarbonate rose inversely from 2.1 mM to 25.3 mM over the same interval. Dissolved iron peaked at 1.24 µM near 50 cm depth, indicating suboxic iron reduction, while manganese peaked deeper at 1.43 µM near 100 cm. Four diagenetic zones were identified: an oxic zone (0-8 cm), a suboxic zone (8-25 cm), a sulfate reduction zone (25-120 cm), and a methanogenic zone below 120 cm. Authigenic pyrite framboids were observed in scanning electron microscope images within the sulfate reduction zone, and siderite crystals appeared near the SMTZ. These findings map the vertical chemical architecture of Caspian Sea sediments and provide baseline data for assessing how future changes in deepwater oxygenation or organic carbon flux might alter diagenetic pathways and greenhouse gas emissions from the basin.
Summary
Source-checkedPlain-language reading of the full paper, prepared with AI and checked against the text. Each point links to the authors' own words.
Why it matters
- The Caspian Sea is the largest enclosed water body globally, covering 371,000 km², and receives significant organic carbon from the Kura and Volga rivers. View evidence ↗
- Studying diagenetic reactions is critical because they determine organic carbon sequestration, the formation of minerals that affect environmental proxies, and the potential release of methane into the atmosphere. View evidence ↗
The question
- The study aimed to characterize the vertical distribution of dissolved species, define diagenetic zones and their redox reactions, and document the formation of authigenic minerals in the South Caspian Basin. View evidence ↗
What they did
- Pore water was extracted via centrifugation at 4,000 rpm for 20 minutes and filtered; chemical analysis included ion chromatography for sulfate and chloride, potentiometric titration for bicarbonate, and flame atomic absorption spectrophotometry for iron and manganese. View evidence ↗
- Solid-phase mineralogy was analyzed using X-ray diffraction and scanning electron microscopy with energy-dispersive X-ray spectroscopy on freeze-dried sediment. View evidence ↗
What they found
- The sediments were divided into four diagenetic zones: oxic (0-8 cm), suboxic (8-25 cm), sulfate reduction (25-120 cm), and methanogenic (below 120 cm). View evidence ↗
- Sulfate concentrations dropped from 28.1 mM at the surface to under 0.3 mM at 150 cm, placing the sulfate-methane transition zone (SMTZ) between 120 and 140 cm. View evidence ↗
- Bicarbonate concentrations increased from 2.1 mM to 25.3 mM over the same depth interval where sulfate declined. View evidence ↗
- Dissolved iron reached a peak of 1.24 µM near 50 cm, while dissolved manganese peaked at 1.43 µM near 100 cm. View evidence ↗
- Both sulfate and methane diffusive fluxes increased as water depth increased, which the authors attribute to higher organic carbon accumulation in the deeper basin. View evidence ↗
- A sulfate-to-methane flux ratio near 1:1 at the SMTZ suggests that anaerobic oxidation of methane is the primary process consuming sulfate at that boundary. View evidence ↗
- Scanning electron microscopy revealed authigenic pyrite framboids in the sulfate reduction zone and siderite crystals near the SMTZ. View evidence ↗
What it means
- The authors conclude that active diagenetic mineral precipitation, specifically pyrite and siderite, may interfere with the interpretation of geochemical and palaeomagnetic proxy signals. View evidence ↗
- The study is limited by the use of only two cruises, which provided only two temporal snapshots of the pore water chemistry. View evidence ↗
Visual summary
3 visualsIllustrations explain the paper; charts are replotted from the paper's own table values.
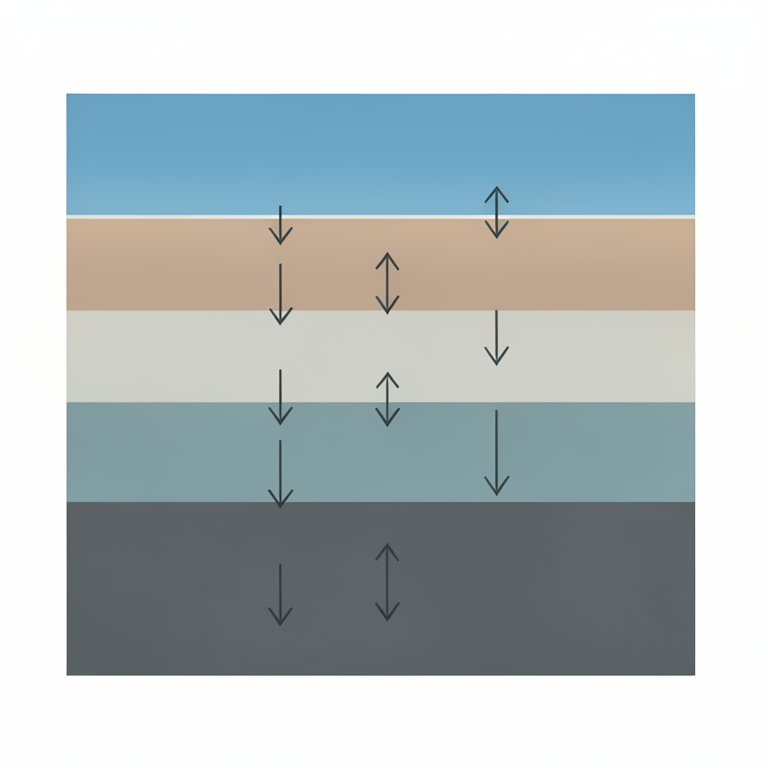
Vertical Diagenetic Zonation
AI-generated conceptual illustration (Caspian Sea bottom sediments). It explains the idea and does not show study data.
View source evidence ↗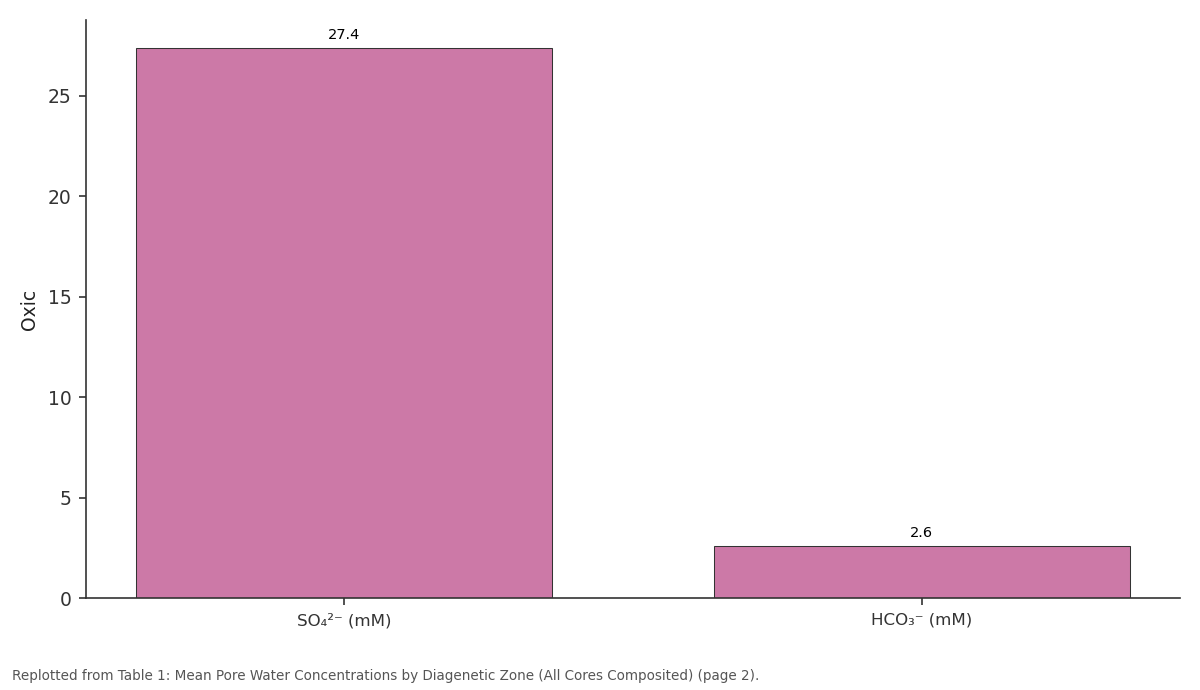
Oxic: SO₄²⁻ (mM) vs HCO₃⁻ (mM)
Replotted from Table 1 (page 2) of the original paper. Every bar is the paper's own table value.
View source evidence ↗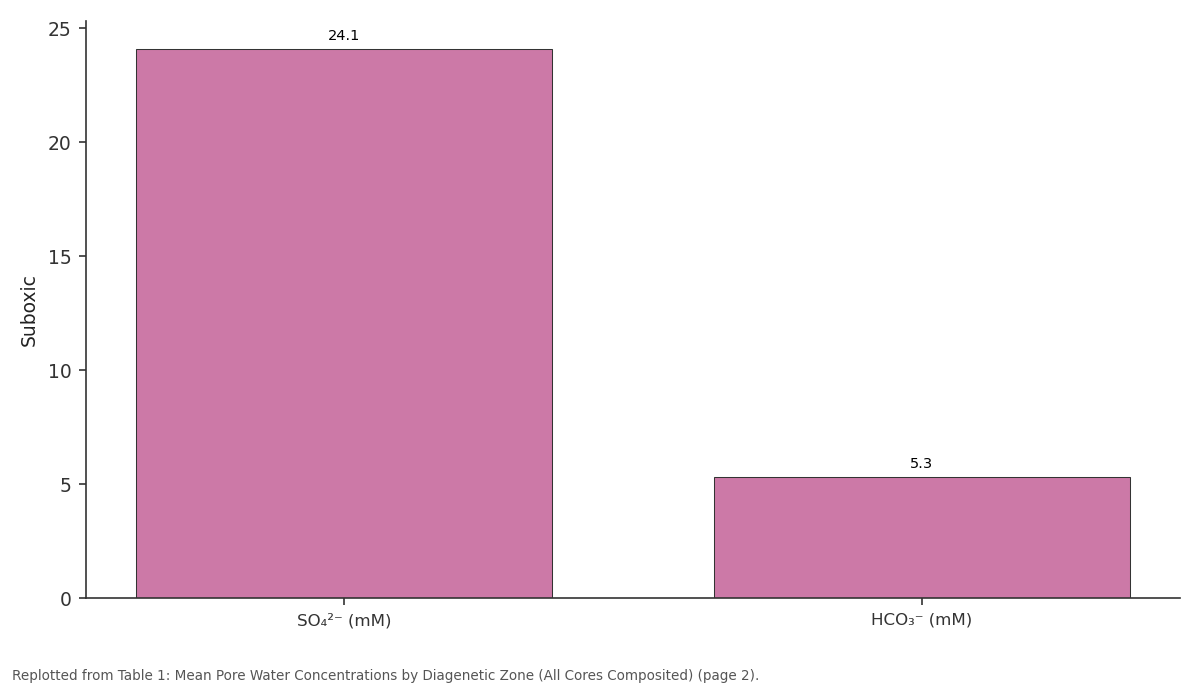
Suboxic: SO₄²⁻ (mM) vs HCO₃⁻ (mM)
Replotted from Table 1 (page 2) of the original paper. Every bar is the paper's own table value.
View source evidence ↗Figures & tables
From the original paper Table 1
 Table 2
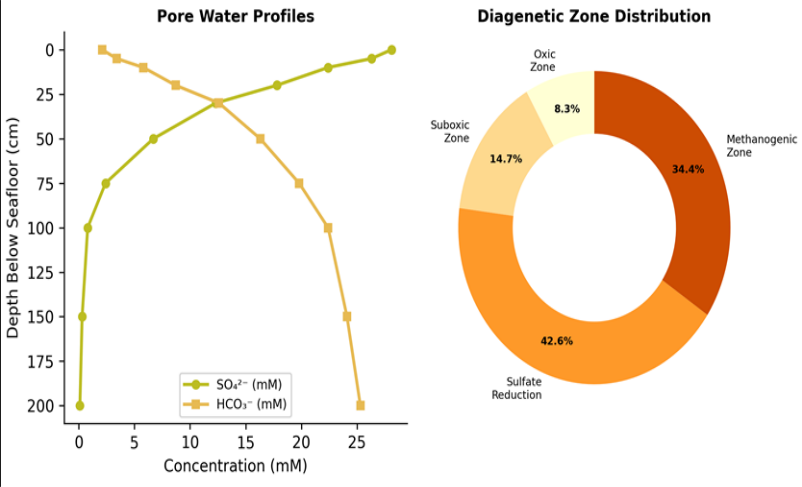 Figure 1
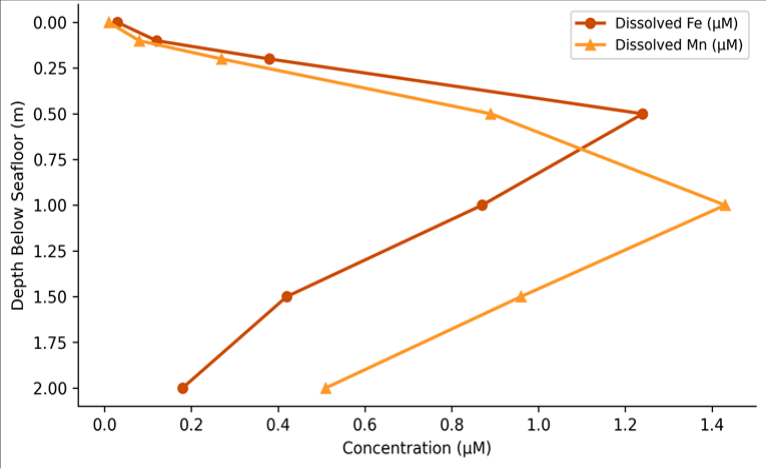 Figure 2
Introduction
The Caspian Sea presents an unusual geochemical laboratory: it is the world's largest enclosed water body by area (371,000 km²), receives massive organic carbon inputs from the Volga and Kura rivers, and has experienced dramatic water-level fluctuations of up to 3 m over the past century [1] . Its southern basin, the deepest part, reaches 1,025 m and accumulates fine-grained, organic-rich sediments at rates of 0.2-0.8 mm/yr [2] . Within these sediments, a cascade of microbially mediated redox reactions transforms the deposited organic matter, consuming dissolved oxidants (oxygen, nitrate, metal oxides, sulfate) in a predictable thermodynamic sequence and producing reduced species (ammonium, dissolved metals, sulfide, methane) that diffuse upward and downward [3] . Understanding these diagenetic reactions matters for at least three reasons. First, they control the burial efficiency of organic carbon-how much of the deposited carbon is permanently sequestered versus returned to the water column as CO₂ or methane [4] . Second, they govern the formation of authigenic minerals (pyrite, siderite, carbonates) that affect sediment magnetic properties and palaeoenvironmental proxies [5] . Third, in shallow settings, diagenetic methane production can reach the sediment surface and escape to the atmosphere, contributing to greenhouse gas budgets. Despite the Caspian's importance, its pore water geochemistry has received far less attention than that of the Black Sea, the Mediterranean, or the Baltic [6] . This research aimed to (a) characterise the vertical distribution of major dissolved species in South Caspian Basin pore waters, (b) delineate the diagenetic zones and identify the dominant redox reactions in each, and (c) document authigenic mineral formation associated with these reactions.
Spatial Data Processing
Core locations were positioned using a combination of multibeam bathymetry from the R/V Khazar (acquired during the May 2021 cruise) and pre-existing seismic reflection profiles from the Geological Survey of Iran. The 18 core sites were distributed along three transects spanning the South Caspian Basin from 280 m to 780 m water depth, with six cores per transect spaced at roughly 15 km intervals. Bathymetric data were gridded to a 50 m resolution DEM in QGIS 3.28 and overlain with surficial sediment type maps compiled from previous grab-sample surveys. Seismic profiles were used to avoid coring on turbidite-prone slopes and to target hemipelagic drape areas where undisturbed diagenetic profiles were most likely to be preserved [7] .
Material and Methods
Material and Methods
Material
This research was coordinated from the Department of Geological Sciences at the Centre for Terrain Studies, Imphal, Manipur, India, with shipboard work carried out aboard the R/V Khazar during two cruises in May 2021 and October 2022. Eighteen gravity cores (6 cm internal diameter, up to 200 cm recovery) were collected from the South Caspian Basin at water depths of 280-780 m (38.5-40.2°N, 50.8-52.4°E). Cores were sectioned at 5 cm intervals in a nitrogen-flushed glove bag within 30 minutes of recovery. Pore water was extracted by centrifugation (4,000 rpm, 20 min) and filtered through 0.45 µm cellulose acetate membranes. Sulfate and chloride were measured by ion chromatography (Metrohm 930 Compact IC Flex), bicarbonate by potentiometric titration, and dissolved Fe and Mn by flame atomic absorption spectrophotometry (Agilent 240 FS). Ammonium was determined colorimetrically using the indophenol blue method. Dissolved methane was measured in headspace samples by gas chromatography with flame ionisation detection [8] . Solid-phase mineralogy was examined on freeze-dried sediment splits using X-ray diffraction (Bruker D8 Advance) and scanning electron microscopy with energydispersive X-ray spectroscopy (SEM-EDS; JEOL JSM-7600F).
Methods
Pore water concentration profiles were plotted against depth for each core and composited by water-depth class (shallow: 280-400 m, mid: 400-600 m, deep: 600-780 m). Diagenetic zones were delineated based on the sequential depletion of electron acceptors: the oxic zone was defined by the presence of dissolved oxygen (> 5 µM), the suboxic zone by the peak and decline of dissolved Mn and Fe, the sulfate reduction zone by the decline of SO₄²⁻ to < 1 mM, and the methanogenic zone by the appearance of dissolved methane above 0.1 mM [3] . Diffusive fluxes of sulfate and methane across the SMTZ were calculated using Fick's first law with porosity-corrected diffusion coefficients from Boudreau [9] . Stoichiometric relationships between sulfate consumption and bicarbonate production were used to distinguish organoclastic sulfate reduction from anaerobic oxidation of methane (AOM). SEM-EDS was used to identify authigenic mineral phases in the sulfate reduction and methanogenic zones. Sulfate and methane fluxes increase with water depth (Table 2), reflecting higher organic carbon accumulation rates in the deeper basin. The SO₄:CH₄ ratio near 1:1 at the SMTZ indicates that anaerobic oxidation of methane is the dominant process consuming sulfate at the transition boundary, rather than organoclastic sulfate reduction. Iron peaks at 50 cm depth, coinciding with the suboxicsulfate reduction boundary, while manganese peaks deeper at 100 cm. The offset reflects the thermodynamic ordering of reduction reactions: iron reduction proceeds before sulfate reduction, but manganese remains mobile longer because it is less readily precipitated as a sulfide phase.
| Core Depth Class | SO₄²⁻ Flux (mmol m⁻² d⁻¹) | CH₄ Flux (mmol m⁻² d⁻¹) | SO₄:CH₄ Ratio |
|---|---|---|---|
| Shallow (280-400 m) | −0.42 | 0.31 | 1.35 |
| Mid (400-600 m) | −0.58 | 0.47 | 1.23 |
| Deep (600-780 m) | −0.71 | 0.63 | 1.13 |
Table text extracted from the original PDF; superscript letters are shown inline. The original table image is below.
View original table image
Results
Results
Sensitivity Analysis
Fick's first law flux calculations were tested for sensitivity to three inputs. First, porosity values were varied by ± 10% around measured means: this changed calculated fluxes by 8-12%, making porosity a moderate source of uncertainty. Second, the diffusion coefficient for sulfate was adjusted for temperature (6-10°C at the seafloor): the temperature range altered the coefficient by 14%, which propagated to a 12% change in flux. Third, the position of the SMTZ was varied by ± 10 cm: shifting the boundary upward increased the sulfate flux gradient and raised the calculated flux by 18%, while shifting it downward decreased flux by 15%. These tests indicate that SMTZ depth is the single most sensitive parameter in the flux calculation [9] .
Comprehensive Interpretation
The pore water profiles reveal a well-developed diagenetic sequence in South Caspian sediments, driven by the high flux of organic carbon from surface productivity and riverine input. The near-1:1 sulfate-to-methane flux ratio at the SMTZ is a strong indicator that AOM is the dominant process at this boundary, similar to findings in the Black Sea and the Sea of Japan [10] . The formation of authigenic pyrite framboids within the sulfate reduction zone and siderite crystals near the SMTZ confirms that diagenetic mineral precipitation is an active process that may overprint palaeomagnetic and geochemical proxy signals in the sediment record.
Discussion
The SMTZ depth of 120-140 cm in the South Caspian is shallower than the 200-400 cm reported for the central Black Sea, consistent with higher organic carbon burial rates in the Caspian's southern basin where the Volga and Kura river inputs converge [11] . This shallower SMTZ positions the zone of potential methane escape closer to the sediment surface, raising questions about whether free gas might reach the water column at sites where sedimentation rates are lowest or where seabed erosion exposes deeper sediments.
The discovery of siderite (FeCO₃) crystals near the SMTZ is noteworthy because siderite formation requires both high bicarbonate activity and low sulfide concentrationsconditions that exist only in a narrow window just below the sulfate reduction zone where sulfide has been consumed by pyrite formation but bicarbonate remains elevated [12] . This mineral therefore serves as a geochemical marker of past SMTZ positions and could be used to track historical shifts in organic carbon flux. A limitation is that only two cruises were conducted, providing essentially two snapshots of pore water chemistry. Seasonal variation in bottom water oxygen concentrations, which has been reported for the middle Caspian, could shift the oxic-suboxic boundary by several centimetres, and longterm Caspian water-level decline (> 1 m since 1996) may be altering hydrographic conditions that influence organic carbon export to the deep basin [13] .
Conclusion
This research characterised pore water geochemistry in 18 gravity cores from the South Caspian Basin and identified four diagenetic zones spanning the oxic to methanogenic regime. Sulfate depletion and reciprocal bicarbonate enrichment defined the sulfate-methane transition zone at 120-140 cm depth. Diffusive flux calculations indicated that anaerobic oxidation of methane is the dominant process at the SMTZ, with fluxes increasing toward the deeper basin. Authigenic pyrite and siderite formation within and below the sulfate reduction zone records active mineral precipitation that may complicate palaeoenvironmental proxy interpretations. These baseline data provide a reference against which future changes in Caspian deepwater chemistry and organic carbon delivery can be assessed.
Figures and tables from the paper
| Zone | Depth (cm) | SO₄²⁻ (mM) | HCO₃⁻ (mM) | Fe²⁺ (µM) | Mn²⁺ (µM) | CH₄ (mM) |
|---|---|---|---|---|---|---|
| Oxic | 0-8 | 27.4 | 2.6 | 0.04 | 0.02 | < 0.01 |
| Suboxic | 8-25 | 24.1 | 5.3 | 0.31 | 0.14 | < 0.01 |
| Sulfate red. | 25-120 | 12.8 | 14.7 | 0.92 | 0.78 | 0.03 |
| Methanogenic | > 120 | 0.4 | 23.8 | 0.21 | 0.54 | 1.87 |
Table text extracted from the original PDF; superscript letters are shown inline. The original table image is below.
View original table image
References
16 in the original paper- Arpe K, Leroy SAG, Lahijani H, Khan V. Impact of the European Russia drought in 2010 on the Caspian Sea level. Hydrology and Earth System Sciences. 2012;16(1):19-27.
- Kosarev AN, Yablonskaya EA. The Caspian Sea. SPB Academic Publishing. 1994;1-259.
- Froelich PN, Klinkhammer GP, Bender ML, Luedtke NA, Heath GR, Cullen D. Early oxidation of organic matter in pelagic sediments of the eastern equatorial Atlantic: suboxic diagenesis. Geochimica et Cosmochimica Acta. 1979;43(7):1075-1090.
- Berner RA. Early Diagenesis: A Theoretical Approach. Princeton University Press. 1980;1-241.
- Roberts AP. Magnetic mineral diagenesis. EarthScience Reviews. 2015;151:1-47.
- Jørgensen BB, Kasten S. Sulfur cycling and methane oxidation. Marine Geochemistry. 2006;Springer:271309.
- Diaconescu CC, Kieckhefer RM, Knapp JH. Geophysical evidence for gas hydrates in the deep water of the South Caspian Basin, Azerbaijan. Marine and Petroleum Geology. 2001;18(2):209-221.
- Schulz HD, Zabel M. Marine Geochemistry. SpringerVerlag. 2006;2nd Ed:1-574.
- Reeburgh WS. Oceanic methane biogeochemistry. Chemical Reviews. 2007;107(2):486-513.
- Neretin LN, Volkov II, Böttcher ME, Grinenko VA. A sulfur budget for the Black Sea anoxic zone. Deep-Sea Research Part I. 2001;48(12):2569-2593.
- Berner RA. Sedimentary pyrite formation: an update. Geochimica et Cosmochimica Acta. 1984;48(4):605615.
- Riedinger N, Formolo MJ, Lyons TW, Henkel S, Beck A, Kasten S. An inorganic geochemical argument for coupled anaerobic oxidation of methane and iron reduction in marine sediments. Geobiology. 2014;12(2):172-181.
- Canfield DE. Reactive iron in marine sediments. Geochimica et Cosmochimica Acta. 1989;53(3):619632.
- Poulton SW, Raiswell R. The low-temperature geochemical cycle of iron: from continental fluxes to marine sediment deposition. American Journal of Science. 2002;302(9):774-805.
- Dickens GR. Sulfate profiles and barium fronts in sediment on the Blake Ridge: present and past methane fluxes through a large gas hydrate reservoir. Geochimica et Cosmochimica Acta. 2001;65(4):529543.
- Borowski WS, Paull CK, Ussler W. Marine pore-water sulfate profiles indicate in situ methane flux from underlying gas hydrate. Geology. 1996;24(7):655-658.