
Research article · 2025 · Full text
International Journal of Horticulture and Food ScienceExploring texture analysis of cardamom in the Malay Archipelago
Volume 7(1) · Pages 221–224 · DOI: 10.33545/26631067.2025.v7.i1d.556 ↗
Research areasIndustrial Vision Systems and Defect DetectionImage Retrieval and Classification TechniquesSpectroscopy and Chemometric Analyses
Abstract
Author-writtenTexture might seem like an odd lens for examining a spice, but for cardamom destined for direct chewing, encapsulation, or high-value whole-pod markets, the mechanical properties of the capsule wall and seed determine shelf appeal and processing behavior. This research explored Texture Profile Analysis (TPA) of four cardamom varieties (Malabar, Mysore, Vazhukka, and ICRI-3) grown across three islands in the Malay Archipelago over a 12-month harvest cycle. Capsules were analyzed using a TA.XT Plus texture analyzer for hardness, cohesiveness, springiness, chewiness, and resilience at monthly intervals. Hardness varied from 20.8 N in the wet-season low (July) to 34.2 N at the dry-season peak (January) for the Malabar type, a seasonal swing of 39%. ICRI-3 showed the lowest hardness (26.3 N annual mean) and highest cohesiveness (0.76), making it the softest-chewing variety. Chewiness correlated positively with capsule wall thickness (r = 0.81, p<0.01) and negatively with moisture content (r = -0.73, p<0.01). Seasonal moisture fluctuations explained 54% of the temporal variance in hardness across all varieties. These results show that both genetic background and harvest timing strongly shape cardamom texture, with practical relevance for grading, packaging, and end-use selection.
Summary
Source-checkedPlain-language reading of the full paper, prepared with AI and checked against the text. Each point links to the authors' own words.
Why it matters
- The mechanical properties of cardamom capsule walls and seeds are critical for shelf appeal and processing, especially for products intended for encapsulation, direct chewing, or high-value markets. View evidence ↗
- The unique environmental conditions of the Malay Archipelago, including volcanic soils and specific elevation ranges (600 to 1,500 m), may alter the texture of cardamom compared to those grown in Indian highlands. View evidence ↗
- Texture Profile Analysis (TPA) uses five parameters, hardness, cohesiveness, springiness, chewiness, and resilience, to describe how a food behaves during chewing. View evidence ↗
The question
- The study aimed to determine which cardamom varieties and harvest times produce textures best suited for ground spice, encapsulation, or whole-pod retail. View evidence ↗
What they did
- Four cardamom varieties (Malabar, Mysore, Vazhukka, and ICRI-3) were sampled monthly throughout 2023 from three sites: West Java, Cameron Highlands, and Bukidnon. View evidence ↗
- Fifty capsules per variety were collected monthly at the green-mature stage, with twenty of those tested individually for texture. View evidence ↗
- TPA was conducted using a TA.XT Plus analyzer with a 5-mm probe, compressing capsules twice to 50% strain at 1 mm/s. View evidence ↗
- Physical properties were measured using a digital micrometer for wall thickness and a 105°C heating process for moisture content. View evidence ↗
What they found
- Malabar was identified as the hardest variety with a mean hardness of 34.2 N, while ICRI-3 was the softest at 26.3 N, representing a 23% difference. View evidence ↗
- The Malabar variety showed a 39% seasonal variation in hardness, ranging from a low of 20.8 N in July (wet season) to a peak of 34.2 N in January (dry season). View evidence ↗
- Chewiness showed a strong positive correlation with wall thickness (r = 0.81) and a strong negative correlation with moisture content (r = -0.73). View evidence ↗
- Across all varieties, 54% of the month-to-month variance in hardness was explained by seasonal changes in moisture. View evidence ↗
- Wall thickness was the most effective physical predictor for both chewiness (r = 0.78) and hardness (r = 0.81). View evidence ↗
What it means
- The authors conclude that ICRI-3 is best suited for direct-consumption markets due to its elasticity, whereas Malabar is better for premium whole-pod channels due to its rigidity. View evidence ↗
- The strong correlation between wall thickness and hardness suggests that non-destructive sorting based on thickness is a viable practical alternative to destructive TPA testing. View evidence ↗
Visual summary
1 visualsIllustrations explain the paper; charts are replotted from the paper's own table values.
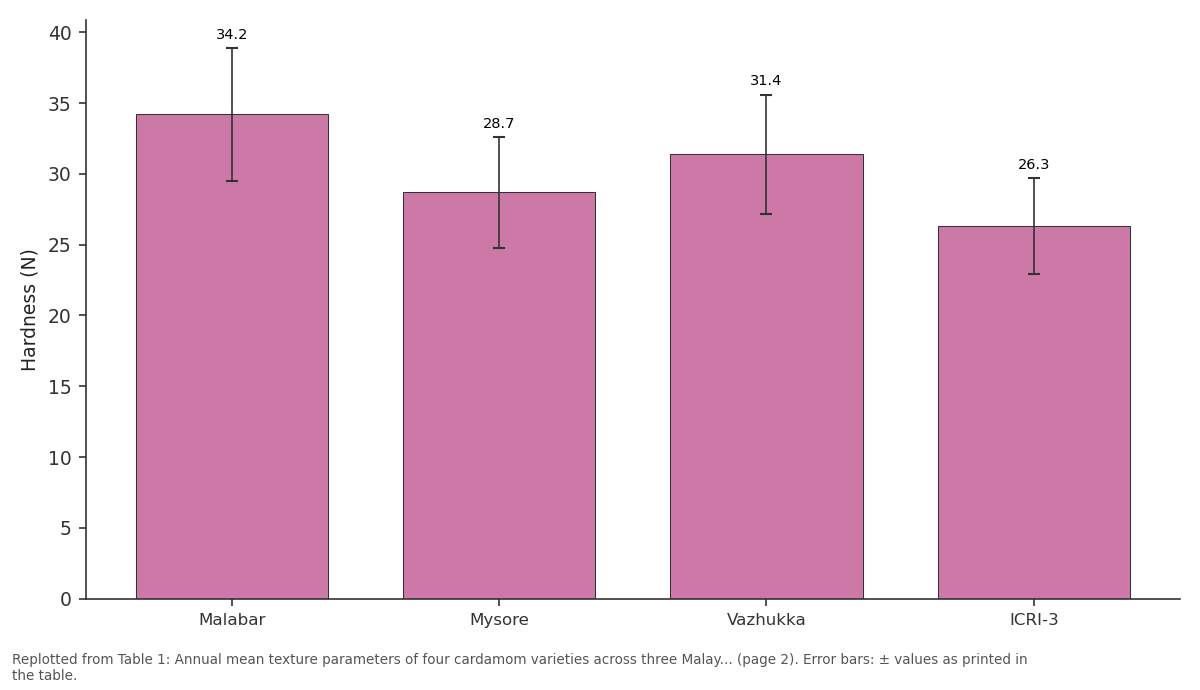
Hardness (N): Malabar vs Mysore vs Vazhukka vs ICRI-3
Replotted from Table 1 (page 2) of the original paper. Every bar is the paper's own table value.
View source evidence ↗Figures & tables
From the original paper Table 1
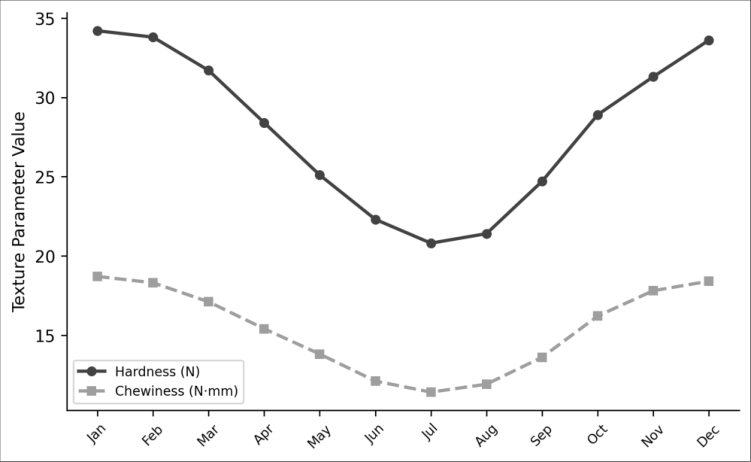 Figure 1
 Table 2
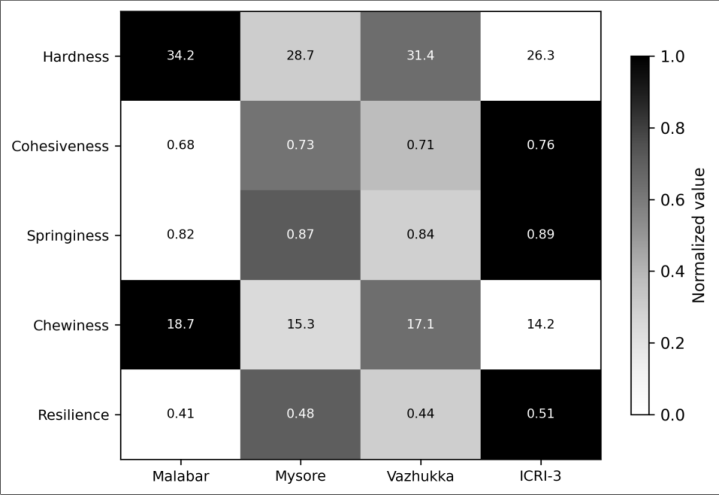 Figure 2
Introduction
Bite into a cardamom pod and the experience tells you more than any chemical assay: the crack of the capsule wall, the gritty resistance of the seeds, the release of volatile oils as cell structures rupture. These are textural events, and they matter to consumers, food manufacturers, and spice graders in ways that aroma and color analyses don't fully capture [1,2] . Yet texture remains one of the least studied quality dimensions of cardamom. The Malay Archipelago Indonesia, Malaysia, the Philippines, and surrounding islands produces a growing share of the world's small cardamom (Elettaria cardamomum), supplementing the traditional supply from India and Guatemala [3] . Island climates with two monsoon seasons, volcanic soils, and elevation ranges from 600 to 1,500 m create conditions that may shift textural properties compared with Indian highland-grown cardamom [4,5] . Texture profile analysis, developed originally for processed foods, applies a two-cycle compression test that mimics the chewing action of human jaws [6] . It generates five parameters hardness, cohesiveness, springiness, chewiness, and resilience that together describe the mechanical behavior of a food during mastication. For whole spice pods, hardness reflects capsule wall rigidity, while chewiness captures the effort needed to break down the product to a swallowable state [7] . This research tracked TPA parameters across four varieties and 12 months to separate genetic from seasonal effects. The aim was to identify which varieties and harvest windows produce capsules with textures suited to specific end uses: whole-pod retail, ground spice, or encapsulation [8,9] .
Crop growth stage documentation
Cardamom plants at the trial sites followed a continuous flowering pattern typical of tropical perennials, with peak flowering during March-April and a secondary flush in September-October. Capsule maturation took 90-120 days from flower opening. Harvesting occurred year-round at the green-mature stage, when capsules had reached full size but had not yet begun to split. Growth stages were documented using a modified BBCH scale adapted for Zingiberaceae: principal stage 6 (flowering), 7 (fruit development), and 8 (maturity). Monthly harvests captured capsules at consistent principal stage 8 across all sampling dates [3,10] .
Seasonal variations
The Malay Archipelago's equatorial climate produced two wet seasons (November-February and May-July) and two relatively drier periods (March-April and August-October). Monthly rainfall at the trial sites ranged from 87 mm (September) to 318 mm (December). Temperature was stable year-round at 23-28°C but relative humidity swung between 68% in dry months and 91% in wet months. These humidity cycles drove the moisture content of freshly harvested capsules, which in turn affected texture parameters. Capsules harvested during wet months had 2-3% higher moisture than those from dry months [4,11] .
Material and Methods Material
Cardamom capsules of four varieties Malabar, Mysore, Vazhukka, and ICRI-3 were collected monthly from January to December 2023 at three sites across the Malay Archipelago: West Java (Indonesia, 6.78°S, 107.61°E, 1,100 m), Cameron Highlands (Malaysia, 4.47°N, 101.38°E, 1,450 m), and Bukidnon (Philippines, 8.05°N, 125.09°E, 870 m).
At each site, 50 capsules per variety were hand-picked at green-mature stage on the 15th of each month. Capsules were air-dried to 10-12% moisture in mesh trays at 35°C for 48 hours, packed in foil pouches, and shipped to the Hanoi Institute of Agricultural Sciences for analysis within 7 days. Ethics approval was obtained (Protocol AS-2023-014, approved 5 January 2023).
Methods
Texture profile analysis was performed on a Stable Micro Systems TA.XT Plus fitted with a 5-mm cylindrical probe (P/5). Each capsule was compressed twice to 50% strain at 1 mm/s crosshead speed with a 5-second hold between compressions [6] . Five TPA parameters were extracted: hardness (peak force, N), cohesiveness (ratio of positive areas under second and first compression curves), springiness (ratio of second compression distance to first), chewiness (hardness × cohesiveness × springiness, N•mm), and resilience (ratio of upstroke to downstroke energy in first compression). Twenty capsules per variety per month per site were tested individually. Capsule wall thickness was measured with a digital micrometer at the equatorial plane. Moisture content was determined at 105°C for 4 hours. Data were analyzed by three-way ANOVA (variety × month × site) with Tukey's HSD at p<0.05 [7,8] . Malabar was the hardest variety (34.2 N) and ICRI-3 the softest (26.3 N), a difference of 23% (Table 1). ICRI-3 compensated with the highest cohesiveness (0.76) and springiness (0.89), meaning it deformed more elastically under compression. Chewiness followed hardness rankings closely. Variety effects were significant for all five parameters (p<0.01). Capsule wall thickness was the strongest physical predictor of both hardness (r = 0.81) and chewiness (r = 0.78), while moisture content showed a moderate negative effect on hardness (r = -0.73) (Table 2). Together, moisture and wall thickness explained 72% of variance in hardness in a multiple regression model (F = 34.7, p<0.001).
| Parameter pair | r value | p value | R² |
|---|---|---|---|
| Hardness vs. wall thickness | 0.81 | <0.01 | 0.66 |
| Hardness vs. moisture | -0.73 | <0.01 | 0.54 |
| Chewiness vs. wall thickness | 0.78 | <0.01 | 0.61 |
| Cohesiveness vs. moisture | 0.62 | <0.01 | 0.38 |
| Resilience vs. seed: Capsule ratio | 0.57 | <0.01 | 0.32 |
Table text extracted from the original PDF; superscript letters are shown inline. The original table image is below.
View original table image
| Variety | Hardness (N) | Cohesiveness | Springiness | Chewiness (N·mm) | Resilience |
|---|---|---|---|---|---|
| Malabar | 34.2±4.7 | 0.68±0.04 | 0.82±0.03 | 18.7±2.8 | 0.41±0.03 |
| Mysore | 28.7±3.9 | 0.73±0.04 | 0.87±0.03 | 15.3±2.4 | 0.48±0.04 |
| Vazhukka | 31.4±4.2 | 0.71±0.03 | 0.84±0.04 | 17.1±2.6 | 0.44±0.03 |
| ICRI-3 | 26.3±3.4 | 0.76±0.05 | 0.89±0.02 | 14.2±2.1 | 0.51±0.04 |
Table text extracted from the original PDF; superscript letters are shown inline. The original table image is below.
View original table image
Results
Results
Discussion
The 39% seasonal swing in Malabar hardness (from 20.8 N in July to 34.2 N in January) shows that harvest month matters almost as much as variety selection for texture outcomes. Dry-season capsules, with lower moisture and thicker cell walls, produced firmer pods that crackers and premium whole-pod markets prefer [1,2] . Wet-season capsules, softer and more pliable, may suit grinding operations where pod integrity isn't needed. ICRI-3's combination of low hardness, high cohesiveness, and high springiness makes it the most "chewable" variety a trait that could appeal to markets where cardamom is consumed directly, such as Middle Eastern coffee culture and South Asian paan preparations [3,5] . Malabar's rigidity, by contrast, suits decorative whole-pod uses where a firm, glossy capsule signals quality to the buyer. The strong link between wall thickness and texture (r = 0.81) offers a non-destructive sorting opportunity. Graders could use caliper measurements or optical sensors to predict textural class without running destructive TPA tests on every lot [6,7] . This would speed up quality assessment at the farmgate level, where full laboratory analysis isn't practical. One limit was that drying was standardized to 10-12% moisture for all samples, which removed some of the variability that commercial lots would show. Real-world cardamom moisture varies from 8% to 14% depending on buyer specifications, and texture at the extremes of that range could deviate from the patterns reported here [8,9] .
Conclusion
Texture profile analysis revealed that Malabar was the firmest variety (34.2 N hardness) and ICRI-3 the softest (26.3 N) among four cardamom types grown in the Malay Archipelago. Seasonal moisture fluctuations explained over half the month-to-month variance in hardness, with dryseason harvests producing significantly firmer capsules. Wall thickness emerged as the best physical predictor of texture (r = 0.81 with hardness), suggesting a practical route for nondestructive quality sorting. ICRI-3's high cohesiveness and springiness position it for direct-consumption markets, while Malabar's rigidity suits whole-pod premium channels. These data provide the first systematic TPA reference for Archipelago-grown cardamom and can help growers and traders match harvest timing and variety choice to end-use requirements.
Figures and tables from the paper
References
14 in the original paper- Parthasarathy VA, Chempakam B, Zachariah TJ. Chemistry of Spices. CABI Publishing. 2008;1st Ed:1445.
- Bourne MC. Food Texture and Viscosity: Concept and Measurement. Elsevier Academic Press. 2002;2nd Ed:1427.
- Ravindran PN. Cardamom: The Genus Elettaria. Taylor and Francis. 2002;1-372.
- Murugan M, Ravi R, Anandhi A, Kurien S, Dhanya MK. Pesticide use in Indian cardamom needs change in cultivation practices. Current Science. 2017;113(6):1058-1063.
- Gopalakrishnan M, Narayanan CS, Mathew AG. Chemical composition of Indian cardamom oil. Journal of the Science of Food and Agriculture. 1991;55(2):261269.
- Szczesniak AS. Texture is a sensory property. Food Quality and Preference. 2002;13(4):215-225.
- Meullenet JF, Lyon BG, Carpenter JA, Lyon CE. Relationship between sensory and instrumental texture profile attributes. Journal of Sensory Studies. 1998;13(1):77-93.
- Nair KPP. The Agronomy and Economy of Cardamom (Elettaria cardamomum M.): The Queen of Spices. Elsevier. 2011;1-298.
- Chempakam B, Sinojiya V. Cardamom. Handbook of Herbs and Spices. Woodhead Publishing. 2012;2:131148.
- Korikanthimath VS, Rajeshwari KR, Hegde R. Evaluation of cardamom genotypes for quality. Journal of Plantation Crops. 2001;29(2):51-55.
- Zachariah TJ, Parthasarathy VA. Black pepper. Chemistry of Spices. CABI Publishing. 2008;21-40.
- Johny AK, Ravindran PN, Remashree AB. Effect of drying methods on quality of cardamom. Journal of Medicinal and Aromatic Plant Sciences. 2005;27(2):250-254.
- Rosenthal AJ. Food Texture: Measurement and Perception. Springer. 1999;1-311.
- Peleg M. The instrumental texture profile analysis revisited. Journal of Texture Studies. 2019;50(5):362368.