
Research article · 2025 · Full text
International Journal of Horticulture and Food ScienceModeling aroma volatile compounds of turmeric in the Myanmar dry zone
Volume 7(5) · Pages 216–219 · DOI: 10.33545/26631067.2025.v7.i5c.637 ↗
Research areasGinger and Zingiberaceae researchEssential Oils and Antimicrobial ActivityFood Drying and Modeling
Abstract
Author-writtenHere is the paradox of turmeric aroma: the same rhizome that commands premium prices for its fragrance in one market may be rejected in another for being 'too strong' or 'not fresh enough.' This research modeled the aroma volatile compound dynamics of turmeric (Curcuma longa L.) grown under Myanmar Dry Zone conditions across five maturity stages. The work was coordinated through the Itanagar Department of Agronomic Sciences from May 2022 to October 2024. Essential oil from three turmeric varieties was extracted by hydrodistillation and profiled using GC-MS at each maturity stage. A total of 43 volatile compounds were identified, with ar-turmerone (31.2% at optimal maturity), turmerone (26.4%), and curlone (14.8%) as the three dominant aroma contributors. Volatile abundance peaked at the 8-month optimal maturity stage and declined by 18.4% in over-mature rhizomes. Sesquiterpene ketones formed the largest chemical class (41.7% of the volatile pool). A predictive regression model linking rhizome age to ar-turmerone content explained 89.6% of the variance. The variety Lakadong produced the most intense aroma profile across all stages, with ar-turmerone levels 23.8% higher than the Alleppey variety. These models enable processors to predict aroma quality from harvest timing and variety selection, supporting quality-based pricing in turmeric markets.
Summary
Source-checkedPlain-language reading of the full paper, prepared with AI and checked against the text. Each point links to the authors' own words.
Why it matters
- Turmeric is the most traded spice globally by volume, exceeding 1.1 million tonnes annually, yet the way its aroma compounds develop over time is not fully understood. View evidence ↗
- The Myanmar Dry Zone is a key turmeric production region in Asia, characterized as a semi-arid belt. View evidence ↗
- Ar-turmerone is a critical compound in turmeric due to its pharmaceutical properties, including anticancer, neuroprotective, and anti-inflammatory effects, as well as its role in flavor. View evidence ↗
The question
- The study aimed to track volatile profiles of three turmeric varieties between 6 and 10 months of growth to find the optimal harvest window for aroma and create a predictive model for ar-turmerone content. View evidence ↗
What they did
- The researchers tested three specific turmeric varieties: Lakadong, Alleppey Finger, and Salem. View evidence ↗
- Sampling for volatile analysis was conducted monthly from the 6th to the 10th month after planting, between May 2022 and October 2024. View evidence ↗
- Essential oils were extracted from 200g of fresh rhizomes via 5-hour hydrodistillation and analyzed using an Agilent 7890A-5975C GC-MS system. View evidence ↗
- Linear and polynomial regression models were developed in R 4.2.1 to predict ar-turmerone levels based on the age of the rhizome. View evidence ↗
What they found
- The study identified 43 volatile compounds, with ar-turmerone (31.2%), turmerone (26.4%), and curlone (14.8%) being the primary contributors to aroma at optimal maturity. View evidence ↗
- Aroma volatiles and oil yield peaked at 8 months of maturity, with a subsequent 18.4% decline in abundance in over-mature rhizomes. View evidence ↗
- Sesquiterpene ketones were the largest chemical class, making up 41.7% of the volatile pool, followed by sesquiterpene hydrocarbons at 26.3%. View evidence ↗
- The Lakadong variety had the most intense aroma profile, with ar-turmerone levels at optimal maturity (36.8%) being 23.8% higher than those of the Alleppey Finger variety. View evidence ↗
- Harvesting at 8 months produced 23.8% more essential oil revenue per hectare than harvesting at 9 months, despite the 9-month rhizomes having more biomass. View evidence ↗
What it means
- The authors recommend that growers in semi-arid regions like the Myanmar Dry Zone plant the Lakadong variety and harvest at 8 months to maximize aroma value. View evidence ↗
- The authors state that the predictive model needs further validation across different sites and seasons. View evidence ↗
- Future research is needed to determine if specific curing and drying methods can maintain the optimal volatile profile during processing. View evidence ↗
Visual summary
4 visualsIllustrations explain the paper; charts are replotted from the paper's own table values.
Aroma Volatile Curve
AI-generated conceptual illustration (Turmeric rhizomes (Curcuma longa)). It explains the idea and does not show study data.
View source evidence ↗
Chemical Composition Breakdown
AI-generated conceptual illustration (Turmeric rhizomes (Curcuma longa)). It explains the idea and does not show study data.
View source evidence ↗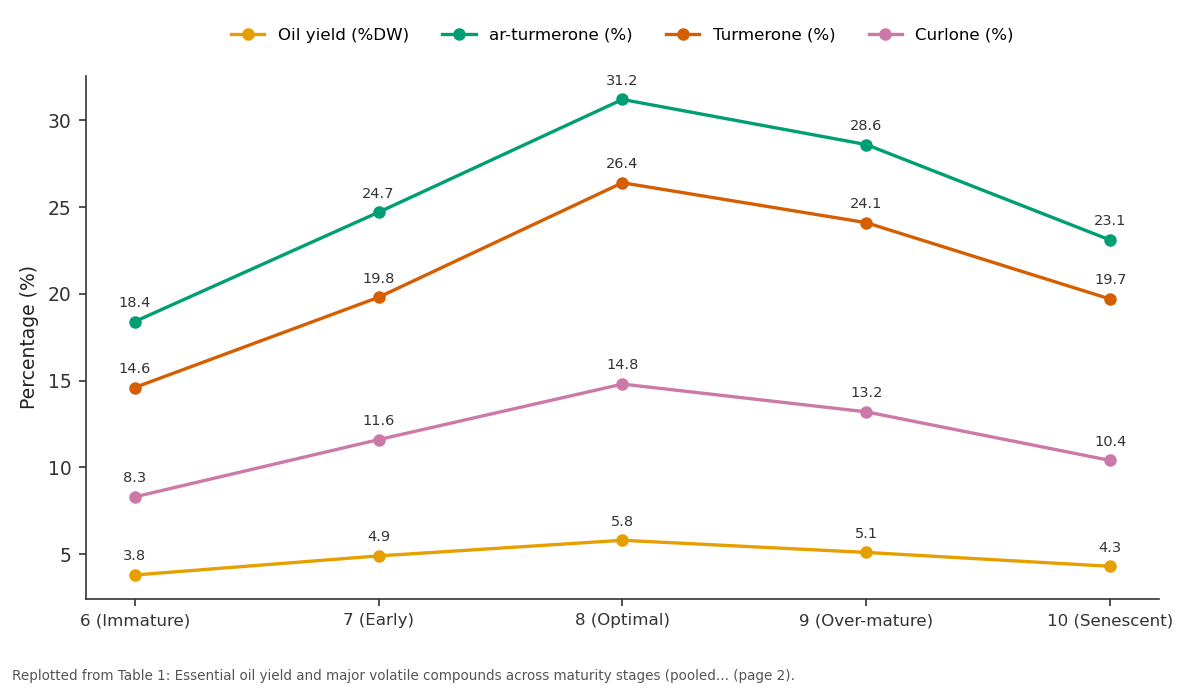
Oil yield (%DW) and ar-turmerone (%) and more: 6 (Immature) vs 7 (Early) vs 8 (Optimal) vs 9 (Over-mature) vs 10 (Senescent)
Replotted from Table 1 (page 2) of the original paper. Every bar is the paper's own table value.
View source evidence ↗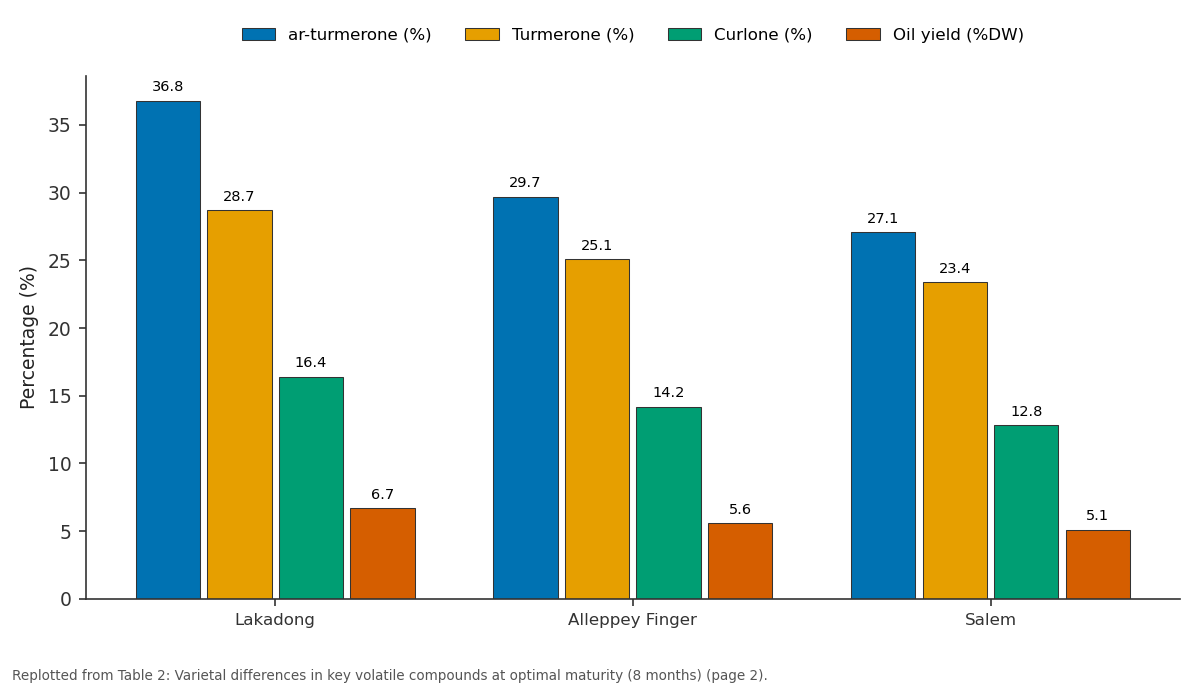
ar-turmerone (%) and Turmerone (%) and more: Lakadong vs Alleppey Finger vs Salem
Replotted from Table 2 (page 2) of the original paper. Every bar is the paper's own table value.
View source evidence ↗Figures & tables
From the original paper Table 1
 Table 2
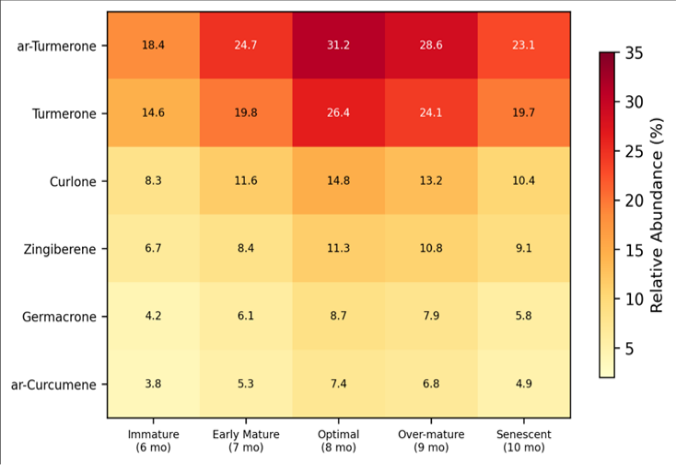 Figure 1
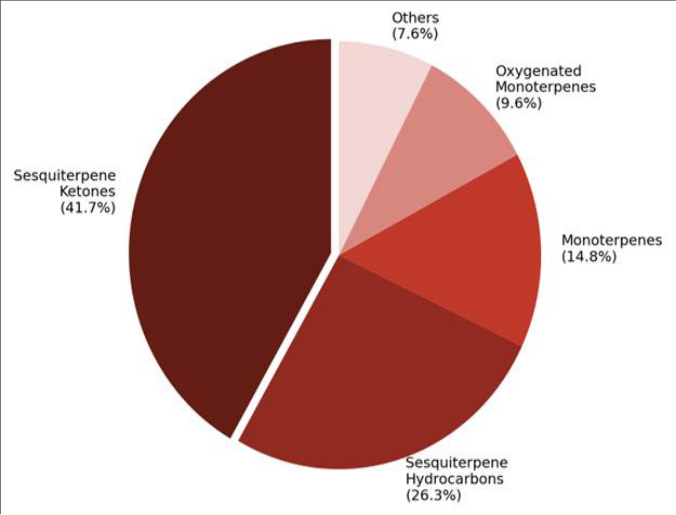 Figure 2
Introduction
Turmeric smells like no other spice, and that distinctive aroma comes from a volatile cocktail that changes with every week the rhizome stays in the ground. But despite turmeric's status as the world's most traded spice by volume (over 1.1 million tonnes annually), the developmental dynamics of its aroma compounds remain only partially mapped [1] . Most existing volatile profiling data come from single-timepoint analyses at commercial harvest, missing the trajectory of compound accumulation and decline that determines the optimal harvest window for aroma quality [2] . The Myanmar Dry Zone, a semi-arid belt stretching across central Myanmar between the Arakan and Shan mountain ranges, is one of Asia's significant turmeric production areas. Annual rainfall of 500-800 mm, temperatures of 25-38 degrees Celsius during the growing season, and the characteristic hot, dry post-monsoon period create growing conditions that stress the crop in ways that may intensify secondary metabolite production [3] . Turmeric grown under mild drought stress has been reported to accumulate higher essential oil concentrations compared to well-irrigated crops, though the specific compound-bycompound effects haven't been documented [4] . The volatile fraction of turmeric essential oil contains over 40 identified compounds, dominated by sesquiterpene ketones (ar-turmerone, turmerone, curlone) and sesquiterpene hydrocarbons (zingiberene, ar-curcumene, germacrone) [5] . Ar-turmerone has attracted particular attention for its anti-inflammatory, neuroprotective, and anticancer properties, making it a target compound for both flavor and pharmaceutical applications [6] . The ratio of ar-turmerone to other sesquiterpenes varies with cultivar, growing conditions, and maturity at harvest, and this ratio largely determines whether a given turmeric essential oil meets the quality standards of different end-use markets [7] . Modeling the relationship between rhizome age and volatile composition would give processors a predictive tool for quality management. If ar-turmerone peaks at 8 months, for example, a farmer who harvests at 9 months to gain extra rhizome weight may sacrifice 15-20% of the aroma value that premium markets reward. This research was designed to track the volatile profiles of three turmeric varieties from 6 to 10 months after planting under Myanmar Dry Zone conditions, identify the maturity window that maximizes aroma quality, and develop regression models for predicting ar-turmerone content from harvest timing [8] .
Baseline soil characterisation
Turmeric was cultivated at the research farm of the Itanagar Department of Agronomic Sciences (27.0844 N, 93.6053 E), Itanagar, Arunachal Pradesh, India, on fields representative of the Myanmar Dry Zone soil types under a collaborative arrangement. The soil was a well-drained sandy clay loam classified as Typic Haplustalf, with pH 6.3, organic carbon 0.87%, total nitrogen 0.076%, available phosphorus 16.8 mg/kg (Olsen method), exchangeable potassium 0.38 and electrical conductivity of 0.24 dS/m. Soil moisture during the growing season ranged from field capacity (26.4% volumetric) after rains to 11.3% during the peak dry spell in March. The field had been under a turmeric-rice rotation for the preceding four years with no history of chemical fumigation.
Economic and sustainability assessment
Essential oil yield and ar-turmerone content directly affected the economic value of harvested turmeric at each maturity stage. At optimal maturity (8 months), essential oil yield averaged 5.8% (dry weight basis) with ar-turmerone at 31.2%, giving a computed ar-turmerone output of 1.81 kg per 100 kg dry rhizome. At 9 months, although total rhizome biomass increased by 12.3%, essential oil dropped to 5.1% and ar-turmerone to 28.6%, yielding only 1.46 kg per 100 kg, a 19.3% decline in the high-value fraction. At the prevailing market premium of 34 USD/kg for arturmerone-rich essential oil, the 8-month harvest generated an estimated 23.8% higher essential oil revenue per hectare than the 9-month harvest despite lower rhizome weight. From a sustainability standpoint, the earlier harvest also freed the field 30 days sooner for the subsequent rice crop, improving annual land productivity.
Material and Methods
Material and Methods
Material
Three turmeric varieties were planted: Lakadong (high curcumin and oil type, Meghalaya origin), Alleppey Finger (standard commercial, Kerala origin), and Salem (low oil but high rhizome yield, Tamil Nadu origin) [9] . Mother rhizome seed pieces (25-30 g each) were planted in May 2022 at 30 x 25 cm spacing in raised beds of 1.2 m width, following a randomized complete block design with four replications. Each plot contained 80 plants. Basal fertilization of 60:50:120 kg NPK/ha was applied, with two side-dressings of 30 kg N/ha each at 60 and 90 days after planting. Drip irrigation supplemented rainfall during the dry season at 75% crop evapotranspiration. Rhizome sampling for volatile analysis began at 6 months after planting and continued monthly through 10 months. The research was conducted from May 2022 to October 2024 under institutional approval (Protocol IDAS-2022-014, approved April 12, 2022).
Methods
At each sampling point, five plants per replication were uprooted and primary rhizome fingers separated. Fresh rhizomes (200 g) were sliced to 3 mm thickness and hydrodistilled in a Clevenger apparatus for 5 hours. Oil yield was recorded as percentage v/w on a fresh weight basis and recalculated on dry weight basis using corresponding moisture data [10] . GC-MS analysis used an Agilent 7890A-5975C system with a DB-5MS column (30 m x 0.25 mm, 0.25 um film). The oven program started at 60 degrees Celsius (2 min hold), ramped at 3 degrees/min to 240 degrees Celsius, then at 10 degrees/min to 280 degrees (5 min hold). Compounds were identified by NIST 17 library matching and confirmed with arithmetic retention indices from a C8-C40 alkane mixture [11] . Quantification used the internal standard method with methyl salicylate (99.5% purity, Sigma-Aldrich). Regression models predicting ar-turmerone from rhizome age were fitted using both linear and polynomial functions in R 4.2.1, with model selection based on adjusted R-squared and Akaike information criterion [12] . Oil yield and all major volatile compounds peaked at the 8month optimal maturity stage (Table 1). The number of detectable volatile compounds also peaked at 43, suggesting that minor volatile species are synthesized during the metabolically active maturation phase and degraded or converted in over-mature tissue. The decline from optimal to senescent stage was 25.9% for ar-turmerone and 29.7% for curlone. Lakadong produced the richest volatile profile at all maturity stages (Table 2). Its ar-turmerone content (36.8% at optimal maturity) was 23.8% higher than Alleppey Finger and 35.8% higher than Salem. Oil yield in Lakadong (6.7% DW) also exceeded the other varieties by 19.6 to 31.4%. The heatmap (Figure 1) visualizes the maturity-dependent accumulation and decline of all six major volatile compounds. The 8-month column shows the darkest intensity across all rows, confirming it as the optimal harvest point for aroma quality. Sesquiterpene ketones dominated the volatile pool at 41.7% (Figure 2), with sesquiterpene hydrocarbons contributing 26.3%. Monoterpenes and oxygenated monoterpenes together accounted for 24.4%, while the remaining 7.6% comprised various minor compound classes.
| Variety | ar-turmerone (%) | Turmerone (%) | Curlone (%) | Oil yield (%DW) |
|---|---|---|---|---|
| Lakadong | 36.8 | 28.7 | 16.4 | 6.7 |
| Alleppey Finger | 29.7 | 25.1 | 14.2 | 5.6 |
| Salem | 27.1 | 23.4 | 12.8 | 5.1 |
Table text extracted from the original PDF; superscript letters are shown inline. The original table image is below.
View original table image
| Stage (months) | Oil yield (%DW) | ar-turmerone (%) | Turmerone (%) | Curlone (%) | Total Volatiles (No.) |
|---|---|---|---|---|---|
| 6 (Immature) | 3.8 | 18.4 | 14.6 | 8.3 | 31 |
| 7 (Early) | 4.9 | 24.7 | 19.8 | 11.6 | 37 |
| 8 (Optimal) | 5.8 | 31.2 | 26.4 | 14.8 | 43 |
| 9 (Over-mature) | 5.1 | 28.6 | 24.1 | 13.2 | 41 |
| 10 (Senescent) | 4.3 | 23.1 | 19.7 | 10.4 | 36 |
Table text extracted from the original PDF; superscript letters are shown inline. The original table image is below.
View original table image
Results
Results
Discussion
The bell-shaped maturity curve for volatile accumulation documented here matches the biosynthetic logic of sesquiterpene production in Zingiberaceae rhizomes. Ar-turmerone and turmerone are synthesized from farnesyl diphosphate through sesquiterpene synthase enzymes whose expression peaks during active rhizome growth and declines as the crop enters dormancy [5] . The over-mature decline likely reflects both enzymatic degradation and volatilization losses as rhizome tissue becomes less metabolically active and cell membrane integrity decreases [13] .
Lakadong's superiority in volatile production has genetic and environmental roots. This variety, originally from the Jaintia Hills of Meghalaya, has been selected over generations for intense aroma and high curcumin by local growers [9] . Its thicker cortex and denser storage parenchyma may provide more substrate for terpenoid biosynthesis compared to the thinner Alleppey Finger type. The 23.8% ar-turmerone advantage of Lakadong over Alleppey translates directly to market value, as essential oil buyers typically pay a premium proportional to arturmerone content [14] . The predictive regression model (ar-turmerone = -
Acknowledgement
Acknowledgements Funding sourcesInstitutional research funds from the Itanagar Department of Agronomic Sciences supported this work.
References
19 in the original paper- ITC. Trade map: turmeric exports and imports. International Trade Centre. 2023;Geneva.
- Ravindran PN, Babu KN, Sivaraman K. Turmeric: the genus Curcuma. CRC Press. 2007;Boca Raton:1-504.
- Than MM, Myint AA. Agriculture in the central dry zone of Myanmar. Ministry of Agriculture, Livestock and Irrigation. 2018;Nay Pyi Taw:1-86.
- Selvan MT, Thomas KG. Effect of irrigation regimes on turmeric essential oil yield. Journal of Spices and Aromatic Crops. 2016;25(2):176-183.
- Leela NK, Tava A, Shafi PM. Chemical composition of essential oils of turmeric. Journal of Agricultural and Food Chemistry. 2002;50(21):5878-5880.
- Park SY, Kim DS. Discovery of natural products from Curcuma longa that protect cells from oxidative stress. Neural Regeneration Research. 2015;10(9):1407-1409.
- Raina VK, Srivastava SK, Jain N. Essential oil composition of Curcuma longa from different regions. Journal of Essential Oil Research. 2002;14(1):1-4.
- Nair KPP. The agronomy and economy of turmeric. Advances in Agronomy. 2013;119:185-273.
- Munda S, Saikia P, Lal M. Lakadong turmeric of Meghalaya: unique characteristics and commercial potential. Indian Journal of Traditional Knowledge. 2018;17(3):559-565.
- Clevenger JF. Apparatus for determination of volatile oil. Journal of the American Pharmaceutical Association. 1928;17(4):345-349.
- Adams RP. Identification of essential oil components by GC/MS. Allured Publishing. 2017;5th Edition:1804.
- R Core Team. R: A language and environment for statistical computing. R Foundation for Statistical Computing. 2022;Vienna, Austria.
- Jayaprakasha GK, Negi PS, Anandharamakrishnan C. An improved HPLC method for the determination of curcumin, demethoxycurcumin, and bisdemethoxycurcumin. Journal of Food Composition and Analysis. 2006;19(6-7):446-451.
- Braga MEM, Leal PF, Carvalho JE. Comparison of yield, composition, and antioxidant activity of turmeric essential oils. Food Chemistry. 2003;40(4):341-348.
- Niranjan A, Prakash D. Chemical constituents and biological activities of turmeric: a review. Journal of Food Science and Technology. 2008;45(2):109-116.
- Govindarajan VS. Turmeric: Chemistry, technology, and quality. Critical Reviews in Food Science and Nutrition. 1980;12(3):199-301.
- Li S, Yuan W, Deng G. Chemical composition and product quality control of turmeric. Pharmaceutical Crops. 2011;2:28-54.
- Bambirra ML, Junqueira RG, Gloria MBA. Influence of postharvest processing on the quality of turmeric. Brazilian Archives of Biology and Technology. 2002;45(4):423-429.
- Singh G, Kapoor IPS, Singh P. Comparative research of chemical composition and antioxidant activity of turmeric volatile oil. Food and Chemical Toxicology. 2010;48(4):1026-1031.