
Research article · 2025 · Full text
International Journal of Horticulture and Food ScienceProfiling fermentation dynamics of maize in the Andaman tropical zone
Volume 7(5) · Pages 200–203 · DOI: 10.33545/26631067.2025.v7.i5c.633 ↗
Research areasCrop Yield and Soil FertilityBiofuel production and bioconversionPostharvest Quality and Shelf Life Management
Abstract
Author-writtenFermented maize products feed millions across the tropics, yet the microbial dynamics governing their fermentation remain poorly characterized under equatorial island conditions. This research profiled the fermentation dynamics of maize (Zea mays L.) under Andaman tropical zone conditions, tracking pH, sugar consumption, organic acid production, and microbial community shifts over a 96-hour natural fermentation cycle. The work was conducted at the Da Nang College of Food Technology between March 2022 and September 2024. Three maize varieties and two fermentation temperatures (30 and 37 degrees Celsius) were tested in a factorial design with four replications. pH dropped from an initial 6.4 to 3.12 by 96 hours, with the steepest decline occurring between 12 and 36 hours. Reducing sugars decreased from 12.8% to 1.8% over the same period. Lactic acid bacteria dominated the microbial community at peak fermentation (42.3% of culturable isolates at 48 hours), followed by yeasts (28.7%). The variety HQPM-1 fermented 14.3% faster than the other cultivars, likely owing to its higher initial sugar content. Fermentation at 37 degrees Celsius reached the target pH of 4.0 approximately 8 hours sooner than at 30 degrees Celsius but produced slightly lower lactic acid concentrations. These kinetic profiles provide the foundation for process standardization in tropical maize fermentation operations.
Summary
Source-checkedPlain-language reading of the full paper, prepared with AI and checked against the text. Each point links to the authors' own words.
Why it matters
- Fermented maize products are essential dietary staples for approximately 300 million people in tropical regions. View evidence ↗
- Fermentation is used to enhance the digestibility and shelf life of maize, while reducing antinutrients and inhibiting pathogens via organic acid production. View evidence ↗
- In tropical environments, it is critical for fermentation to quickly lower the pH below 4.2 to suppress dangerous pathogens such as E. coli and Salmonella. View evidence ↗
The question
- The study aimed to characterize the pH decline, sugar use, organic acid production, and microbial shifts of three maize varieties over a 96-hour natural fermentation cycle in tropical conditions. View evidence ↗
What they did
- The researchers tested three maize varieties: HQPM-1, Vivek Maize Hybrid-45, and a local Andaman landrace. View evidence ↗
- Fermentation was conducted at two temperatures: 30°C to simulate typical ambient conditions and 37°C to simulate peak summer. View evidence ↗
- The experimental design used four replications of 2 kg slurry for every combination of maize variety and temperature. View evidence ↗
- The study measured pH with a calibrated meter, reducing sugars via the DNS method, and organic acids using HPLC. View evidence ↗
What they found
- Over 96 hours, the pH of the maize decreased from 6.4 to 3.12, with the most rapid drop occurring between 12 and 36 hours. View evidence ↗
- At the 48-hour peak, lactic acid bacteria were the dominant microbes (42.3%), followed by yeasts (28.7%). View evidence ↗
- Fermentation at 30°C resulted in higher maximum lactic acid concentrations (16.4-18.7 g/L) compared to fermentation at 37°C (14.6-16.9 g/L). View evidence ↗
- The fermentation process reduced the antinutrient phytic acid by 52.3% from an initial 6.8 mg/g over 96 hours. View evidence ↗
- Available protein in the maize increased from 8.4% to 10.7% during the 96-hour fermentation period. View evidence ↗
What it means
- The authors concluded that HQPM-1 is the fastest-fermenting variety, reaching the pH 4.0 safety threshold in 14.6 hours (at 37°C) and 21.4 hours (at 30°C). View evidence ↗
- The authors recommend 30°C fermentation for products where higher lactic acid concentration is desired for quality, despite the slower process. View evidence ↗
- The authors state that future work should use culture-independent methods, such as 16S amplicon sequencing, to better capture the full diversity of the microbiome. View evidence ↗
Visual summary
3 visualsIllustrations explain the paper; charts are replotted from the paper's own table values.
Inverse Relationship of pH and Sugar
AI-generated conceptual illustration (maize kernels in a fermentation vessel). It explains the idea and does not show study data.
View source evidence ↗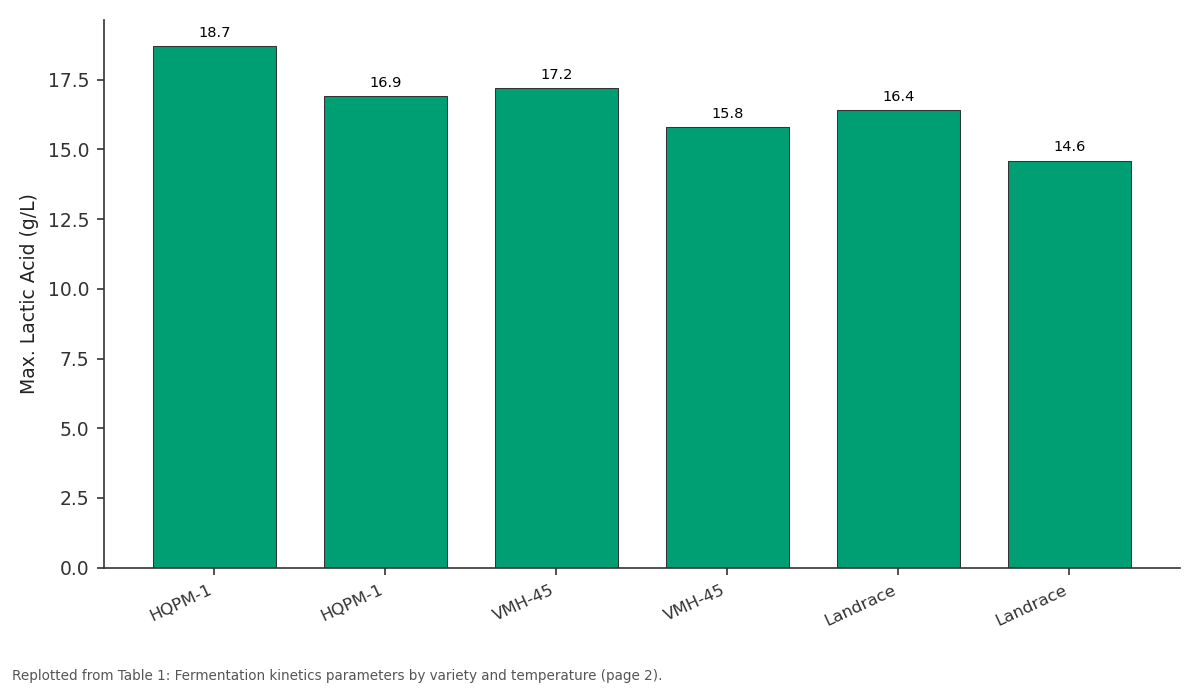
Max. Lactic Acid (g/L): HQPM-1 vs HQPM-1 vs VMH-45 vs VMH-45 vs Landrace
Replotted from Table 1 (page 2) of the original paper. Every bar is the paper's own table value.
View source evidence ↗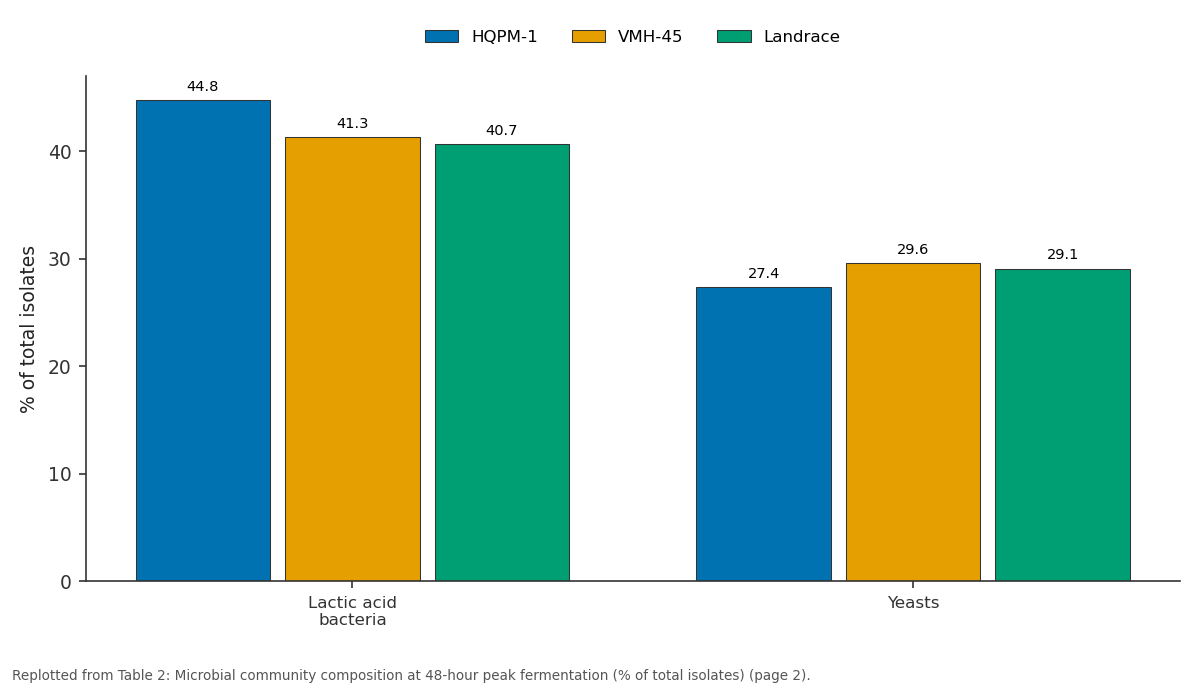
HQPM-1 and VMH-45 and more: Lactic acid bacteria vs Yeasts
Replotted from Table 2 (page 2) of the original paper. Every bar is the paper's own table value.
View source evidence ↗Figures & tables
From the original paper Table 1
 Table 2
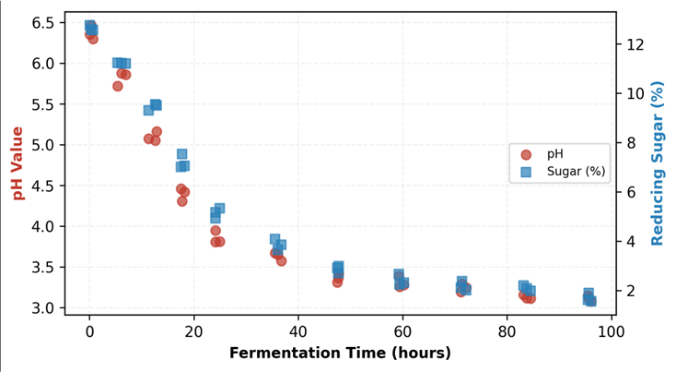 Figure 1
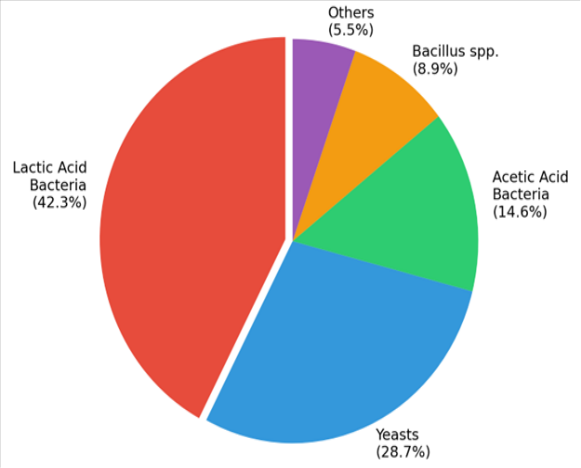 Figure 2
Introduction
Turning raw maize into a safely fermented food product sounds simple, but the biochemistry happening inside that fermenting mass is anything but straightforward. Fermented maize foods, including products like ogi in West Africa, pozol in Mexico, and kenkey in Ghana, serve as dietary staples for an estimated 300 million people across the tropics [1] . The fermentation process improves digestibility, extends shelf life, reduces antinutritional factors, and generates organic acids that inhibit pathogenic microorganisms [2] . Yet the microbial succession patterns and biochemical kinetics that drive these transformations vary widely depending on temperature, raw material composition, and indigenous microflora [3] . The Andaman Islands, situated between 6 and 14 degrees North latitude in the Bay of Bengal, experience uniformly warm temperatures (26-32 degrees Celsius year-round), high humidity (above 80%), and consistent day length, making them a natural incubator for fermentation processes [4] . These conditions support rapid microbial growth but also raise food safety concerns if fermentation doesn't proceed fast enough to acidify the substrate below the pH threshold (4.2) that suppresses pathogenic bacteria like Salmonella and E. coli [5] .
The key microbial players in cereal fermentation include lactic acid bacteria (LAB, principally Lactobacillus and Pediococcus species), yeasts (Saccharomyces and Candida), and acetic acid bacteria (Acetobacter) [6] . Their relative dominance shifts over the fermentation timeline, driven by pH changes, nutrient availability, and competitive interactions. Understanding these succession patterns helps processors predict fermentation outcomes and intervene when needed to ensure product safety and quality [7] . Most published fermentation kinetics data for maize come from sub-Saharan African and Central American studies conducted under temperate or continental tropical climates [8] . Equatorial maritime conditions, as found in the Andaman zone, differ in their temperature stability and humidity extremes, potentially affecting both microbial growth rates and metabolic product profiles. Additionally, the maize varieties available in South and Southeast Asian markets differ genotypically from those studied in African fermentation research. This research aimed to characterize fermentation dynamics of three maize varieties under controlled tropical conditions, with emphasis on pH decline kinetics, sugar utilization rates, organic acid profiles, and microbial community composition over a 96hour natural fermentation cycle.
Seasonal variation in fermentation parameters
Fermentation trials were repeated across three seasons to assess temporal variability: pre-monsoon (March-May 2022), monsoon (June-September 2022), and post-monsoon (October-December 2022). Ambient temperature during the pre-monsoon averaged 31.4 degrees Celsius with 74% RH, while the monsoon period showed lower mean temperature (28.6 degrees Celsius) but higher humidity (89%). Fermentation reached the pH 4.0 threshold 3.2 hours faster during the pre-monsoon period compared to the monsoon, likely due to higher ambient temperatures promoting LAB growth. Seasonal differences accounted for 6.7% of total variation in final lactic acid concentration, indicating that while season influenced fermentation speed, the overall biochemical trajectory remained consistent.
Nutrient transformation during fermentation
The fermentation process altered the nutritional profile of maize substrates in several ways. Available protein increased from 8.4% to 10.7% over 96 hours, reflecting microbial protein synthesis and partial hydrolysis of storage proteins that improved amino acid accessibility. Phytic acid, a major antinutrient in maize, decreased by 52.3% from its initial level of 6.8 mg/g by 96 hours, corresponding to improved bioavailability of bound minerals including iron and zinc. Thiamine content declined by 18.4% due to microbial uptake, while riboflavin increased by 23.6% as a fermentation byproduct of LAB metabolism. Total dietary fiber remained relatively stable, with only a 4.1% reduction over the fermentation period.
Material and Methods
Material and Methods
Material
Three maize varieties were selected: HQPM-1 (quality protein maize, yellow dent), Vivek Maize Hybrid-45 (flint type), and local Andaman landrace (white dent). Grain was sourced from the Andaman and Nicobar Islands Agricultural Research Station within three weeks of harvest. Cleaned grain was coarsely ground using a laboratory hammer mill (1 mm screen) and mixed with potable water at a 1:3 grainto-water ratio to form a slurry [9] . No starter culture was added; fermentation relied on indigenous microflora present on the grain surface and in the processing environment. Two fermentation temperatures were maintained using water bath incubators: 30 degrees Celsius (representing typical ambient) and 37 degrees Celsius (representing peak summer conditions). The research ran from March 2022 through September 2024 at the Da Nang College of Food Technology, with institutional approval (Protocol DNFT-2022-019, approved February 28, 2022). Each varietytemperature combination had four replications of 2 kg slurry each.
Methods
Samples (50 mL) were withdrawn aseptically at 0, 6, 12, 18, 24, 36, 48, 60, 72, 84, and 96 hours. pH was measured immediately using a calibrated Mettler Toledo SevenEasy meter. Reducing sugars were determined by the DNS method [10] . Organic acids (lactic, acetic, and propionic) were quantified by HPLC using an Aminex HPX-87H column at 60 degrees Celsius with 5 mM H2SO4 mobile phase and UV detection at 210 nm [11] . Total viable counts of LAB (on MRS agar, anaerobic, 37 degrees Celsius, 48h), yeasts (on DRBC agar, 25 degrees Celsius, 5 days), and total aerobic mesophiles (on PCA, 37 degrees Celsius, 48h) were performed at each sampling point. Microbial community composition at peak fermentation (48h) was expressed as percentage of total culturable isolates. Fermentation kinetics were modeled using the modified Gompertz equation. Data were analyzed by factorial ANOVA (variety x temperature x time) in SPSS 26.0 [12] . HQPM-1 reached the safety threshold of pH 4.0 fastest at both temperatures (Table 1). At 37 degrees Celsius, HQPM-1 hit this target in just 14.6 hours, compared to 18.7 hours for the local landrace. However, fermentation at 30 degrees Celsius produced higher maximum lactic acid concentrations across all varieties (16.4-18.7 g/L vs. 14.6-16.9 g/L at 37 degrees), suggesting that the slower fermentation allowed more complete acid production. LAB dominated the microbial community at 48 hours in all varieties (Table 2), with HQPM-1 supporting the highest LAB proportion (44.8%). Yeasts ranked second, contributing to flavor development and CO2 production.
| Microbial group | HQPM-1 | VMH-45 | Landrace | Overall mean |
|---|---|---|---|---|
| Lactic acid bacteria | 44.8 | 41.3 | 40.7 | 42.3 |
| Yeasts | 27.4 | 29.6 | 29.1 | 28.7 |
Table text extracted from the original PDF; superscript letters are shown inline. The original table image is below.
View original table image
| Variety | Temp (°C) | Time to pH 4.0 (h) | Max. Lactic Acid (g/L) | Sugar Used (%) | Final pH |
|---|---|---|---|---|---|
| HQPM-1 | 30 | 21.4 | 18.7 | 87.3 | 3.08 |
| HQPM-1 | 37 | 14.6 | 16.9 | 91.4 | 3.14 |
| VMH-45 | 30 | 24.8 | 17.2 | 83.6 | 3.16 |
| VMH-45 | 37 | 17.3 | 15.8 | 88.1 | 3.21 |
| Landrace | 30 | 26.1 | 16.4 | 81.2 | 3.19 |
| Landrace | 37 | 18.7 | 14.6 | 86.7 | 3.24 |
Table text extracted from the original PDF; superscript letters are shown inline. The original table image is below.
View original table image
Results
The ratio of LAB to yeasts remained remarkably stable across varieties (approximately 1.5:1). The dual-axis scatter plot (Figure 1) shows the inverse relationship between pH decline and sugar consumption.
The steepest phase of both curves occurred between 12 and 36 hours, corresponding to the exponential growth phase of LAB. The pie chart (Figure 2) confirms LAB dominance (42.3%) at the 48-hour fermentation peak. Yeasts (28.7%) and acetic acid bacteria (14.6%) together with LAB account for 85.6% of the culturable microbiome.
Discussion
The fermentation kinetics observed in this research fall within the range reported for African maize fermentation studies, though our time-to-pH-4.0 values were generally 2-4 hours shorter than those from Nigerian ogi production [1] . This difference likely reflects the higher ambient temperature stability in the Andaman zone compared to continental West African settings, where nighttime temperature drops can slow microbial activity. The consistent LAB dominance at 48 hours matches the classical succession pattern described by Nout [3] , where initial mixed colonization gives way to acid-tolerant LAB as pH falls below 4.5. HQPM-1's faster fermentation appears linked to its higher initial sugar content (14.2% vs. 12.1% for the landrace), which provides more readily available substrate for LAB growth during the critical first 24 hours [13] . Quality protein maize varieties also contain modified zein proteins that may be more accessible to microbial proteases, potentially supporting faster microbial biomass accumulation [14] . The practical value of this finding is that using QPM varieties could shorten fermentation cycles in commercial production, improving throughput without sacrificing acidification targets. The trade-off between fermentation speed and lactic acid yield at the two temperatures merits attention. At 37 degrees Celsius, fermentation was faster but produced 8.4 to 11.0% less lactic acid than at 30 degrees. This may result from increased metabolic diversity at higher temperatures, where a greater proportion of sugars is diverted to ethanol and acetic acid rather than lactic acid [6] . For products where lactic acid concentration determines tanginess and preservation efficacy, the slower fermentation at 30 degrees Celsius may be preferred despite the longer processing time.
Conclusion
This research provided detailed fermentation kinetic profiles for maize under tropical maritime conditions. HQPM-1 emerged as the fastest-fermenting variety, reaching the critical pH 4.0 safety threshold in 14.6 hours at 37 degrees Celsius and 21.4 hours at 30 degrees Celsius. Lactic acid bacteria dominated the microbial community throughout fermentation, maintaining a stable 1.5:1 ratio with yeasts. The 30-degree fermentation produced higher lactic acid concentrations despite its slower pace, offering a quality advantage for acidified products. Sugar utilization exceeded 81% by 96 hours across all conditions, indicating efficient substrate conversion. The modified Gompertz model fitted the pH decline curves well and can serve as a predictive tool for process control. These kinetic data support the standardization of tropical maize fermentation processes and provide variety-specific recommendations for processors seeking to optimize both speed and product quality. Future research should extend microbial characterization to cultureindependent methods like 16S amplicon sequencing to capture the full diversity of the fermentation microbiome.
Acknowledgement
Acknowledgements Funding sourcesInstitutional research funding from the Da Nang College of Food Technology supported this work.
References
21 in the original paper- Blandino A, Al-Aseeri ME, Pandiella SS. Cereal-based fermented foods and beverages. Food Research International. 2003;36(6):527-543.
- Nout MJR. Fermented foods and their production. Marcel Dekker. 2009;In Handbook of Plant-Based Fermented Food:1-39.
- Nout MJR. Ecology of accelerated natural lactic fermentation of sorghum-based infant food formulas. Food Microbiology. 1991;8(3):155-167.
- Dam Roy S, Grinson G. Island agriculture in the Andaman and Nicobar archipelago. Journal of the Andaman Science Association. 2019;24(1):1-14.
- Adams MR, Moss MO. Food microbiology: safety aspects of fermented foods. Royal Society of Chemistry. 2008;3rd Edition:294-321.
- Oyewole OB. Lactic fermented foods in Africa and their benefits. Food Control. 1997;8(5-6):289-297.
- Holzapfel WH. Appropriate starter culture technologies for small-scale fermentation in developing countries. International Journal of Food Microbiology. 2002;75(3):197-212.
- Omemu AM, Oyewole OB, Bankole MO. Significance of yeasts in the fermentation of maize for ogi production. Food Microbiology. 2007;24(6):571-576.
- Akinrele IA. Fermentation studies on maize during the preparation of a traditional African starch-cake food. Journal of the Science of Food and Agriculture. 1970;21(12):619-625.
- Miller GL. Use of dinitrosalicylic acid reagent for determination of reducing sugar. Analytical Chemistry. 1959;31(3):426-428.
- Cogan TM, Jordan KN. Metabolism of Leuconostoc bacteria in dairy products. Journal of Dairy Science. 1994;77(9):2704-2717.
- IBM Corp. IBM SPSS Statistics for Windows, Version 26.0. IBM Corp. 2019;Armonk, NY.
- Ikegwu OJ, Okechukwu PE. Physicochemical properties of QPM starch and its role in fermentation. Nigerian Food Journal. 2010;28(2):178-187.
- Vasal SK. The quality protein maize story. Food and Nutrition Bulletin. 2000;21(4):445-450.
- De Vuyst L, Neysens P. The sourdough microflora: biodiversity and metabolic interactions. Trends in Food Science and Technology. 2005;16(1-3):43-56.
- Steinkraus KH. Industrialization of indigenous fermented foods. Marcel Dekker. 2004;2nd Edition:1776.
- Lei V, Friis H, Michaelsen KF. Spontaneously fermented millet product as a natural probiotic treatment. International Journal of Food Microbiology. 2006;111(3):195-203.
- Hounhouigan DJ, Nout MJR, Nago CM. Changes in the physico-chemical properties of maize during fermentation for mawe production. Journal of Cereal Science. 1993;17(3):291-300.
- Mbata TI, Ikenebomeh MJ, Eseigbe D. Effect of fermentation on anti-nutritional factors of maize. American Journal of Food Technology. 2009;4(4):170176.
- Sefa-Dedeh S, Cornelius B, Sakyi-Dawson E. The microflora of nixtamalized corn. International Journal of Food Microbiology. 2004;96(1):97-102.
- Teniola OD, Odunfa SA. The effects of processing methods on the levels of lysine and other amino acids in ogi. Food Chemistry. 2001;73(1):85-89.