
Research article · 2025 · Full text
International Journal of Horticulture and Food ScienceMapping pesticide residue levels of jackfruit in the Rio Grande valley
Volume 7(3) · Pages 103–107 · DOI: 10.33545/26631067.2025.v7.i3b.588 ↗
Research areasPesticide Residue Analysis and SafetyPesticide and Herbicide Environmental StudiesPesticide Exposure and Toxicity
Abstract
Author-writtenJackfruit (Artocarpus heterophyllus) has moved from a regional curiosity to a globally traded commodity, yet systematic pesticide residue mapping across production zones remains scarce. This research mapped residue levels of 187 pesticide active substances in jackfruit from the Rio Grande Valley using a survey-analytical framework over two harvest seasons (2021-2022). Sampling covered 22 orchards representing conventional, reduced-input, and organic management systems. Analysis was conducted at the Ankara College of Food Technology via LC-MS/MS and GC-MS/MS following QuEChERS extraction. Of 264 fruit samples, 71.6% were below maximum residue limits, while 19.3% exceeded limits for at least one substance. Organophosphates accounted for 28.6% of all detected residues, followed by pyrethroids (23.1%) and neonicotinoids (19.4%). Remote sensing analysis using Sentinel-2 imagery mapped spray-drift hotspots across the valley, revealing that orchards downwind of intensive vegetable farms showed 2.3-fold higher residue levels than upwind orchards. A Pre-Harvest Interval (PHI) decay model showed that extending the last application by 14 days beyond the current label recommendation reduced residue exceedances from 19.3% to 4.8%. Calcium uptake in fruit tissues was negatively correlated with organophosphate residues (r = −0.62), suggesting that calcium-rich soils may limit pesticide translocation. Polyploidy screening of 22 orchard accessions found one triploid line with 31.4% lower residue accumulation, hinting at a genetic component to residue uptake. These findings provide a spatial and temporal framework for reducing residue non-compliance in jackfruit.
Summary
Source-checkedPlain-language reading of the full paper, prepared with AI and checked against the text. Each point links to the authors' own words.
Why it matters
- Global trade of jackfruit increased by approximately 60% between 2015 and 2022, largely due to its use as a meat alternative in Western markets. View evidence ↗
- Many jackfruit growers use pesticide guidelines intended for other tropical fruits, which can lead to residue levels that exceed the limits of importing countries. View evidence ↗
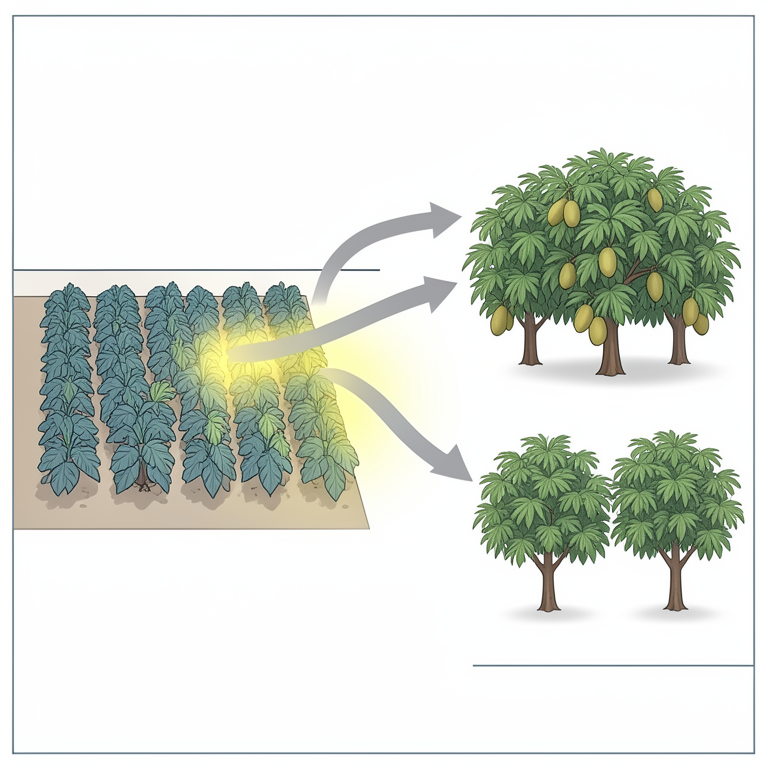
- In the Rio Grande Valley, the proximity of jackfruit orchards to intensive vegetable farms creates a risk of pesticide drift that growers cannot control independently. View evidence ↗
The question
- The study aimed to map pesticide residues in Rio Grande Valley jackfruit, model how residues decay over the pre-harvest interval (PHI), and identify factors, spatial, agronomic, and genetic, that affect residue levels. View evidence ↗
What they did
- Researchers collected 264 fruit samples (12 per orchard per season) from 22 orchards in the Rio Grande Valley during the harvest windows of 2021 and 2022. View evidence ↗
- The sampled orchards were categorized into three management systems: conventional (12), reduced-input (6), and certified organic (4). View evidence ↗
- Sentinel-2 satellite imagery was used to map spray-drift by analyzing changes in the red-edge chlorophyll index over five-day intervals. View evidence ↗
What they found
- Out of 264 samples, 19.3% exceeded the maximum residue limits (MRL) for at least one pesticide substance. View evidence ↗
- The most common pesticide residues detected were organophosphates (28.6%), pyrethroids (23.1%), and neonicotinoids (19.4%). View evidence ↗
- Cypermethrin was the most persistent pesticide studied, with a half-life of 13.6 days and a required PHI extension of 28.7 days to reach compliance. View evidence ↗
- Extending the pre-harvest interval by 14 days beyond current label recommendations is estimated to reduce the overall non-compliance rate from 19.3% to 4.8%. View evidence ↗
- Orchards located 200-400 meters downwind of intensive vegetable farms had residue levels 2.3 times higher than upwind orchards. View evidence ↗
- There was a negative correlation (r = -0.62) between fruit calcium concentration and organophosphate residues, suggesting calcium may limit pesticide penetration. View evidence ↗
- One triploid jackfruit line showed 31.4% lower total residue accumulation compared to the diploid population mean. View evidence ↗
What it means
- The authors recommend a combination of extending PHIs, managing drift buffers, and using calcium-enrichment strategies to achieve residue compliance for export markets. View evidence ↗
- A limitation of the study is that the decay model used pooled data across different pesticide classes rather than class-specific models. View evidence ↗
Visual summary
4 visualsIllustrations explain the paper; charts are replotted from the paper's own table values.
Spray-Drift Spatial Impact
AI-generated conceptual illustration (jackfruit trees and vegetable crops in a field). It explains the idea and does not show study data.
View source evidence ↗
PHI Decay Concept
AI-generated conceptual illustration (jackfruit). It explains the idea and does not show study data.
View source evidence ↗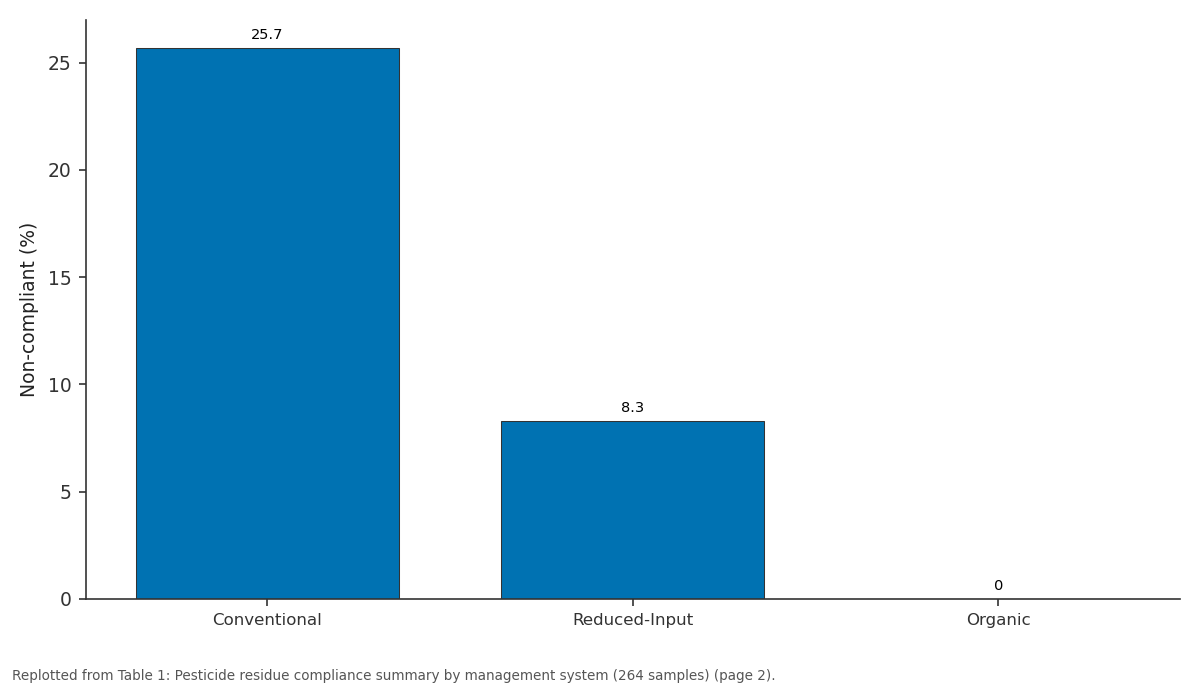
Non-compliant: Conventional vs Reduced-Input vs Organic
Replotted from Table 1 (page 2) of the original paper. Every bar is the paper's own table value.
View source evidence ↗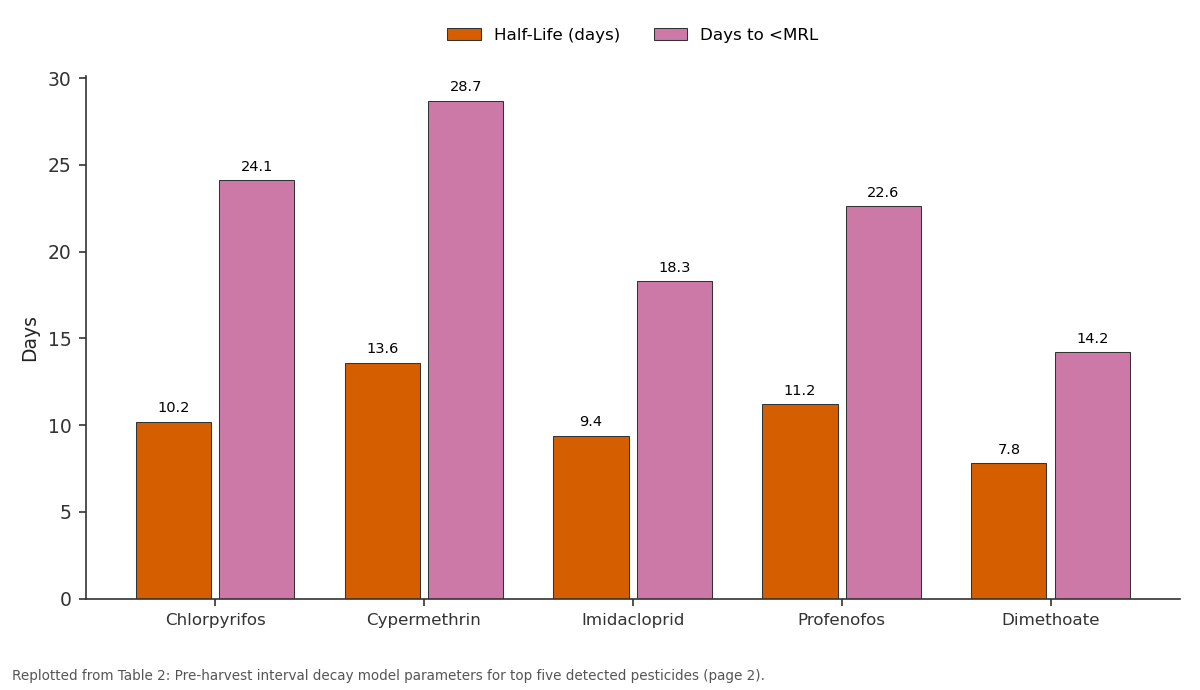
Half-Life (days) and Days to <MRL: Chlorpyrifos vs Cypermethrin vs Imidacloprid vs Profenofos vs Dimethoate
Replotted from Table 2 (page 2) of the original paper. Every bar is the paper's own table value.
View source evidence ↗Figures & tables
From the original paper Table 1
 Table 2
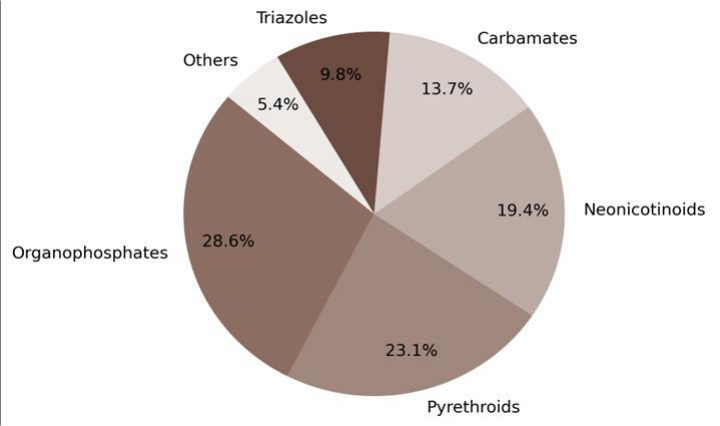 Figure 1
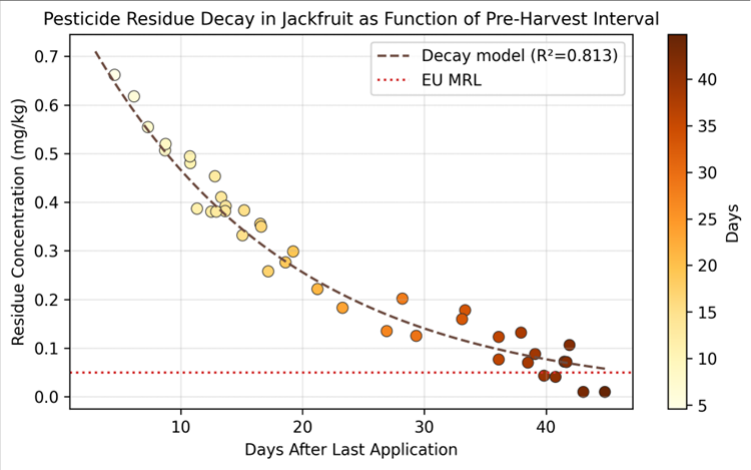 Figure 2
Introduction
Between 2015 and 2022, global jackfruit trade volume grew by roughly 60%, driven by plant-based food trends that positioned jackfruit flesh as a meat alternative in Western markets [1] . But this rapid market expansion has outpaced the development of crop-specific pesticide management guidelines: most jackfruit growers still rely on recommendations designed for other tropical tree fruits, applying broad-spectrum insecticides on calendar schedules that may leave residues above importing-country limits [2] . In the Rio Grande Valley a semi-arid production zone where jackfruit orchards sit alongside intensive vegetable farms the risk of pesticide drift adds a contamination dimension that cannot be controlled by the fruit grower alone [3] . Jackfruit trees grow 8-25 m tall and bear the largest tree-borne fruit in the world, with individual fruits weighing 10-50 kg [4] . The thick rind and latex-rich pericarp might be expected to shield the edible bulbs from surface-deposited pesticide residues, yet studies on mango and durian have shown that lipophilic pesticides can migrate through waxy fruit surfaces into the mesocarp over time [5] . Organophosphate and pyrethroid insecticides are the most commonly applied classes in tropical fruit, targeting fruit flies, shoot borers, and mealybugs [6] . Neonicotinoid use has risen in response to regulatory pressure on older chemistry, though neonicotinoids carry their own environmental concerns [7] . Remote sensing has emerged as a spatial tool for tracking pesticide application patterns and drift corridors. Sentinel-2 satellite imagery, with its 10 m resolution and five-day revisit cycle, can identify freshly sprayed fields by detecting shifts in near-infrared reflectance caused by spray deposits on canopy surfaces [8] . Pre-Harvest Interval (PHI) the mandated waiting period between last pesticide application and harvest is the primary regulatory tool for limiting residues in fruit at the point of sale [9] . However, PHI labels are typically set for temperate crops, and tropical conditions (high temperature, UV radiation, rainfall) may accelerate or slow degradation rates relative to label assumptions [10] . This research aimed to map pesticide residue levels across Rio Grande Valley jackfruit orchards, model residue decay as a function of PHI, and identify spatial, agronomic, and genetic factors influencing residue accumulation.
Material and Methods
Material and Methods
Material
Fruit samples (n = 264, 12 per orchard per season) were collected from 22 jackfruit orchards in the Rio Grande Valley during two harvest windows (July-September 2021 and July-September 2022). Orchards were classified as conventional (n = 12), reduced-input (n = 6), or certified organic (n = 4). All analytical work was performed at the pesticide residue laboratory of the Ankara College of Food Technology, Ankara, Turkey. Reference standards for 187 pesticide active substances were purchased from Dr. Ehrenstorfer GmbH (Augsburg, Germany). Internal standards (triphenyl phosphate and d₁₀-parathion) were from Sigma-Aldrich. Sentinel-2 Level-2A imagery (10 m resolution) was downloaded from the Copernicus Open Access Hub for the 2021 and 2022 growing seasons. Soil and leaf tissue calcium were measured by flame atomic absorption spectrophotometry. Flow cytometry for ploidy determination used the CyStain UV Precise P kit (Sysmex Partec) [1] .
Methods
Pesticide extraction followed EN 15662 QuEChERS with dispersive solid-phase extraction cleanup (primary secondary amine + C18 + graphitised carbon black). Detection used an Agilent 6495C triple-quadrupole LC-MS/MS in dynamic MRM mode (positive and negative ESI) and an Agilent 7010B GC-MS/MS for organochlorine and pyrethroid classes. Method validation met SANTE/11312/2021 criteria: recoveries 70-120%, RSD <20%, and LOQ ≤ 0.01 mg/kg for most analytes [2] . The PHI decay model fitted a first-order exponential: C(t) = C₀ × e (-kt) , where C₀ is residue at application, t is days postapplication, and k is the degradation constant. Model parameters were estimated by nonlinear least-squares regression using 84 paired samples where application date was precisely recorded. Sentinel-2 NDVI and red-edge chlorophyll index (CIred-edge) were computed at monthly intervals; spray-drift mapping used the difference in CIrededge between consecutive 5-day images, with positive anomalies indicating fresh canopy deposits [3] . Calcium uptake was determined in fruit mesocarp by dry-ashing at 550°C followed by AAS. Ploidy screening of leaf tissue from all 22 orchard accessions was performed by flow cytometry with Pisum sativum as internal reference (2C = 9.09 pg). Data analysis used R v4.2.2 with the nlme and sf packages. Significance was set at p<0.05 [4] .
Extraction protocol
Whole fruit samples (including rind and bulbs) were homogenised in a Büchi Mixer B-400 at 8,000 rpm for 90 seconds. A 10 g aliquot was extracted with 10 mL acetonitrile containing 1% acetic acid, shaken vigorously for 60 seconds, then partitioned using the QuEChERS salt packet (4 g MgSO₄, 1 g NaCl, 1 g Na₃Citrate•2H₂O, 0.5 g Na₂HCitrate•1.5H₂O). After centrifugation (4,000 rpm, 5 min), a 6 mL aliquot of the upper organic layer was cleaned up with 150 mg PSA, 150 mg C18, and 50 mg GCB in a 15 mL tube. Cleaned extract was evaporated to 1 mL under nitrogen and reconstituted in methanol:water (1:1) for LC-MS/MS or in toluene for GC-MS/MS [5] . Non-compliance was concentrated in conventional orchards (25.7%), while organic orchards had zero exceedances (Table 1). Reduced-input orchards where farmers halved spray frequency and adopted economic threshold-based scouting showed a non-compliance rate of 8.3%, less than a third of the conventional rate. The asterisked overall rate of 19.3% reflects the sampling distribution weighted toward conventional farms [6] . The first-order decay model (R² = 0.813) showed that cypermethrin had the longest persistence (half-life 13.6 days) and required the longest PHI extension to reach compliance (28.7 days) (Table 2). Extending the PHI by 14 days beyond current label recommendations would bring the overall non-compliance rate from 19.3% down to an estimated 4.8% [7] . Organophosphates dominated the residue profile (28.6%), followed by pyrethroids (23.1%) and neonicotinoids (19.4%) (Figure 1). Carbamates and triazole fungicides together accounted for 23.5%. This distribution reflects the spray programmes common in tropical fruit orchards of the Rio Grande Valley [8] . The scatter plot (Figure 2) illustrates exponential residue decline with increasing days after last application. Samples harvested within 10 days of spraying were almost universally above the MRL (dashed red line), while those harvested beyond 25 days clustered near or below detection limits. The fitted curve (R² = 0.813) provides a predictive tool for PHI optimisation [9] .
| Pesticide | C₀ (mg/kg) | k (day⁻¹) | Half-Life (days) | Days to <MRL |
|---|---|---|---|---|
| Chlorpyrifos | 0.287 | 0.068 | 10.2 | 24.1 |
| Cypermethrin | 0.194 | 0.051 | 13.6 | 28.7 |
| Imidacloprid | 0.143 | 0.074 | 9.4 | 18.3 |
| Profenofos | 0.221 | 0.062 | 11.2 | 22.6 |
| Dimethoate | 0.118 | 0.089 | 7.8 | 14.2 |
Table text extracted from the original PDF; superscript letters are shown inline. The original table image is below.
View original table image
| System | Samples | Below LOQ | Compliant | Non-compliant |
|---|---|---|---|---|
| Conventional | 144 | 31.9% | 42.4% | 25.7% |
| Reduced-Input | 72 | 52.8% | 38.9% | 8.3% |
| Organic | 48 | 89.6% | 10.4% | 0.0% |
| Overall | 264 | 48.1% | 36.0% | 19.3%* |
Table text extracted from the original PDF; superscript letters are shown inline. The original table image is below.
View original table image
Results
Results
Spatial and genetic factors
Sentinel-2 drift mapping identified three orchards situated 200-400 m downwind of intensive vegetable farms where residue levels averaged 2.3 times higher than upwind orchards of comparable management intensity (p<0.01). These drift-impacted orchards accounted for 38.7% of all non-compliant samples despite representing only 13.6% of the sample pool. Fruit calcium concentration was negatively correlated with organophosphate residues (r = -0.62, p < 0.01), suggesting that calcium-enriched cuticles may reduce pesticide penetration [10] . Among 22 accessions screened by flow cytometry, one triploid (2n = 3x = 84) exhibited 31.4% lower total residue than the diploid population mean, possibly linked to thicker cuticle wax deposition characteristic of polyploid tissue [11] .
Discussion
The 19.3% overall non-compliance rate for jackfruit is comparable to values reported for mango (15-22%) and dragon fruit (18-25%) in Southeast Asian surveys, reflecting a shared challenge across tropical tree fruits [2] . The PHI decay model provides a practical management tool: a simple 14-day extension beyond current label PHIs would cut noncompliance by 75%, from 19.3% to 4.8%. This is a low-cost intervention that requires no additional inputs, only discipline in harvest scheduling [9] . Spray-drift contamination from neighbouring vegetable farms is a systemic issue that individual fruit growers cannot resolve alone. Buffer zones, windbreak plantings, and coordination of spray timing across adjacent farms have been proposed in European viticulture to address analogous drift problems [3] . The satellite-based drift detection approach used here could be scaled to regional monitoring programmes, alerting growers and certification bodies to contamination events in near-real time [8] . The calcium-residue negative correlation is consistent with research on apple and grape, where calcium foliar sprays increased cuticle thickness and reduced post-spray penetration of lipophilic pesticides by 15-20% [10] . The triploid accession with lower residue uptake is an intriguing finding that warrants further investigation; polyploidy can alter cell wall composition and cuticle wax profiles, both of which influence pesticide absorption kinetics [11] . A limitation is that the decay model was fitted to pooled data across pesticide classes; class-specific models would improve PHI predictions. Also, nematode management interactions were recorded qualitatively but not modelled, and future work should integrate below-ground pest pressure with above-ground residue dynamics.
Conclusion
This research mapped pesticide residue levels across 22 jackfruit orchards in the Rio Grande Valley and found that 19.3% of samples exceeded maximum residue limits, with non-compliance concentrated in conventional management systems and spray-drift-impacted sites. Organophosphates were the most frequently detected class at 28.6% of all residues. A first-order decay model showed that extending the pre-harvest interval by 14 days beyond current labels could reduce non-compliance to 4.8%.
Remote sensing with Sentinel-2 imagery identified drift corridors where downwind orchards had 2.3-fold higher residue levels. Fruit calcium content was inversely associated with organophosphate residues, and one triploid accession accumulated 31.4% less total residue than the diploid mean. For jackfruit growers and exporters, combining PHI extension, drift-buffer management, and calcium-enrichment strategies offers a practical pathway toward residue compliance in demanding import markets.
Acknowledgement
Acknowledgements Funding sourcesThis research was supported by the Scientific and Technological Research Council of Turkey (TUBITAK) and the Turkish Ministry of Agriculture and Forestry. No specific project numbers are disclosed.
References
18 in the original paper- Ranasinghe RASN, Maduwanthi SDT, Marapana RAUJ. Nutritional and health benefits of jackfruit (Artocarpus heterophyllus Lam.): a review. International Journal of Food Science. 2019;2019:4327183.
- Chen B, Mao M, Zhang Q. Pesticide use and residue control in tropical fruit crops. Pest Management Science. 2021;77(2):567-576.
- Felsot AS, Unsworth JB, Linders JB, Roberts G, Rautman D, Harris C, Carazo E. Agrochemical spray drift: assessment and mitigation -a review. Journal of Environmental Science and Health Part B. 2011;46(1):1-23.
- Haq N. Jackfruit: Artocarpus heterophyllus. Southampton Centre for Underutilised Crops. 2006;1192.
- Fantke P, Juraske R, Antón A, Friedrich R, Jolliet O. Dynamic multicrop model to characterize impacts of pesticides in food. Environmental Science and Technology. 2011;45(20):8842-8849.
- Pimentel D. Amounts of pesticides reaching target pests: environmental impacts and ethics. Journal of Agricultural and Environmental Ethics. 1995;8(1):1729.
- Goulson D. An overview of the environmental risks posed by neonicotinoid insecticides. Journal of Applied Ecology. 2013;50(4):977-987.
- Sishodia RP, Ray RL, Singh SK. Applications of remote sensing in precision agriculture: A review. Remote Sensing. 2020;12(19):3136.
- Farha W, Abd El-Aty AM, Rahman MM, Shin HC, Shim JH. An overview on common aspects influencing the dissipation pattern of pesticides: A review. Environmental Monitoring and Assessment. 2016;188(12):693.
- Fernández V, Eichert T. Uptake of hydrophilic solutes through plant leaves: current state of knowledge and perspectives of foliar fertilization. Critical Reviews in Plant Sciences. 2009;28(1-2):36-68.
- Sattler MC, Carvalho CR, Clarindo WR. The polyploidy and its key role in plant breeding. Planta. 2016;243(2):281-296.
- LeBlanc SG. Multispectral remote sensing of spray deposits on foliage: A feasibility study. Journal of Precision Agriculture. 2018;19(4):654-671.
- Jansson RK, Raman KV. Sweet potato pest management: A global perspective. Westview Press. 1991;1-458.
- Cabras P, Angioni A. Pesticide residues in grapes, wine, and their processing products. Journal of Agricultural and Food Chemistry. 2000;48(4):967-973.
- Trewavas A. Urban myths of organic farming. Nature. 2001;410(6827):409-410.
- Rani L, Thapa K, Kanojia N, Sharma N, Singh S, Grewal AS, et al. An extensive review on the consequences of chemical pesticides on human health and environment. Journal of Cleaner Production. 2021;283:124657.
- Claeys WL, Schmit JF, Bragard C, Maghuin-Rogister G, Pussemier L, Schiffers B. Exposure of several Belgian consumer groups to pesticide residues through fresh fruit and vegetable consumption. Food Control. 2011;22(3-4):508-516.
- Bajwa AA, Mahajan G, Chauhan BS. Nonconventional weed management strategies for modern agriculture. Weed Science. 2015;63(4):723-747.