
Research article · 2026 · Full text
International Journal of Horticulture and Food ScienceDynamics of area, production, and productivity of medicinal plants in Haryana: An econometric investigation into growth and instability
Volume 8(5) · Pages 01–05 · DOI: 10.33545/26631067.2026.v8.i5a.638 ↗
Research areasAgricultural Economics and PracticesEfficiency Analysis Using DEAAgricultural economics and policies
Abstract
Author-writtenMedicinal plants play a crucial role in the global healthcare system and rural economy. This study examines the dynamics of area, production, and productivity of medicinal crops over a 23-year period (2003-2025). Utilizing Compound Annual Growth Rate (CAGR) and the Cuddy-Della Valle Index (CDVI), the study assesses growth performance and degree of instability across four distinct time periods. The results reveal a highly volatile sector characterized by extreme production spikes and periods of significant contraction, followed by a robust recovery in the most recent quinquennium (2021-2025). The findings underscore the need for policy interventions to stabilize yields and incentivize sustainable cultivation.
Summary
Source-checkedPlain-language reading of the full paper, prepared with AI and checked against the text. Each point links to the authors' own words.
Why it matters
- Medicinal plants are important for both the global healthcare system and the rural economy. View evidence ↗
- The medicinal plant sector provides higher economic returns than traditional cereal crops, but it suffers from environmental sensitivity and market volatility. View evidence ↗
The question
- The study aims to examine the dynamics of productivity, production, and area of medicinal crops in Haryana over a 23-year period from 2003 to 2025. View evidence ↗
What they did
- The researchers used secondary time-series data for area (ha), production (MT), and productivity (MT/ha) spanning 23 years (2003-2025). View evidence ↗
- Growth performance and instability were assessed using the Compound Annual Growth Rate (CAGR) and the Cuddy-Della Valle Index (CDVI). View evidence ↗
What they found
- Linear trend analysis shows that the area used for medicinal plants has experienced a significant decline, with an annual change (slope) of -74.89 ha. View evidence ↗
- During the decline phase from 2003 to 2020, the area under cultivation contracted by -5.28% in the first period and -13.01% in the second. View evidence ↗
- A massive surge occurred during the expansion phase (2021-2025), with area increasing by 77.50% and production by 101.24%. View evidence ↗
- Over the full 23-year period, the overall CAGR for area was 2.72% and production was 0.36%, but productivity declined at a rate of -2.31%. View evidence ↗
- Production is the most unstable parameter, with an overall instability index (CDVI) of 341.69, which is categorized as extremely high. View evidence ↗
- Productivity has become more stable over time, dropping from a CDVI of 131.79 in the early years to 30.98 in the 2021-2025 period. View evidence ↗
- Land allocation instability peaked in the most recent period at 100.04, suggesting speculative expansion in the 2020s. View evidence ↗
What it means
- The authors recommend policy interventions focusing on price stabilization, crop insurance, and the distribution of stress-resistant, high-yield varieties to sustain growth. View evidence ↗
- The authors conclude that despite promising recent growth, the supply chain remains fragile due to extreme historical production instability. View evidence ↗
Visual summary
3 visualsIllustrations explain the paper; charts are replotted from the paper's own table values.
Growth Cycle of Medicinal Plants in Haryana
AI-generated conceptual illustration (Medicinal plants in Haryana (such as Aloe vera and Ashwagandha)). It explains the idea and does not show study data.
View source evidence ↗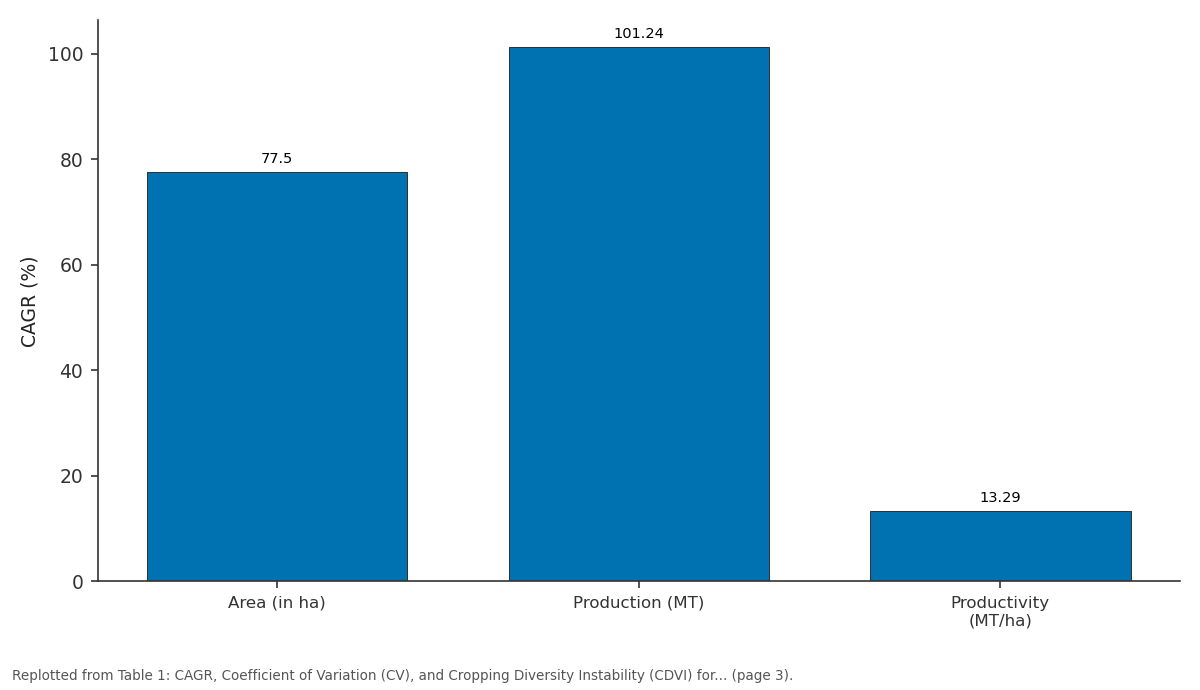
CAGR (%): Area (in ha) vs Production (MT) vs Productivity (MT/ha)
Replotted from Table 1 (page 3) of the original paper. Every bar is the paper's own table value.
View source evidence ↗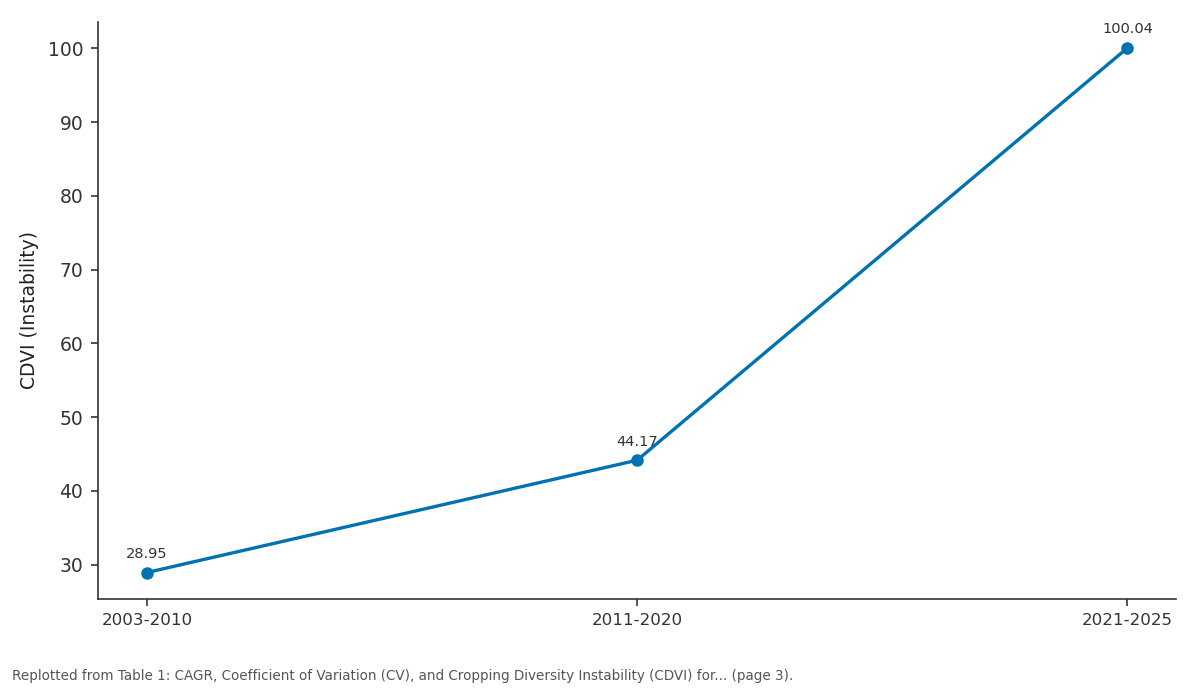
CDVI (Instability): 2003-2010 vs 2011-2020 vs 2021-2025
Replotted from Table 1 (page 3) of the original paper. Every bar is the paper's own table value.
View source evidence ↗Figures & tables
From the original paper Table 1
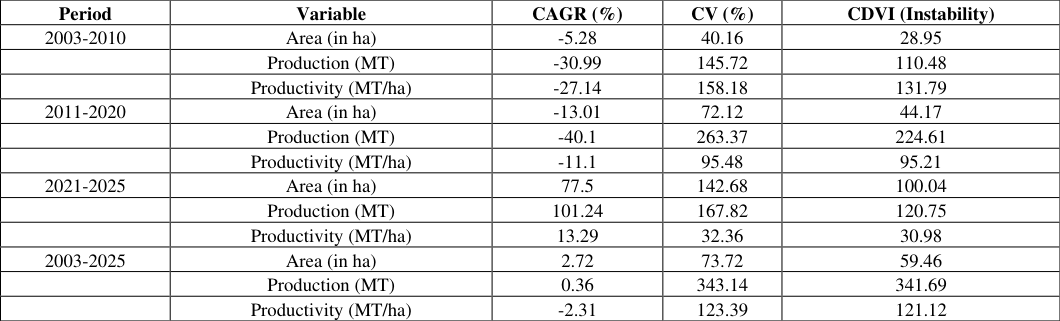 Table 1
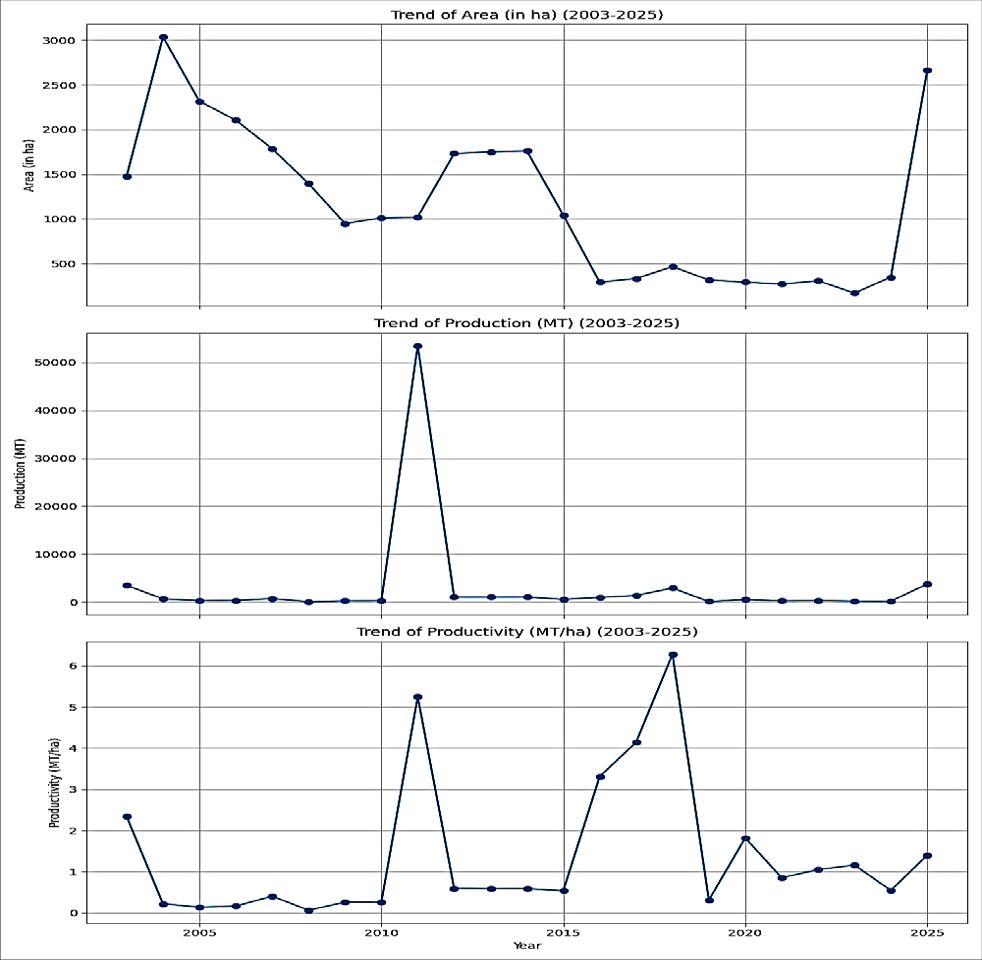 Figure 1
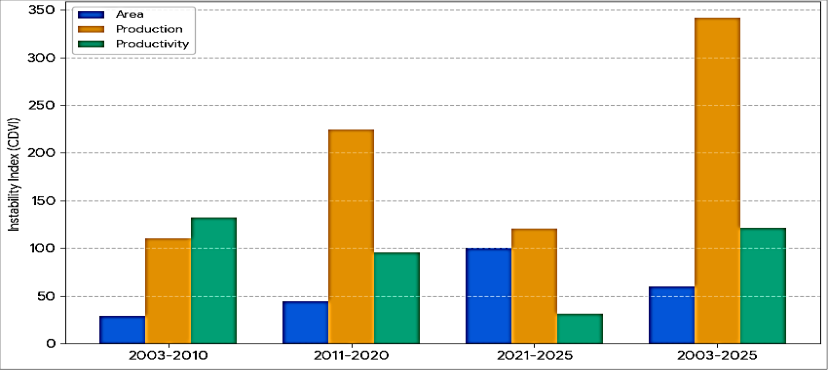 Figure 1
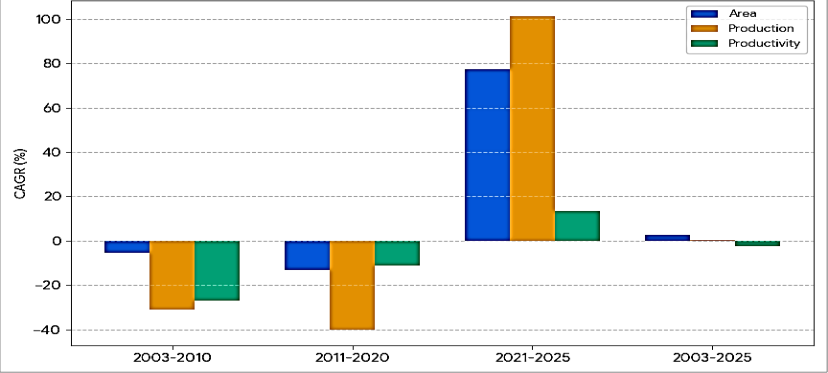 Figure 2
Introduction
The medicinal and aromatic plant (MAP) sector has gained global prominence due to the rising demand for natural healthcare products and herbal supplements. While the sector offers high economic returns compared to traditional cereal crops, it is often plagued by market volatility and environmental sensitivities. Understanding long-term trends in area and productivity is essential for stakeholders to manage risks. This paper analyzes the growth trajectories and instability inherent in medicinal data from 2003 to 2025, providing insights into the historical shifts and future potential of the industry. Previous studies on medicinal crop economics often highlight the "boom and bust" cycles associated with niche agricultural markets. Researchers have noted that while the area under cultivation often responds to market price signals, productivity remains hampered by a lack of standardized cultivation practices and quality seeds. Studies using CAGR and CV (Coefficient of Variation) have frequently shown that medicinal plants exhibit higher instability compared to food grains, primarily due to the specialized nature of the harvest and sensitivity to climatic shifts. Recent studies indicate a gradual but significant shift in Haryana's cropping patterns. While the Green Revolution initially favored a wheat-paddy monoculture, researchers like Nimbrayan et al. (2019) [4] have noted that post-Green Revolution periods have seen a diversification toward niche crops. Specifically for medicinal plants, the growth in area and production is driven by the rising global demand for herbal formulations. However, this growth is often characterized as "sporadic" rather than "linear," influenced heavily by volatile market prices and government subsidies. The state of Haryana, traditionally known for its "Green Revolution" crops (wheat and rice), has seen a gradual diversification into medicinal and aromatic plants (MAPs) such as Aloe Vera, Isabgol, Ashwagandha, and Stevia. Studies indicate that the Aravalli hills and the semi-arid regions of Southern Haryana (Mahendergarh, Rewari, and Gurgaon) possess significant floral diversity, with over 53 species identified as having high commercial potential (Yadav et al., 2020) [8] . Medicinal crops in Haryana face higher instability compared to traditional staples. This is largely due to the lack of regulated "Mandis" (markets) for MAPs, making farmers reliant on private contractors and middle-men (Thanki et al., 2011) [7] . Unlike wheat, medicinal plants are highly sensitive to micro-climatic shifts. Research highlights that while they are droughttolerant, biotic stresses like local pests and lack of standardized quality seeds contribute to production instability (Sindhuja & Malik, 2025) [6] . There is an increasing trend toward using Good Agricultural and Collection Practices (GACP) and organic certification to tap into the export market (CCRAS, 2024). The use of the Cuddy-Della Valle Index (CDVI) in agricultural statistics is a standardized method to distinguish between genuine growth and mere fluctuations. Literature on crop instability in Haryana suggests that while horticultural crops often face high price instability, mushrooms maintain a relatively stable production environment due to controlled indoor conditions. However, structural shifts-such as the transition from seasonal "thatched hut" cultivation to yearround "environmentally controlled units" (ECUs)-introduce phases of variability, which are captured through multiperiod instability analysis (Mishra et al., 2021) [3] . The Cuddy-Della Valle Index (CDVI) has been identified as the superior metric for this purpose, as it de-trends the data to prevent the overestimation of instability that often occurs with the standard Coefficient of Variation (Pavani et al., 2025) [5] .
Materials and Methods Data Source and Description
The study is based on secondary time-series data pertaining to the area (in hectares), production (in Metric Tonnes), and productivity (MT/ha) of medicinal crops. The dataset spans 23 years, from 2003 to 2025. To identify shifts in performance over different economic and policy regimes, the timeline was categorized into four distinct analytical periods:
Compound Annual Growth Rate (CAGR)
The CAGR was used to estimate the steady rate of growth over the specified periods, smoothing out annual fluctuations. It is expressed as using a semi-log (log-linear) model: ln (𝑌𝑌 𝑡𝑡 ) = 𝛼𝛼 + 𝛽𝛽𝑏𝑏 The compound annual growth rate (CAGR) was computed as: 𝐶𝐶𝐶𝐶𝐶𝐶𝐶𝐶 = (𝑒𝑒 𝛽𝛽 -1) × 100
This method captures the exponential growth pattern and provides a more accurate measure of growth over time compared to simple averages.
Measurement of Instability
Instability in medicinal plants was measured using both the coefficient of variation (CV) and the Cuddy-Della Valle Index (CDVI).
The coefficient of variation was calculated as: 𝐶𝐶𝐶𝐶 = 𝜎𝜎 𝜇𝜇 × 100, where 𝜎𝜎 is the standard deviation and 𝜇𝜇 is the mean.
To account for the effect of trend in the data, the Cuddy-Della Valle Index was used:
where 𝐶𝐶 2 is the coefficient of determination obtained from the trend regression. The CDVI provides a more reliable measure of instability by eliminating the influence of longterm trend.
Results and Discussion
Trend Fitting A linear trend analysis was conducted to determine the longterm direction and consistency of the medicinal sector's growth between 2003 and 2025. This analysis uses the linear equation y = a + bt, where b represents the annual rate of change (slope). The linear trend analysis confirms that while the Area of medicinal plants has been steadily shrinking over the long term, yield efficiency (Productivity) is struggling to find a consistent upward path. The massive discrepancy in production trends suggests that the sector is highly susceptible to "shocks"-extraordinary years of high output followed by significant drops-making it difficult for the industry to follow a predictable growth trajectory.
Summary of Linear Trend Statistics
Summary of Linear Trend Statistics
Growth Rate Analysis (CAGR) and Instability Analysis (CDVI)
The analysis of medicinal plant cultivation data from 2003 to 2025 provides a comprehensive look at the sector's performance, characterized by significant shifts in growth and stability. The results are summarized in Table and illustrated through comparative growth and instability charts. year span, the overall CAGR for the area is positive at 2.72%, while production growth is stagnant at 0.36%. Productivity, however, shows a long-term negative growth rate of -2.31%, indicating that while more land is being utilized, the average yield per hectare has not kept pace with the expansion.
Instability Analysis (CDVI)
The Cuddy-Della Valle Index (CDVI) provides a clearer picture of the risks associated with medicinal cultivation by adjusting for the trend.
• Production Volatility: Production has remained the most unstable parameter. In Period II (2011-2020), instability reached an alarming index of 224.61, primarily driven by extreme outliers (such as the 53,523 MT spike in 2011 followed by sharp drops). For the entire duration, the production instability index is 341.69, categorized as extremely high instability. • Productivity Stabilization: Interestingly, while productivity was highly unstable in the early years (CDVI of 131.79), it has become significantly more stable in the recent period (2021-2025) with a CDVI of 30.98. This suggests that contemporary farming practices or better crop varieties are leading to more predictable yields despite the rapid expansion in area. • Area Instability: The instability in land allocation reached its peak in the most recent period (100.04), reflecting the rapid and perhaps speculative expansion of medicinal crop farming in the 2020s.
Conclusion
The medicinal plant sector has transitioned from a period of high instability and negative growth to a phase of rapid expansion in the 2020s. While the growth in the last five years is promising, the extreme historical instability in production indicates a fragile supply chain. To sustain the current growth trend, policy measures should focus on crop insurance, price stabilization, and the dissemination of highyield, stress-resistant varieties.
Figures and tables from the paper
| Variable | Annual Change (Slope) | R-squared (R2) | P-value | Significance |
|---|---|---|---|---|
| Area (in ha) | -74.89 | 0.349 | 0.0029 | Significant Decline |
| Production (MT) | -149.06 | 0.008 | 0.6771 | Not Significant |
| Productivity (MT/ha) | +0.049 | 0.036 | 0.3826 | Not Significant |
Table text extracted from the original PDF; superscript letters are shown inline. The original table image is below.
View original table image
| Period | Variable | CAGR (%) | CV (%) | CDVI (Instability) |
|---|---|---|---|---|
| 2003-2010 | Area (in ha) | -5.28 | 40.16 | 28.95 |
| Production (MT) | -30.99 | 145.72 | 110.48 | |
| Productivity (MT/ha) | -27.14 | 158.18 | 131.79 | |
| 2011-2020 | Area (in ha) | -13.01 | 72.12 | 44.17 |
| Production (MT) | -40.1 | 263.37 | 224.61 | |
| Productivity (MT/ha) | -11.1 | 95.48 | 95.21 | |
| 2021-2025 | Area (in ha) | 77.5 | 142.68 | 100.04 |
| Production (MT) | 101.24 | 167.82 | 120.75 | |
| Productivity (MT/ha) | 13.29 | 32.36 | 30.98 | |
| 2003-2025 | Area (in ha) | 2.72 | 73.72 | 59.46 |
| Production (MT) | 0.36 | 343.14 | 341.69 | |
| Productivity (MT/ha) | -2.31 | 123.39 | 121.12 |
Table text extracted from the original PDF; superscript letters are shown inline. The original table image is below.
View original table image
References
8 in the original paper- CCRAS. Recent trends in good agricultural & collection practices for medicinal plants. Central Council for Research in Ayurvedic Sciences, Ministry of AYUSH; 2024.
- Cuddy JDA, Della Valle PA. Measuring the instability of time series data. Oxford Bull Econ Stat. 1978;40(1):79-85.
- Mishra P, Sahu PK, Dhekale BS, Vishwajith KP. Growth and instability analysis of horticultural crops in Haryana: A structural shift approach. Indian J Ext Educ. 2021;57(4):88-93.
- Nimbrayan PK, Singh J, Kumar S, Karwasra R. Growth and instability in area, production and productivity of barley and diversifying crops in Haryana. Curr J Appl Sci Technol. 2019;35(6):1-8.
- Pavani M, Sharon MM, Suseela K. Growth, instability and decomposition analysis of high-value crops in India. Asian J Agric Ext Econ Sociol. 2025;43(3):112-125.
- Sindhuja S, Malik DP. Growth and instability analysis of crop production in Northern India: A zone-wise study. Arch Curr Res Int. 2025;25(9):94-109.
- Thanki PM, Khunt KA, Thumar VM. Economic analysis of production of major medicinal crops. Open Access J Med Aromat Plants. 2011;1(2).
- Yadav SS, Bhandoria MS. Medicinal plant's wealth of Aravalli Hills, Gurgaon District, Haryana, India. Res J Med Plants. 2020;14(3):96-103.