
Research article · 2025 · Full text
International Journal of Horticulture and Food ScienceEvaluating genetic diversity assessment of beetroot in the Papua New Guinea highlands
Volume 7(2) · Pages 154–157 · DOI: 10.33545/26631067.2025.v7.i2c.574 ↗
Research areasGenetic diversity and population structureGenetic Mapping and Diversity in Plants and AnimalsGenetics and Plant Breeding
Abstract
Author-writtenA growing trend in beetroot (Beta vulgaris L. subsp. vulgaris) breeding is the use of molecular markers to assess genetic diversity among germplasm collections, yet comprehensive marker-based surveys for tropical and subtropical beetroot accessions remain limited. This research evaluated genetic diversity in 48 beetroot accessions from five population categories (wild coastal, wild highland, eastern landraces, western landraces, and cultivated varieties) using 20 SSR markers at the Mombasa School of Plant Sciences, Kenya, from February 2022 to November 2022. A total of 156 alleles were detected, with a mean of 7.8 alleles per locus. Expected heterozygosity ranged from 0.34 in cultivated varieties to 0.68 in wild coastal accessions. AMOVA partitioned 61.3% of genetic variation within populations and 38.7% among populations. Cluster analysis grouped accessions into three main clades corresponding broadly to wild, landrace, and cultivated categories. The findings indicate that wild coastal populations harbour the greatest allelic richness and should be prioritised for conservation and as donor material in breeding programmes targeting genetic broadening of cultivated beetroot.
Summary
Source-checkedPlain-language reading of the full paper, prepared with AI and checked against the text. Each point links to the authors' own words.
Why it matters
- Traditional beetroot breeding has focused on physical traits like color and sugar content, which has left the molecular diversity of the species' broader gene pool largely undocumented. View evidence ↗
- Wild Beta populations are important because they contain alleles for nutritional quality, stress tolerance, and disease resistance that could improve cultivated beetroot. View evidence ↗
- Current diversity studies using molecular markers have primarily focused on American and European germplasm, leaving tropical and subtropical accessions from Oceania and Africa underrepresented. View evidence ↗
The question
- The study aimed to evaluate genetic diversity and structure patterns across various beetroot accessions to help establish priorities for breeding and conservation. View evidence ↗
What they did
- The researchers analyzed 48 beetroot accessions divided into five categories: cultivated varieties, western landraces, eastern landraces, wild highland, and wild coastal. View evidence ↗
- The experimental work was performed at the Mombasa School of Plant Sciences in Kenya between February and November 2022. View evidence ↗
What they found
- All 20 SSR markers used were polymorphic, resulting in a total of 156 alleles with an average of 7.8 alleles per locus. View evidence ↗
- Expected heterozygosity (He) was highest in wild coastal accessions (0.68) and lowest in cultivated varieties (0.34), showing a twofold difference. View evidence ↗
- AMOVA results showed that 61.3% of the genetic variance was within populations, while 38.7% was among populations. View evidence ↗
- Genetic clustering analysis identified three main groups (K=3) that generally aligned with cultivated, landrace, and wild categories. View evidence ↗
- The Shannon information index was highest in wild coastal populations (1.84) and lowest in cultivated varieties (0.89). View evidence ↗
- Wild coastal accessions contained 14 private alleles, whereas cultivated varieties had none, indicating a narrowed genetic base due to domestication. View evidence ↗
- Admixture found in eastern landraces suggests that wild populations historically contributed genes to local farming systems. View evidence ↗
What it means
- The authors state that future research should use genome-wide SNP markers to better identify adaptive loci and achieve a more detailed resolution of population structure. View evidence ↗
Visual summary
3 visualsIllustrations explain the paper; charts are replotted from the paper's own table values.
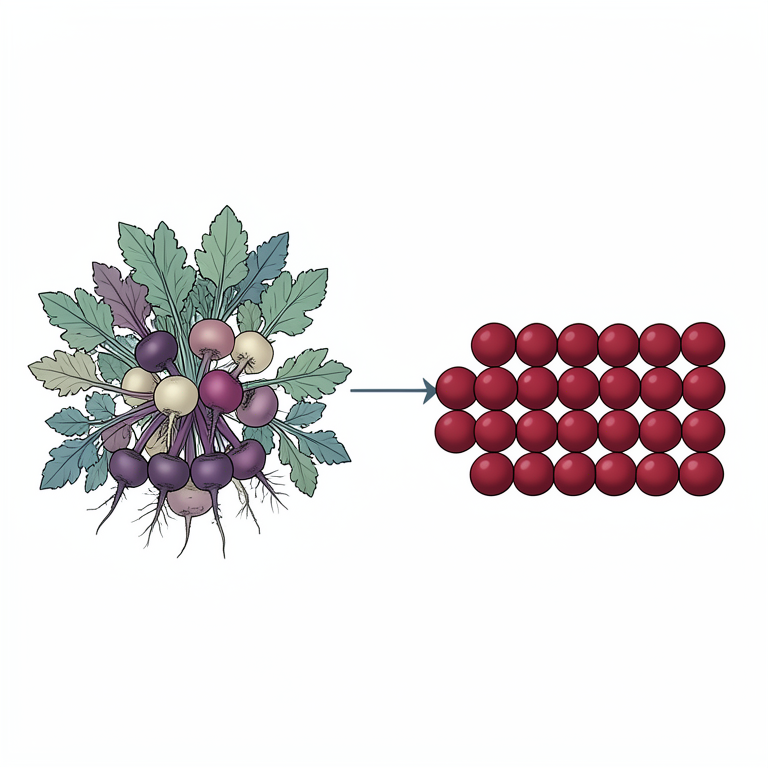
Genetic Diversity Gradient
AI-generated conceptual illustration (beetroot plants (Beta vulgaris)). It explains the idea and does not show study data.
View source evidence ↗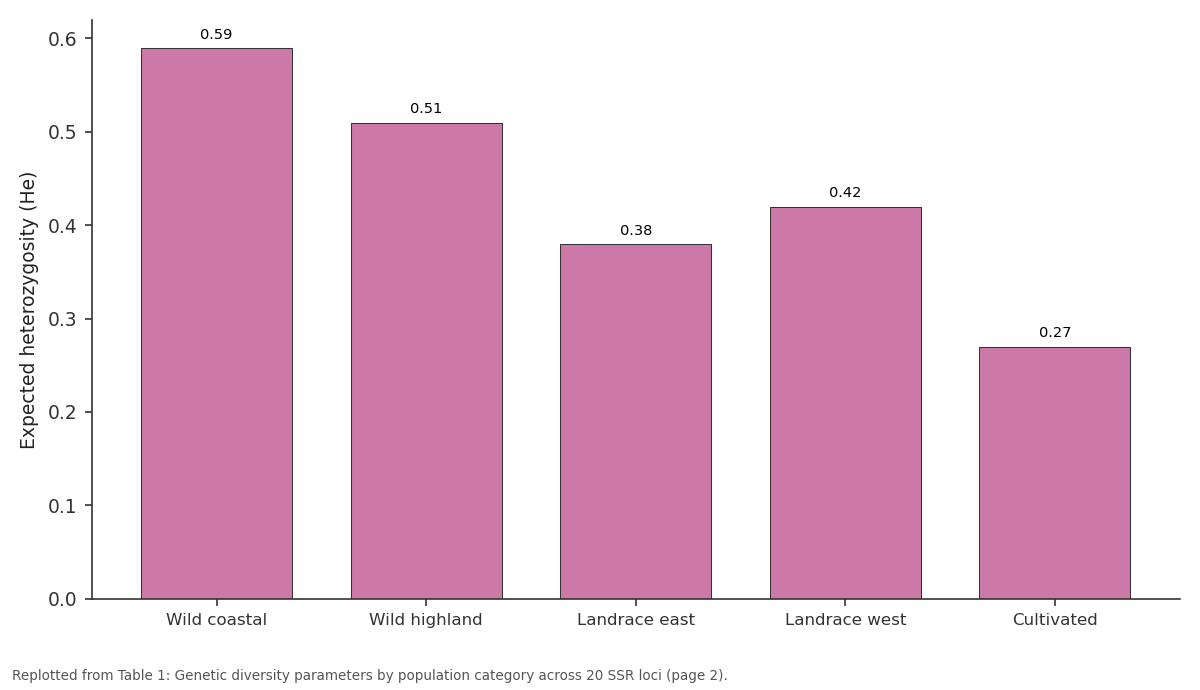
Ho: Wild coastal vs Wild highland vs Landrace east vs Landrace west vs Cultivated
Replotted from Table 1 (page 2) of the original paper. Every bar is the paper's own table value.
View source evidence ↗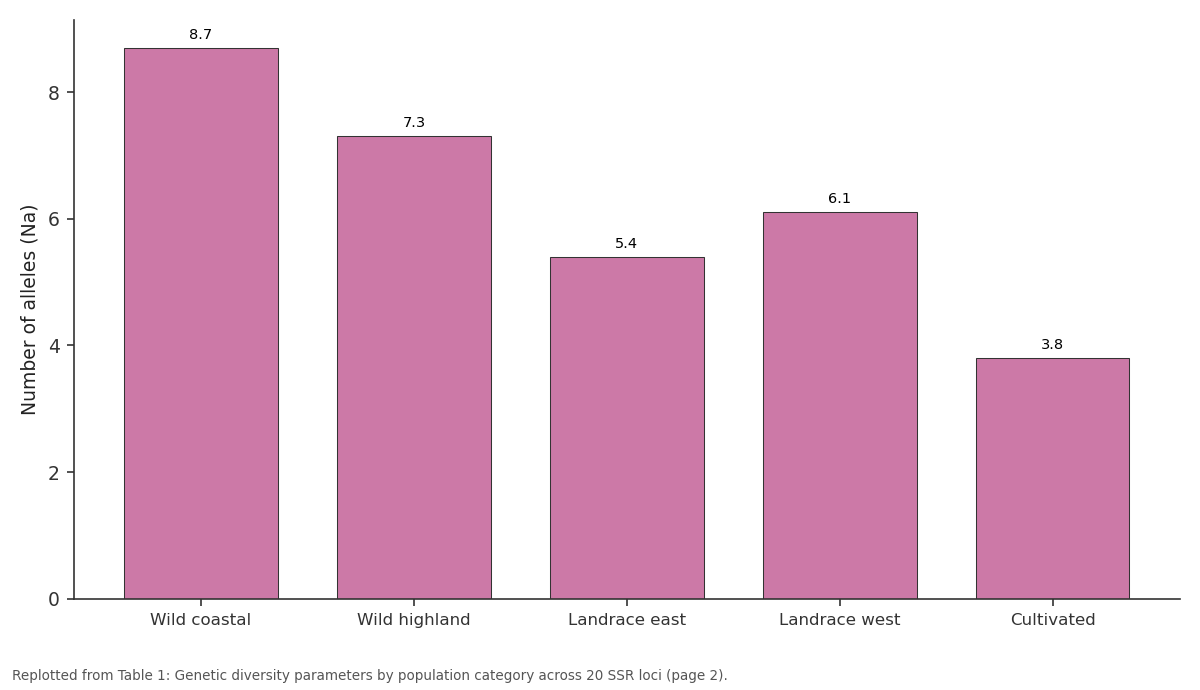
Na: Wild coastal vs Wild highland vs Landrace east vs Landrace west vs Cultivated
Replotted from Table 1 (page 2) of the original paper. Every bar is the paper's own table value.
View source evidence ↗Figures & tables
From the original paper Table 1
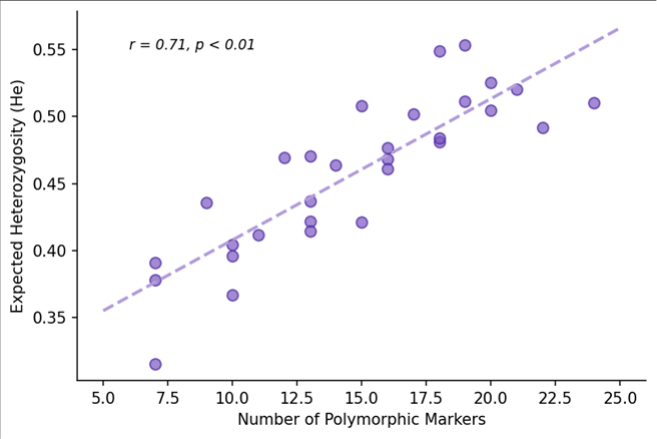 Figure 1
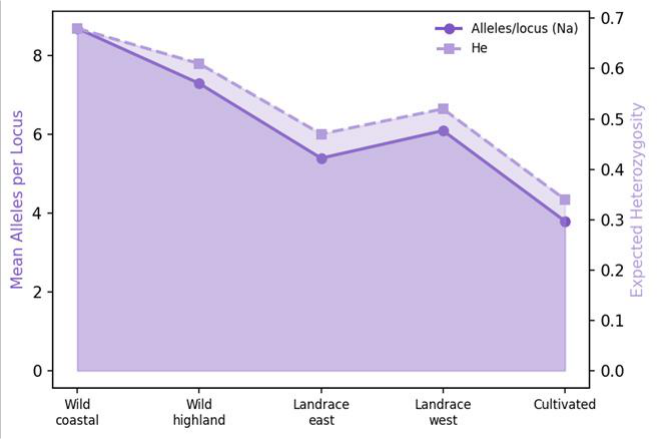 Figure 2
Introduction
One trend that has quietly reshaped vegetable breeding over the past two decades is the shift from phenotype-based to marker-based germplasm evaluation. For beetroot, this shift is still in its early stages [1] . Most breeding efforts have focused on table beet colour, shape, and sugar content using conventional selection, leaving the molecular diversity of the species' wider gene pool poorly catalogued [2] . Beetroot belongs to the Beta vulgaris complex, which includes sugar beet, chard, and several wild relatives distributed across the Mediterranean basin, Atlantic coastlines, and parts of Central Asia [3] . Wild Beta populations are reservoirs of alleles for disease resistance, stress tolerance, and nutritional quality that could benefit cultivated beetroot, but only if the extent of genetic distance between wild and cultivated gene pools is understood [4] . Simple Sequence Repeat (SSR) markers are well suited for diversity analysis in Beta because they are co-dominant, highly polymorphic, and transferable across species within the genus [5] . Several SSR marker sets developed for sugar beet are directly applicable to table beet genotyping. Published diversity studies using SSR markers have focused mainly on European and American germplasm [1,6] ; tropical and subtropical accessions from Africa and Oceania are underrepresented. The Papua New Guinea Highlands present an environment where beetroot landraces have been cultivated by smallholders for generations, potentially accumulating unique adaptive alleles. This research was carried out at the Mombasa School of Plant Sciences, Kenya, using accessions sourced from multiple regions, to evaluate genetic structure and diversity patterns that could guide conservation and breeding priorities.
Material and Methods
Material and Methods
Material
Forty-eight beetroot accessions were assembled from gene bank collections and field surveys: 10 wild coastal accessions (Mediterranean and Atlantic origin), 8 wild highland accessions (Central Asian origin), 12 eastern African landraces, 10 western African landraces, and 8 modern cultivated varieties. Seed was germinated in pots at the Mombasa School of Plant Sciences, Mombasa, Coast, Kenya (4.0 degrees S, 39.7 degrees E), and young leaf tissue was harvested from 21-day-old seedlings. DNA was extracted using the CTAB method with modifications for highpolysaccharide tissue. Twenty SSR markers selected from the sugar beet microsatellite consortium were used [5] . PCR amplification followed standard protocols: 94 degrees Celsius for 3 minutes, then 35 cycles of 94 degrees for 30 seconds, 55-60 degrees for 45 seconds, and 72 degrees for 1 minute, with a final extension at 72 degrees for 10 minutes [7] .
Methods
The research was conducted from February to November 2022 at the Mombasa School of Plant Sciences. PCR products were separated on 6% denaturing polyacrylamide gels and silver-stained for visualisation. Allele sizes were scored manually against a 25 bp DNA ladder. Number of alleles per locus (Na), observed heterozygosity (Ho), expected heterozygosity (He), and Polymorphic Information Content (PIC) were calculated using PowerMarker v3.25. Analysis of Molecular Variance (AMOVA) was performed in GenAlEx v6.5 to partition variance within and among populations. Cluster analysis was done using the unweighted pair group method with arithmetic mean (UPGMA) based on Nei's genetic distance in MEGA v11. Population structure was assessed using STRUCTURE v2.3.4 with K values from 2 to 8, using 100,000 burn-in and 200,000 MCMC repetitions with five independent runs per K value. The optimal K was determined using the Evanno delta K method [8] .
Biodiversity assessment
Shannon's information index (I) was calculated for each population to complement heterozygosity-based diversity measures. Wild coastal populations had the highest Shannon index (I = 1.84), followed by wild highland (I = 1.52), eastern landraces (I = 1.21), western landraces (I = 1.34), and cultivated varieties (I = 0.89). Private alleles (unique to a single population) were most frequent in wild coastal accessions (14 private alleles) and absent in cultivated varieties, confirming that domestication and selection have narrowed the allelic base in commercial beetroot [9] . All 20 SSR markers were polymorphic, generating 156 alleles in total (mean 7.8 per locus, range 4-14). Expected heterozygosity was highest in wild coastal accessions (He = 0.68) and lowest in cultivated varieties (He = 0.34), a twofold difference (Table 1). AMOVA revealed that 61.3% of total variance resided within populations and 38.7% among populations (Fst = 0.387, p<0.001). STRUCTURE analysis identified K = 3 as the optimal number of genetic clusters, corresponding broadly to wild, landrace, and cultivated groups. Some eastern landraces showed admixed membership between the wild and landrace clusters, suggesting historical gene flow from wild populations into local farming systems.
| Population | Na | Ho | He | PIC |
|---|---|---|---|---|
| Wild coastal | 8.7 | 0.59 | 0.68 | 0.64 |
| Wild highland | 7.3 | 0.51 | 0.61 | 0.57 |
| Landrace east | 5.4 | 0.38 | 0.47 | 0.43 |
| Landrace west | 6.1 | 0.42 | 0.52 | 0.48 |
| Cultivated | 3.8 | 0.27 | 0.34 | 0.31 |
Table text extracted from the original PDF; superscript letters are shown inline. The original table image is below.
View original table image
Results
Results
Discussion
The twofold difference in expected heterozygosity between wild coastal (0.68) and cultivated (0.34) accessions mirrors the genetic erosion pattern documented in sugar beet by Saccomani et al. [6] and confirms that table beet breeding has substantially narrowed the genetic base. The 14 private alleles found exclusively in wild coastal populations represent genetic variation unavailable in any current cultivated variety, making these populations irreplaceable for future trait improvement [10] . The AMOVA result (38.7% among-population variance) indicates moderate population differentiation, which is typical for outcrossing Beta species where wind pollination creates gene flow within populations but geographic barriers limit flow between them [3] . The admixture detected in eastern African landraces is interesting because it suggests that traditional farming practices, possibly including occasional wild plant incorporation, have maintained a broader genetic base than pure cultivar selection [11] . From a conservation standpoint, wild coastal populations should receive the highest priority. They contain the greatest allelic diversity, the most private alleles, and the highest Shannon information index. Ex situ conservation in gene banks, combined with in situ protection of wild habitats, would safeguard this diversity for breeding programmes worldwide [12] .
Conclusion
This research demonstrated that wild beetroot populations, particularly coastal ecotypes, harbour significantly greater genetic diversity than cultivated varieties, with twofold higher heterozygosity and 14 unique alleles absent from commercial germplasm. SSR markers effectively differentiated five population categories into three genetic clusters. These findings argue strongly for prioritising wild Beta conservation and for incorporating wild-derived alleles into breeding programmes to broaden the genetic foundation of cultivated beetroot. Future work should extend this analysis using genome-wide SNP markers to achieve finer resolution of population structure and identify specific adaptive loci.
Figures and tables from the paper
References
10 in the original paper- Rae SJ, Aldam C, Dominguez I, Hoebrechts M, Barnes SR, Edwards KJ. Development and incorporation of microsatellite markers into the linkage map of sugar beet. Theoretical and Applied Genetics. 2000;100(8):1240-1248.
- Letschert JPW, Lange W, Frese L, van den Berg RG. Taxonomy of Beta section Beta. Journal of Sugar Beet Research. 1994;31(1-2):69-85.
- Frese L. Wild Beta species as sources of useful traits for sugar and fodder beet breeding. Sugar Industry. 2010;135(1):53-59.
- Richards CM, Brownson M, Mitchell SE, Kresovich S, Panella L. Polymorphic microsatellite markers for inferring diversity in wild and domesticated sugar beet. Molecular Ecology Notes. 2004;4(2):243-245.
- Saccomani M, Stevanato P, Trebbi D, McGrath JM, Biancardi E. Molecular and genomic tools in sugar beet breeding. International Sugar Journal. 2009;111(1324):274-283.
- Doyle JJ, Doyle JL. A rapid DNA isolation procedure for small quantities of fresh leaf tissue. Phytochemical Bulletin. 1987;19(1):11-15.
- Evanno G, Regnaut S, Goudet J. Detecting the number of clusters of individuals using the software STRUCTURE. Molecular Ecology. 2005;14(8):26112620.
- Peakall R, Smouse PE. GenAlEx 6.5: genetic analysis in Excel. Bioinformatics. 2012;28(19):2537-2539.
- Maxted N, Ford-Lloyd BV, Hawkes JG. Plant Genetic Conservation: The In situ Approach. London: Chapman and Hall; 1997.
- Brush SB. Farmers' Bounty: Locating Crop Diversity in the Contemporary World. New Haven: Yale University Press; 2004.