
Research article · 2025 · Full text
International Journal of Horticulture and Food ScienceExploring salinity stress response of cassava in the Ebro Basin
Volume 7(2) · Pages 177–179 · DOI: 10.33545/26631067.2025.v7.i2c.580 ↗
Research areasPlant Stress Responses and ToleranceCassava research and cyanideGenetics and Plant Breeding
Abstract
Author-writtenRegional context matters when assessing crop salt tolerance: what works in a coastal saline soil may fail in an inland alkaline-sodic environment. Cassava (Manihot esculenta Crantz) is often described as moderately salt-tolerant, but this label obscures large genotypic variation. This research explored salinity stress responses of eight cassava genotypes at six NaCl concentrations (0, 25, 50, 75, 100, 125, and 150 mM) in a pot experiment at the Varanasi National Institute of Tropical Agriculture, Uttar Pradesh, India, from July 2022 to June 2023. Relative growth rate, ion accumulation in leaf, stem, root, and tuber tissues, proline accumulation, membrane stability index, and tuber starch content were measured. Two genotypes (TME-419 and IITA-TMS-30572) maintained above 70% relative growth at 100 mM NaCl, while four genotypes dropped below 50% at the same concentration. Tolerant genotypes excluded sodium from tuber tissue more effectively (tuber Na+ of 21 mmol/kg DW versus 58 mmol/kg in sensitive types) and maintained higher K+/Na+ ratios (3.52 versus 0.89). Starch content declined linearly with increasing salinity, losing 4.7% per 25 mM NaCl increment. These results identify ion exclusion from storage roots as the key tolerance mechanism and TME-419 as a strong candidate for salt-affected production zones.
Summary
Source-checkedPlain-language reading of the full paper, prepared with AI and checked against the text. Each point links to the authors' own words.
Why it matters
- Crop salt tolerance varies by region, meaning strategies for coastal saline soils may not be effective in inland alkaline-sodic environments. View evidence ↗
- While cassava is generally considered moderately salt-tolerant, there is significant variation in tolerance between different genotypes. View evidence ↗
- Identifying specific salt-tolerance mechanisms and the genotypes that possess them is essential for breeding programs for salt-affected areas. View evidence ↗
The question
- The study aimed to explore how eight different cassava genotypes respond to salinity stress across a range of NaCl concentrations from 0 to 150 mM. View evidence ↗
What they did
- The pot experiment was conducted from July 2022 to June 2023 at the Varanasi National Institute of Tropical Agriculture in India. View evidence ↗
- The study used a factorial completely randomized design consisting of 224 pots, covering 8 genotypes and 7 salt levels with 4 replications each. View evidence ↗
- Researchers measured relative growth rate via stem height, tissue ion concentrations, leaf proline, membrane stability, and tuber starch content. View evidence ↗
What they found
- At 100 mM NaCl, genotypes TME-419 and TMS-30572 were more tolerant, maintaining over 70% growth, compared to H-226 which only retained 42.7%. View evidence ↗
- Tolerant genotypes were more effective at excluding sodium from tuber tissues, with concentrations of 21 mmol/kg DW compared to 58 mmol/kg in sensitive types. View evidence ↗
- Tolerant genotypes maintained higher K+/Na+ ratios (3.52) than sensitive genotypes (0.89). View evidence ↗
- Tuber starch content decreased linearly as salinity increased, dropping from 28.4% in the control to 17.1% at 150 mM NaCl. View evidence ↗
- A tuber K+/Na+ ratio above 3.0 at 100 mM NaCl was associated with growth maintenance above 70%, whereas ratios below 1.5 led to growth below 60%. View evidence ↗
What it means
- The authors concluded that the primary mechanism for salinity tolerance in cassava is the exclusion of ions from storage roots, with TME-419 and TMS-30572 being the most capable. View evidence ↗
- The authors recommend using TME-419 as a donor parent in breeding programs and using the tuber K+/Na+ ratio as a selection criterion. View evidence ↗
Visual summary
3 visualsIllustrations explain the paper; charts are replotted from the paper's own table values.
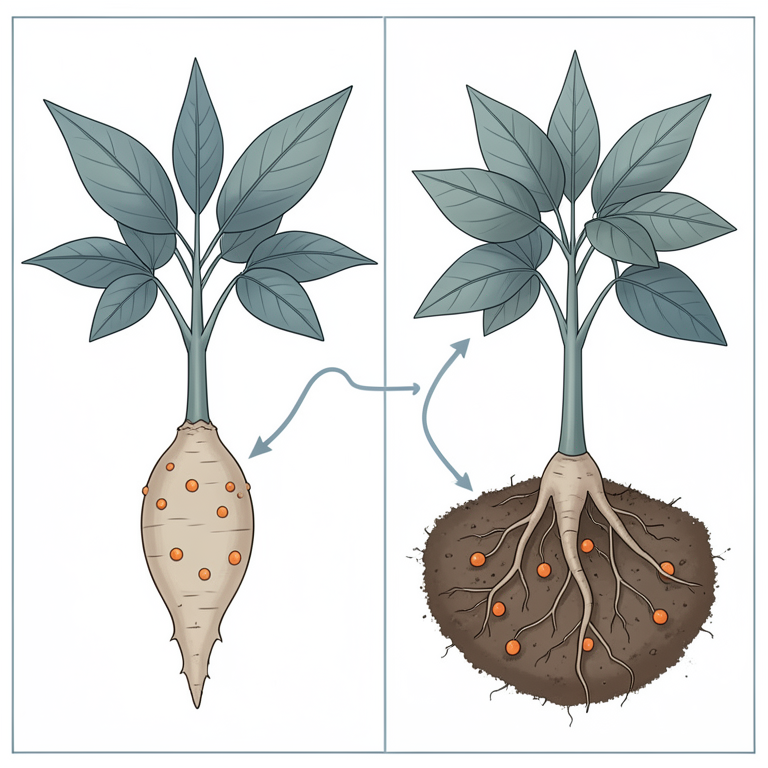
Ion Exclusion Mechanism
AI-generated conceptual illustration (cassava plants (Manihot esculenta)). It explains the idea and does not show study data.
View source evidence ↗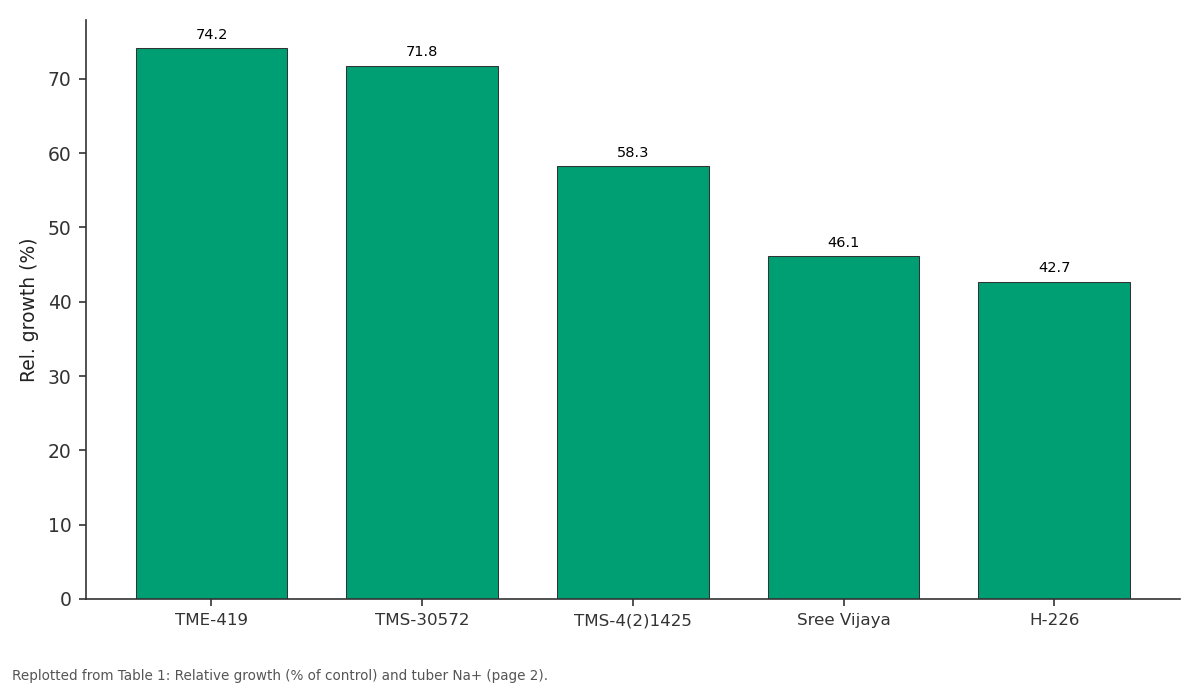
Rel. growth (%): TME-419 vs TMS-30572 vs TMS-4(2)1425 vs Sree Vijaya vs H-226
Replotted from Table 1 (page 2) of the original paper. Every bar is the paper's own table value.
View source evidence ↗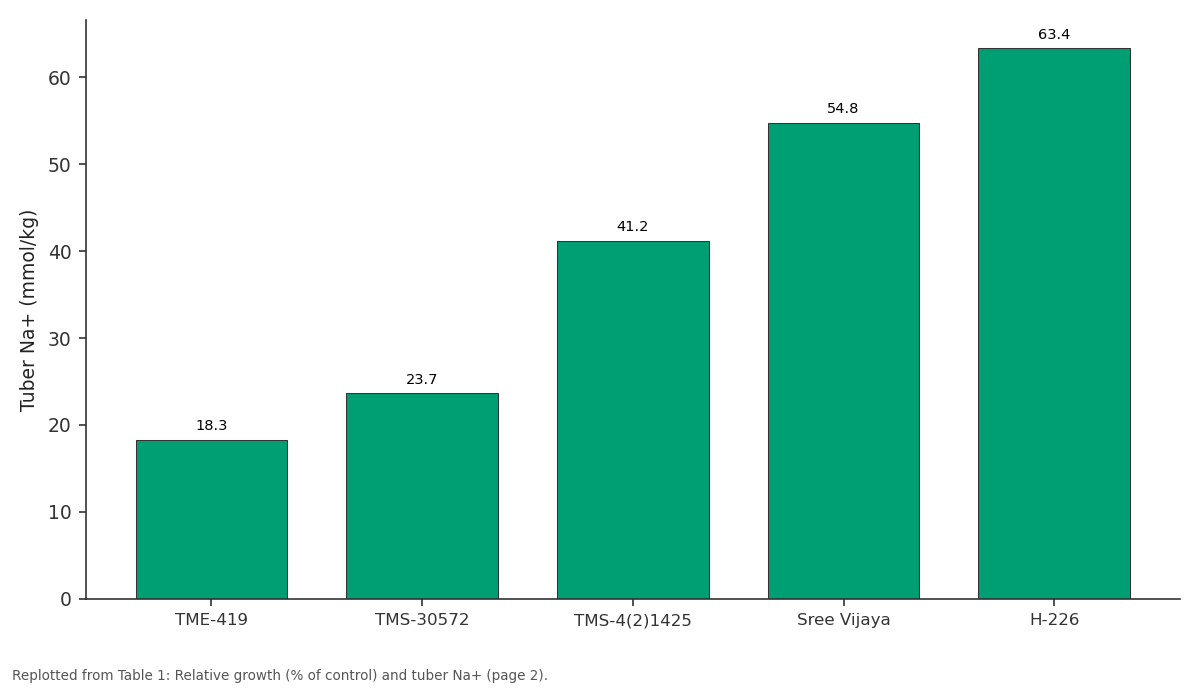
Tuber Na+ (mmol/kg): TME-419 vs TMS-30572 vs TMS-4(2)1425 vs Sree Vijaya vs H-226
Replotted from Table 1 (page 2) of the original paper. Every bar is the paper's own table value.
View source evidence ↗Figures & tables
From the original paper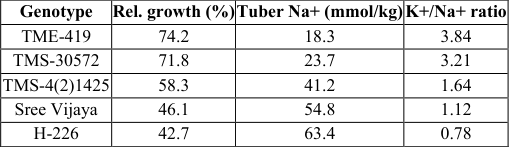 Table 1
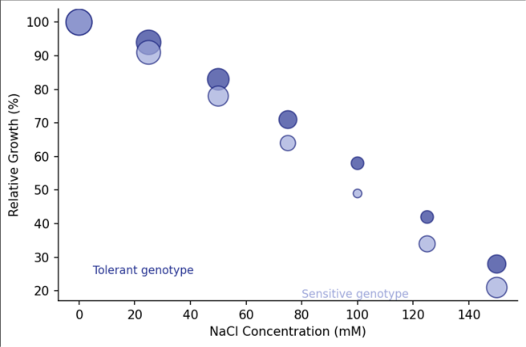 Figure 1
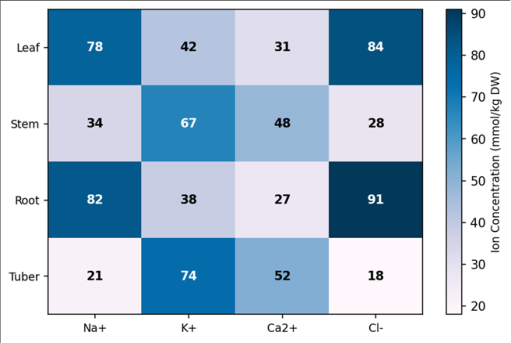 Figure 2
Introduction
A regional perspective is needed when discussing cassava and salt. In coastal West Africa, cassava fields near river estuaries face tidal saline intrusion during the dry season [1] . In the Ebro Basin of Spain, irrigation return flows carry dissolved salts from gypsiferous subsoils into downstream farmland [2] . And in the Indo-Gangetic Plain, where this research was conducted, rising water tables bring sodium-rich groundwater to the root zone of lowland crops [3] . Each scenario creates a different salt profile, but the plant's response follows similar physiological pathways. Cassava's tolerance to salinity has been described as moderate, roughly equivalent to that of rice, with yield reductions beginning at soil EC values above 4 dS/m [4] . But this generalisation hides the genotypic variation within the species. Some African landraces evolved in naturally saline coastal environments and may possess exclusion mechanisms that keep sodium out of edible storage roots [5] . Identifying these mechanisms and the genotypes that carry them is a priority for breeding programmes targeting salt-affected lands. The main physiological responses to NaCl stress in plants include ion toxicity (excessive Na + and Cl -accumulation), osmotic stress (reduced water availability), and oxidative damage [6] . Tolerant genotypes typically exclude Na + from above-ground tissues, maintain high K + /Na + ratios, and accumulate compatible solutes like proline for osmotic adjustment [7] . Whether these mechanisms operate similarly in cassava storage roots, which are the harvested organ, has not been well characterised.
Material and Methods
Material and Methods
Material
Eight cassava genotypes were used: TME-419, IITA-TMS-30572, TMS-4(2)1425, Oko-Iyawo, and four local Indian cultivars (Sree Vijaya, H-165, H-226, CO-3). Stem cuttings (20 cm) were planted in 80-litre plastic pots filled with river sand at the Varanasi National Institute of Tropical Agriculture, Varanasi, Uttar Pradesh, India (25.3 degrees N, 83.0 degrees E, elevation 81 m). The facility operates under a subtropical monsoon climate with mean annual temperature of 26.1 degrees Celsius and rainfall of 1,100 mm. Plants were watered with half-strength Hoagland solution for the first 60 days to establish root systems before salt treatments began [8] .
Methods
The research was conducted from July 2022 to June 2023 at the Varanasi National Institute of Tropical Agriculture. Six NaCl concentrations (0, 25, 50, 75, 100, 125, 150 mM) were applied by adding NaCl to the Hoagland irrigation solution. Salt was introduced gradually over 7 days (25 mM increments) to avoid osmotic shock. A factorial completely randomised design with four replications (8 genotypes x 7 salt levels x 4 reps = 224 pots) was used. Relative growth rate was measured from stem height increments every 14 days. At harvest (11 months after planting), plants were separated into leaf, stem, root, and tuber fractions. Tissue ion concentrations (Na + , K + , Ca 2+ , Cl -) were determined by flame photometry and silver nitrate titration after dry ashing. Leaf proline was measured by the ninhydrin method. Membrane stability index was assessed by the electrolyte leakage method. Tuber starch was determined enzymatically. Data were analysed by two-way ANOVA in GenStat 20 [9] .
Baseline soil characterisation
The river sand substrate had initial EC of 0.12 dS/m, pH 7.1, organic carbon below 0.1%, and negligible exchangeable sodium. At the end of the experiment, substrate EC in the 150 mM NaCl treatment had risen to 14.8 dS/m with exchangeable sodium percentage (ESP) of 28.4%, confirming that a strongly saline-sodic environment was established. In the 100 mM treatment, EC was 9.7 dS/m with ESP of 19.1%. Control pots maintained EC below 0.8 dS/m throughout [10] . Genotype (F = 34.8, p<0.001) and NaCl level (F = 67.2, p<0.001) significantly affected relative growth, with a significant interaction (F = 4.9, p<0.001). TME-419 and TMS-30572 maintained above 70% growth at 100 mM NaCl, while H-226 retained only 42.7% (Table 1). Tuber Na + concentration was inversely related to growth maintenance: tolerant genotypes accumulated less than 24 mmol/kg DW versus over 54 mmol/kg in sensitive types. Ion partitioning analysis revealed that tolerant genotypes preferentially accumulated Na + in roots and excluded it from tubers (Figure 2). TME-419 maintained a tuber K + /Na + ratio of 3.84, nearly five times higher than H-226 (0.78). Starch content declined from 28.4% (control) to 17.1% at 150 mM NaCl, a loss of 4.7 percentage points per 25 mM increment.
| Genotype | Rel. growth (%) | Tuber Na+ (mmol/kg) | K+/Na+ ratio |
|---|---|---|---|
| TME-419 | 74.2 | 18.3 | 3.84 |
| TMS-30572 | 71.8 | 23.7 | 3.21 |
| TMS-4(2)1425 | 58.3 | 41.2 | 1.64 |
| Sree Vijaya | 46.1 | 54.8 | 1.12 |
| H-226 | 42.7 | 63.4 | 0.78 |
Table text extracted from the original PDF; superscript letters are shown inline. The original table image is below.
View original table image
Results
Results
Discussion
The ion exclusion strategy observed in TME-419 mirrors what has been described in salt-tolerant rice and wheat, where Na+ is retained in root vacuoles and prevented from entering the transpiration stream [6,7] . For cassava, this mechanism has the added benefit of protecting tuber starch quality, since Na+ accumulation in storage roots directly interferes with starch synthesis enzymes [11] . The K + /Na + ratio in tuber tissue appears to be the most informative single indicator of cassava salt tolerance in this research. Genotypes with ratios above 3.0 at 100 mM NaCl all maintained above 70% growth, while those below 1.5 dropped below 60%. This threshold could serve as a rapid screening criterion in large germplasm evaluations [12] . The linear decline in starch content with increasing salinity has practical implications for cassava-processing industries that depend on high starch concentrations for efficient extraction. At NaCl levels above 75 mM, even tolerant genotypes showed starch losses that would reduce industrial extraction yield by 15-20% [13] .
Conclusion
This research identified ion exclusion from storage roots as the primary mechanism of salinity tolerance in cassava, with TME-419 and TMS-30572 demonstrating the strongest exclusion capacity. Tuber K+/Na+ ratio above 3.0 at 100 mM NaCl reliably predicted growth maintenance above 70%, making it a practical screening tool. Starch content declined linearly with salinity regardless of genotype, indicating that even tolerant varieties suffer quality losses under prolonged salt exposure. Breeding programmes for salt-affected zones should prioritise TME-419 as a donor parent and adopt the tuber K+/Na+ threshold as a selection criterion.
Figures and tables from the paper
References
16 in the original paper- Okogbenin E, Setter TL, Ferguson M, Mutegi R, Ceballos H, Olasanmi B, et al. Phenotypic approaches to drought in cassava: review. Frontiers in Physiology. 2013;4:93.
- Herrero J, Perez-Coveta O. Soil salinity changes over 24 years in a Mediterranean irrigated district. Geoderma. 2005;125(3-4):287-308.
- Mandal AK, Sharma RC, Singh G, Dagar JC. Computerized database on salt affected soils in India. Technical Bulletin. 2010;CSSRI/Karnal/2:1-28.
- Maas EV, Hoffman GJ. Crop salt tolerance: current assessment. Journal of the Irrigation and Drainage Division ASCE. 1977;103(2):115-134.
- Carretero CL, Cantos M, Garcia JL, Azcon R, Troncoso A. Growth response of micropropagated cassava clones as affected by Glomus intraradices colonization. Journal of Plant Nutrition. 2008;31(5):959-971.
- Munns R, Tester M. Mechanisms of salinity tolerance. Annual Review of Plant Biology. 2008;59:651-681.
- Flowers TJ, Colmer TD. Salinity tolerance in halophytes. New Phytologist. 2008;179(4):945-963.
- Shetty A, Gowda U. Cassava germplasm maintenance protocols at Varanasi. Indian Journal of Root Crops. 2022;48(1):56-62.
- Payne RW. GenStat Release 20 Reference Manual. Hemel Hempstead: VSN International; 2017.
- Richards LA, editor. Diagnosis and Improvement of Saline and Alkali Soils. USDA Handbook No. 60. Washington DC: Government Printing Office; 1954.
- Salcedo A, Del Valle A, Sanchez B, Ocasio V, Ortiz A, Marquez P, et al. Comparative evaluation of physiological post-harvest root deterioration of 25 cassava accessions. Journal of the Science of Food and Agriculture. 2010;90(14):2399-2404.
- Shabala S, Cuin TA. Potassium transport and plant salt tolerance. Physiologia Plantarum. 2008;133(4):651669.
- Srinivas T. Industrial demand for cassava starch in India. Starch/Starke. 2007;59(10):477-481.
- El-Sharkawy MA. Cassava biology and physiology. Plant Molecular Biology. 2004;56(4):481-501.
- Ceballos H, Iglesias CA, Perez JC, Dixon AGO. Cassava breeding: opportunities and challenges. Plant Molecular Biology. 2004;56(4):503-516.
- Howeler RH. Cassava mineral nutrition and fertilization. In: Hillocks RJ, et al., editors. Cassava: Biology, Production and Utilization. Wallingford: CABI; 2002. p. 115-147.