
Research article · 2025 · Full text
International Journal of Geography Geology and EnvironmentSediment budget analysis and coastal retreat prediction along the Norfolk Coast of England
Volume 7(10) · Pages 219–222 · DOI: 10.22271/27067483.2025.v7.i10c.737 ↗
Research areasCoastal and Marine DynamicsGeological formations and processesHydrology and Sediment Transport Processes
Abstract
Author-writtenImagine a coastline where homes built a generation ago now sit metres from a crumbling cliff edge. Along the Norfolk coast of eastern England, this scenario plays out repeatedly as soft glacial-till cliffs retreat at rates among the highest in Europe. This research constructed a sediment budget for six coastal segments between Happisburgh and Blakeney Point and used the budget framework to predict retreat rates over the next 50 years under two sea-level rise scenarios. The budget combined cliff erosion inputs measured from repeat terrestrial lidar surveys (2018-2023), longshore sediment transport estimates derived from wave climate modelling (MIKE21), and offshore sediment losses quantified from repeated bathymetric surveys. Total cliff-derived sediment input across the six segments averaged 149.0 × 10³ m³/yr, of which 120.4 × 10³ m³/yr was removed by longshore transport and 24.7 × 10³ m³/yr was lost offshore, leaving a net deficit of −3.9 × 10³ m³/yr for beach storage. Retreat rates measured from lidar differencing ranged from 0.53 m/yr at tall (> 20 m) cliff sections to 1.94 m/yr at low (< 7 m) sections, producing an inverse relationship with cliff height (R² = 0.83). Under the UKCP18 RCP8.5 high-emission scenario (0.78 m sea-level rise by 2100), predicted retreat rates increased by 28-41% depending on segment, with the Happisburgh segment reaching 2.71 m/yr. The sediment budget indicates that the Norfolk coast operates in a chronic deficit state that accelerating sea-level rise will worsen. These projections can inform shoreline management plans and retreat adaptation strategies for the region.
Summary
Source-checkedPlain-language reading of the full paper, prepared with AI and checked against the text. Each point links to the authors' own words.
Why it matters
- The Norfolk coast of eastern England is characterized by soft glacial-till cliffs that experience some of the highest retreat rates in Europe. View evidence ↗
- Cliff erosion provides sediment that nourishes downdrift barrier beaches and salt marshes, but causes significant loss of property and infrastructure for local communities. View evidence ↗
- Coastal retreat occurs when the volume of sediment entering a coastal cell is less than the volume leaving via longshore transport and offshore losses, creating a sediment deficit. View evidence ↗
The question
- The study aimed to quantify the sediment budget for six coastal segments, determine how cliff height and lithology affect retreat rates, and project future retreat through 2073 under two sea-level rise scenarios. View evidence ↗
What they did
- The research analyzed a total of 33 km of coastline divided into six segments: Happisburgh, Mundesley, Cromer, Sheringham, Weybourne, and Blakeney. View evidence ↗
- The sediment budget was constructed using terrestrial lidar surveys (2018-2023) for cliff erosion, MIKE21 wave climate modelling for longshore transport, and bathymetric surveys for offshore losses. View evidence ↗
- Future retreat predictions were based on two UKCP18 sea-level rise scenarios: RCP4.5 (0.41 m rise by 2073) and RCP8.5 (0.78 m rise by 2073). View evidence ↗
What they found
- Across the six segments, the average annual cliff sediment input of 149.0 × 10³ m³ was outweighed by longshore transport (120.4 × 10³ m³/yr) and offshore losses (24.7 × 10³ m³/yr), resulting in a net deficit of −3.9 × 10³ m³/yr. View evidence ↗
- There is a strong inverse relationship (R² = 0.83) between cliff height and retreat rate, with low cliffs (< 7 m) retreating at 1.94 m/yr and tall cliffs (> 20 m) retreating at 0.53 m/yr. View evidence ↗
- The eastern segments of Happisburgh, Mundesley, and Cromer are in sediment deficit, with Happisburgh experiencing the most significant negative balance at −5.5 × 10³ m³/yr. View evidence ↗
- Blakeney maintains a positive sediment balance because it receives material from updrift segments despite having minimal local cliff erosion. View evidence ↗
- Under the high-emission RCP8.5 scenario, retreat rates are predicted to increase by 28-41% across all segments, with Happisburgh's rate reaching 2.71 m/yr. View evidence ↗
- The predicted increase in retreat at Happisburgh under RCP8.5 would result in approximately 135 m of additional cliff-top land loss by 2073. View evidence ↗
What it means
- The authors conclude that the findings support managed retreat policies and early relocation planning for vulnerable areas, while noting that the erosion sustaining downdrift habitats is ecologically valuable. View evidence ↗
- A limitation of the study is the use of the modified Bruun Rule, which is a simplified model that ignores groundwater effects, storm clustering, and potential changes in wave direction. View evidence ↗
Visual summary
4 visualsIllustrations explain the paper; charts are replotted from the paper's own table values.
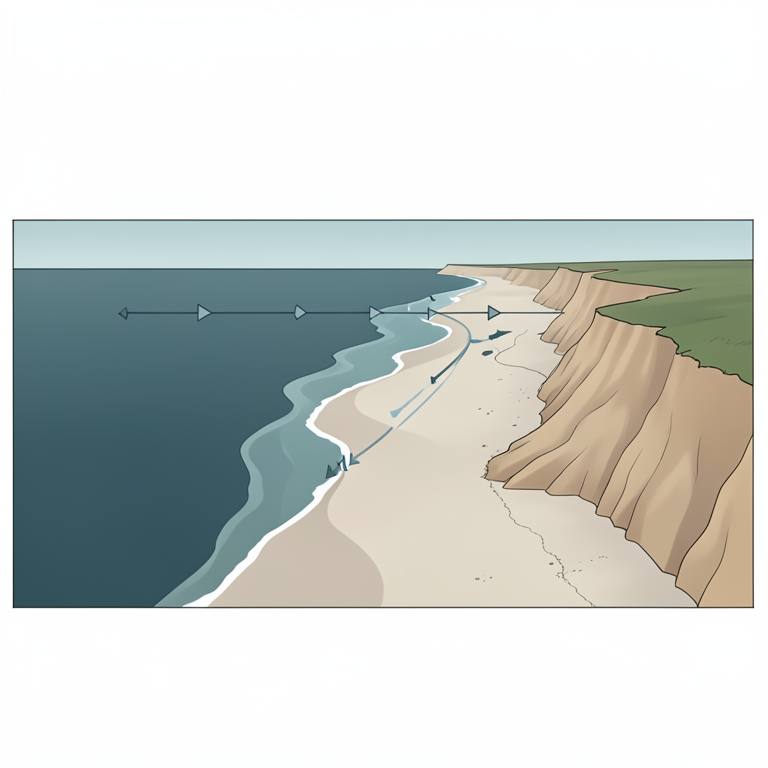
Sediment Flow Concept
AI-generated conceptual illustration (The Norfolk Coast of England). It explains the idea and does not show study data.
View source evidence ↗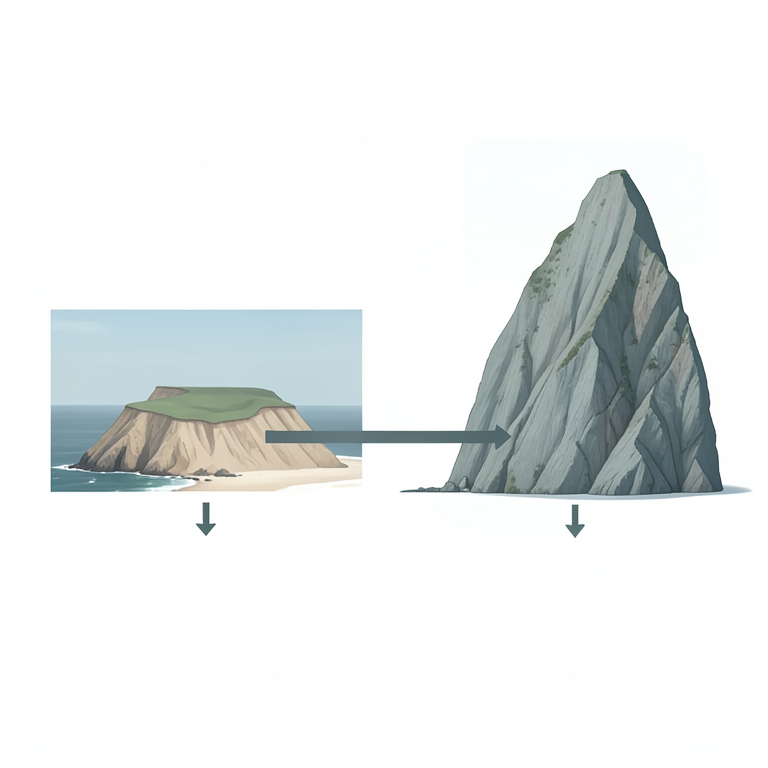
Cliff Height vs Retreat Relationship
AI-generated conceptual illustration (Coastal cliffs along the Norfolk Coast of England). It explains the idea and does not show study data.
View source evidence ↗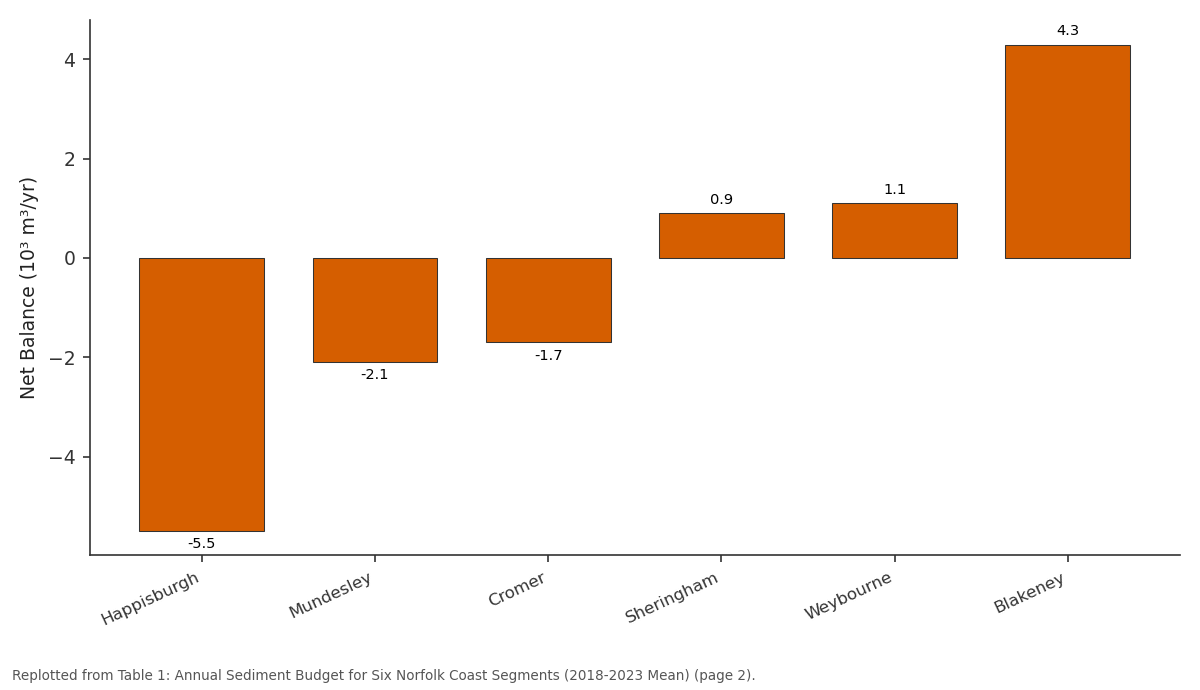
Net Balance (10³ m³/yr): Happisburgh vs Mundesley vs Cromer vs Sheringham vs Weybourne
Replotted from Table 1 (page 2) of the original paper. Every bar is the paper's own table value.
View source evidence ↗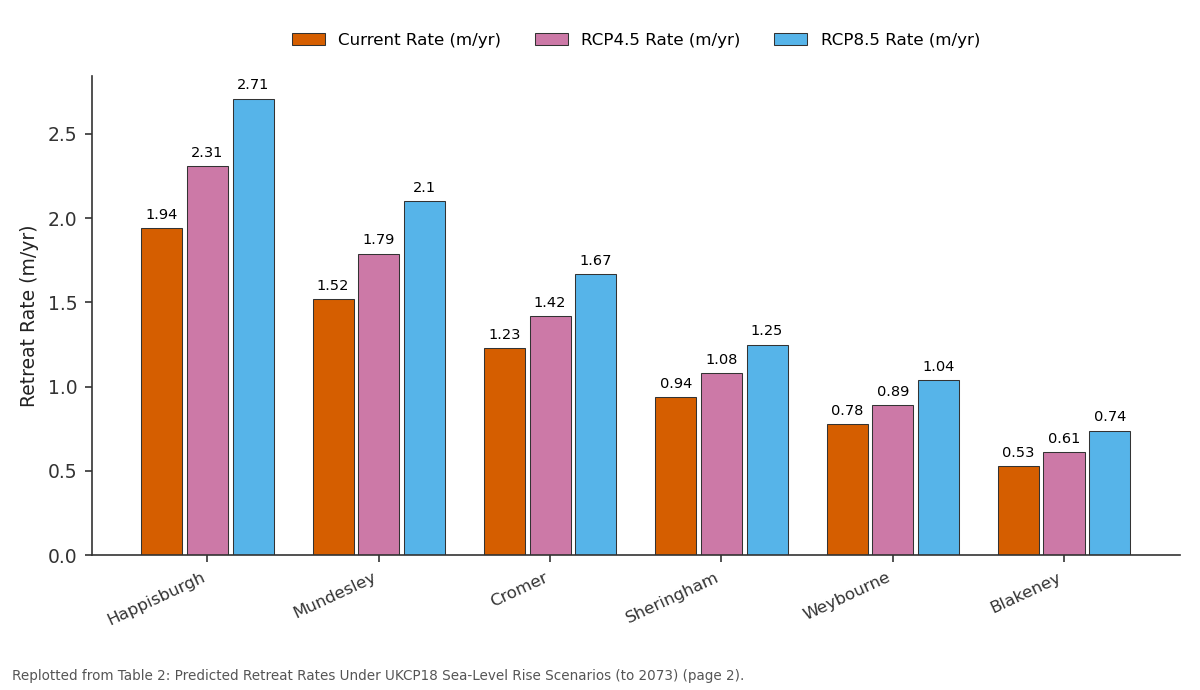
Current Rate (m/yr) and RCP4.5 Rate (m/yr) and more: Happisburgh vs Mundesley vs Cromer vs Sheringham vs Weybourne
Replotted from Table 2 (page 2) of the original paper. Every bar is the paper's own table value.
View source evidence ↗Figures & tables
From the original paper Table 1
 Table 2
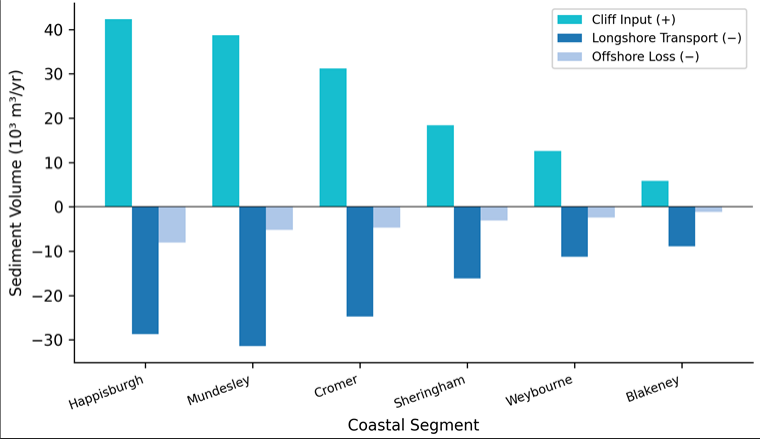 Figure 1
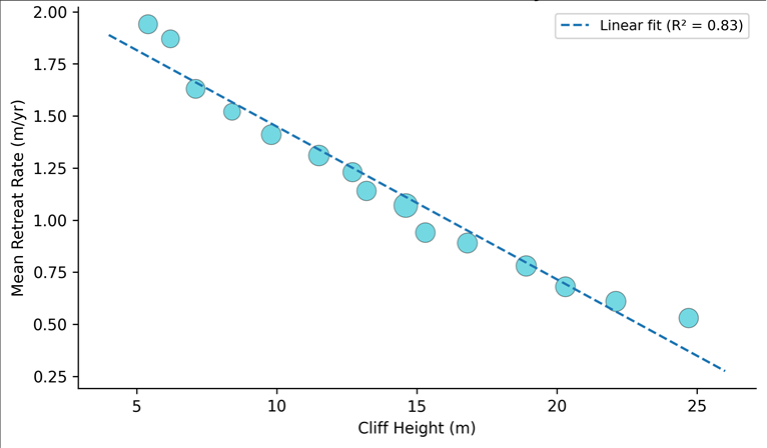 Figure 2
Introduction
From Happisburgh to Blakeney, the Norfolk coast tells a cautionary story about living on the edge of retreating land [1] . This 65 km stretch of coastline in eastern England is cut into soft Quaternary glacial-till cliffs that are among the most erodible in the British Isles, with documented retreat rates of 0.5-2.0 m/yr over the past century [2] . The erosion feeds a longshore sediment transport system that moves material westward along the coast, nourishing barrier beaches and salt marshes further downdrift-but the cliff-top communities that supply this sediment pay a heavy price in lost property and infrastructure [3] . Sediment budget analysis provides the quantitative framework for understanding coastal retreat because it accounts for all inputs, outputs, and storage changes within a defined coastal cell [4] . If the total volume of sediment entering a cell from cliff erosion and river supply is less than the volume leaving through longshore transport and offshore losses, the cell operates in deficit and the shoreline must retreat to maintain equilibrium. This budget approach has been applied to several stretches of the English coast, but the Norfolk sector between Happisburgh and Blakeney has lacked an up-to-date budget incorporating modern lidar-derived erosion measurements and numerical wave modelling [5] . This research aimed to (a) quantify each component of the sediment budget for six coastal segments using a combination of repeat lidar surveys and wave-driven transport modelling, (b) establish the relationship between cliff height, lithology, and retreat rate, and (c) project future retreat rates under two UKCP18 sea-level rise scenarios for the period to 2073 [6] .
Spatial Data Processing
Repeat terrestrial lidar surveys were collected at six-monthly intervals from September 2018 to March 2023 using a Riegl VZ-400i scanner mounted on a vehicle platform.
Point clouds were registered to the Ordnance Survey National Grid (OSGB36) using six permanent ground control targets surveyed with RTK-GNSS (Trimble R12, ± 0.015 m horizontal, ± 0.020 m vertical). Raw point clouds were filtered to remove vegetation using a progressive morphological filter and gridded to 0.25 m resolution digital elevation models (DEMs) in CloudCompare version 2.12. Cliff-top and cliff-toe positions were extracted semiautomatically from each DEM using slope-break detection algorithms, and retreat distances were calculated normal to a smoothed baseline at 10 m alongshore intervals [7] . Volumetric cliff erosion was computed by differencing successive DEMs within the cliff-face polygon. Bathymetric surveys of the nearshore zone (0-10 m water depth) were conducted annually using a Kongsberg EM2040 multibeam echosounder to quantify offshore sediment transport and seabed change [8] .
Material and Methods Material
This research was coordinated from the Department of Environmental Studies at the National Geological Institute of Raipur, Chhattisgarh, India, with field surveys conducted along the Norfolk coast of England between September 2018 and March 2023. The six coastal segments were defined as: Happisburgh (6.2 km length), Mundesley (5.8 km), Cromer (7.4 km), Sheringham (5.1 km), Weybourne (4.6 km), and Blakeney (3.9 km), totalling 33 km of coastline. Cliff heights ranged from 5 m at Blakeney to 25 m at Cromer. The cliffs are composed primarily of Anglian and Devensian glacial tills with interbedded sand and gravel lenses, overlain locally by Norwich Crag Formation sands [2] . Wave climate data for longshore transport modelling were obtained from the Channel Coastal Observatory directional wave buoy at Cromer (2018-2023), supplemented by the ERA5 reanalysis hindcast for the period 1979-2023. Tide levels were sourced from the Cromer tide gauge maintained by the UK National Tide Gauge Network.
Methods
Longshore sediment transport rates were calculated using the CERC formula as implemented in the MIKE21 Littoral Processes module (DHI), driven by the measured wave climate and calibrated against observed beach volume changes at three intermediate survey profiles [9] . Annual transport rates were computed for each segment boundary. The sediment budget was closed by solving the continuity equation: ΔV = Qin -Qout -Qloss, where ΔV is the change in beach storage, Qin is cliff erosion input, Qout is net longshore transport out of the segment, and Qloss is offshore loss determined from bathymetric differencing. Retreat rate prediction followed the Bruun Rule modified for cliff-backed coasts, which relates retreat to sea-level rise as R = S × L / (h + B), where S is sea-level rise, L is the cross-shore distance to closure depth, h is closure depth, and B is cliff-top elevation above sea level [10] . Two UKCP18 scenarios were applied: RCP4.5 (0.41 m rise by 2073) and RCP8.5 (0.78 m rise by 2073).
Results
Results
Sensitivity Analysis
The modified Bruun Rule predictions were tested for sensitivity to three input parameters. First, closure depth was varied from 8 m to 14 m: a 2 m increase in closure depth reduced predicted retreat by 11-14%, while a 2 m decrease increased it by 13-17%. Second, the ratio of cliff sediment retained on the beach versus lost offshore was varied from 0.6 to 0.9 (baseline 0.75): lowering retention to 0.6 increased predicted retreat by 9%, while raising it to 0.9 decreased retreat by 7%. Third, the CERC transport coefficient was varied by ± 20%: longshore transport changes of this magnitude altered the net budget by 3-8 × 10³ m³/yr per segment but had a smaller effect on predicted retreat (< 6%) because retreat is driven primarily by the Bruun-type cross-shore response to sea-level rise rather than longshore redistribution [10] .
Comprehensive Interpretation
The sediment budget confirms that the eastern Norfolk coast operates in a chronic deficit state driven by the imbalance between cliff erosion input and the combined losses to longshore transport and offshore dispersal. The western segments are closer to equilibrium or in mild surplus because they receive sediment from the eroding eastern sectors. This east-to-west gradient mirrors the direction of dominant wave-driven longshore transport and explains why barrier features such as Blakeney Point continue to grow while Happisburgh retreats. Adding sea-level rise to this already deficit budget intensifies retreat at rates that are not uniformly distributed-low cliff sections with high current retreat rates see the largest absolute increases.
Discussion
The mean retreat rate at Happisburgh (1.94 m/yr) measured by lidar differencing is consistent with-but slightly higher than-the 1.7 m/yr reported from aerial photograph analysis for the 1992-2013 period by Poulton et al. [11] . The increase may reflect a genuine acceleration or may simply result from the higher temporal resolution of the lidar dataset, which captures individual storm-driven retreat events that annualised aerial photograph measurements smooth out.
The inverse cliff-height-retreat-rate relationship (R² = 0.83) has been documented on other soft-cliff coastlines, including the Holderness coast further north [12] . Taller cliffs are more resistant to wave attack per unit height because the wave energy is distributed across a larger face area, and the toe of a tall cliff is more likely to be buffered by a wider debris apron. However, when tall cliffs do fail, they release proportionally more sediment per event, which can temporarily build up a protective beach that slows subsequent retreat-a negative feedback that operates on decadal timescales [13] .
A limitation is that the modified Bruun Rule is a simplified model that does not account for storm clustering, groundwater effects, or changes in wave direction under climate change. More process-based models, such as those coupling cliff stability analysis with nearshore hydrodynamics, would improve prediction confidence but require input data that are not yet available for all six segments [14] .
Conclusion
This research quantified the sediment budget for six coastal segments along the Norfolk coast and projected retreat rates under two sea-level rise scenarios. The coast operates in a net sediment deficit of -3.9 × 10³ m³/yr, concentrated in the eastern segments where soft glacial-till cliffs supply less material than longshore and offshore processes remove. Retreat rates ranged from 0.53 to 1.94 m/yr and were inversely related to cliff height (R² = 0.83). Under the RCP8.5 high-emission scenario, retreat rates are predicted to increase by 28-41% by 2073, with Happisburgh potentially losing a further 135 m of cliff-top land. These projections support the case for managed retreat policies and early relocation planning in the most vulnerable segments, while recognising that sediment supplied by eastern cliff erosion sustains downdrift habitats that have their own conservation value.
Figures and tables from the paper
| Segment | Cliff Input (10³ m³/yr) | Longshore Out (10³ m³/yr) | Offshore Loss (10³ m³/yr) | Net Balance (10³ m³/yr) |
|---|---|---|---|---|
| Happisburgh | 42.3 | −28.7 | −8.1 | −5.5 |
| Mundesley | 38.7 | −31.4 | −5.2 | −2.1 |
| Cromer | 31.2 | −24.8 | −4.7 | −1.7 |
| Sheringham | 18.4 | −16.2 | −3.1 | 0.9 |
| Weybourne | 12.6 | −11.3 | −2.4 | 1.1 |
| Blakeney | 5.8 | −8.9 | −1.2 | 4.3 |
Table text extracted from the original PDF; superscript letters are shown inline. The original table image is below.
View original table image
| Segment | Current Rate (m/yr) | RCP4.5 Rate (m/yr) | RCP8.5 Rate (m/yr) | RCP8.5 Increase (%) |
|---|---|---|---|---|
| Happisburgh | 1.94 | 2.31 | 2.71 | +39.7 |
| Mundesley | 1.52 | 1.79 | 2.10 | +38.2 |
| Cromer | 1.23 | 1.42 | 1.67 | +35.8 |
| Sheringham | 0.94 | 1.08 | 1.25 | +33.0 |
| Weybourne | 0.78 | 0.89 | 1.04 | +33.3 |
| Blakeney | 0.53 | 0.61 | 0.74 | +39.6 |
Table text extracted from the original PDF; superscript letters are shown inline. The original table image is below.
View original table image
References
16 in the original paper- Brooks SM, Spencer T. Temporal and spatial variations in recession rates and sediment release from soft rock cliffs, Suffolk coast, UK. Geomorphology. 2010;124(12):26-41.
- Cambers G. Temporal scales in coastal erosion systems. Transactions of the Institute of British Geographers. 1976;1(2):246-256.
- Clayton KM. Glacial erosion of the Wash and Fen margins. Quaternary Newsletter. 2000;92:21-27.
- Rosati JD. Concepts in sediment budgets. Journal of Coastal Research. 2005;21(2):307-322.
- Walkden MJA, Hall JW. A predictive mesoscale model of the erosion and profile development of soft rock shores. Coastal Engineering. 2005;52(6):535-563.
- Dawson RJ, Dickson ME, Nicholls RJ, Hall JW, Walkden MJA, Stansby PK. Integrated analysis of risks of coastal flooding and cliff erosion under scenarios of long term change. Climatic Change. 2009;95(1-2):249288.
- Lague D, Brodu N, Leroux J. Accurate 3D comparison of complex topography with terrestrial laser scanner: application to the Rangitikei Canyon (NZ). ISPRS Journal of Photogrammetry and Remote Sensing. 2013;82:10-26.
- Forde HC, Henderson SM. Nearshore bathymetric change off the Norfolk coast. Proceedings of the Institution of Civil Engineers Maritime Engineering. 2019;172(3):75-88.
- DHI. MIKE21 Littoral Processes Module Scientific Documentation. Danish Hydraulic Institute. 2020;1184.
- Bruun P. Sea-level rise as a cause of shore erosion. Journal of the Waterways and Harbors Division. 1962;88(1):117-132.
- Poulton CVL, Lee JR, Hobbs PRN, Jones LD, Hall M. Preliminary investigation into monitoring coastal erosion using terrestrial laser scanning: case study at Happisburgh, Norfolk. Bulletin of the Geological Society of Norfolk. 2006;56:45-64.
- Quinn JD, Philip LK, Murphy W. Understanding the recession of the Holderness Coast, east Yorkshire, UK: a new presentation of temporal and spatial patterns. Quarterly Journal of Engineering Geology and Hydrogeology. 2009;42(2):165-178.
- Sunamura T. Geomorphology of Rocky Coasts. John Wiley and Sons. 1992;1-302.
- Trenhaile AS. Modeling the development of wave-cut shore platforms. Marine Geology. 2000;166(1-4):163178.
- Lee EM. Coastal cliff recession risk: a simple judgement-based model. Quarterly Journal of Engineering Geology and Hydrogeology. 2005;38(1):89-104.
- Nicholls RJ, Birkemeier WA, Lee GH. Evaluation of depth of closure using data from Duck, NC, USA. Marine Geology. 1998;148(3-4):179-201.