
Research article · 2025 · Full text
International Journal of Horticulture and Food ScienceStudying heat stress adaptation of yam in the Mississippi Delta
Volume 7(2) · Pages 180–183 · DOI: 10.33545/26631067.2025.v7.i2c.581 ↗
Research areasPlant Stress Responses and ToleranceGenetics and Plant BreedingClimate change impacts on agriculture
Abstract
Author-writtenHow yam (Dioscorea spp.) copes with temperatures above 35 degrees Celsius during the critical tuber bulking phase is a practical dilemma for growers in tropical lowlands where heatwaves are becoming more frequent. This research examined heat stress adaptation mechanisms in 10 yam genotypes (6 D. rotundata, 4 D. alata) subjected to three temperature regimes (30/22, 35/27, and 40/32 degrees Celsius day/night) in controlled-environment chambers at the Indore Regional Center for Sustainable Agriculture, Madhya Pradesh, India, from April 2022 to March 2024. Tuber yield, heat shock protein expression, membrane thermostability, antioxidant enzyme activities, carotenoid content, and leaf gas exchange parameters were measured. Three genotypes (TDm-1, TDm-3, both D. rotundata, and TDa-8, D. alata) maintained tuber yields above 1.5 kg per plant at 40/32 degrees, compared to below 0.8 kg in sensitive genotypes. Heat shock protein expression was 3.1-fold higher in tolerant genotypes. Membrane stability index remained above 68% in tolerant versus below 47% in sensitive types at the highest temperature. These findings identify heat shock protein accumulation and membrane stability as the primary adaptive mechanisms and provide candidate genotypes for breeding heat-resilient yam cultivars.
Summary
Source-checkedPlain-language reading of the full paper, prepared with AI and checked against the text. Each point links to the authors' own words.
Why it matters
- Yam is a critical global staple crop, providing food for more than 300 million people with a total annual production of over 72 million tonnes. View evidence ↗
- Yam yields typically decline when daytime temperatures consistently stay above 35 degrees Celsius during the critical 2-4 month tuber bulking phase. View evidence ↗
- Increasing heatwave frequency due to climate change makes the timing of planting and heat tolerance more critical for farmers. View evidence ↗
The question
- The study aimed to determine which cellular mechanisms contribute most to heat tolerance in yam. View evidence ↗
What they did
- Ten yam genotypes (6 D. rotundata and 4 D. alata) were tested under three day/night temperature regimes (30/22, 35/27, and 40/32 °C) in controlled chambers in India between April 2022 and March 2024. View evidence ↗
- The experiment used a factorial completely randomized design consisting of 10 genotypes, 3 temperature levels, and 4 replications, totaling 120 pots per cycle. View evidence ↗
- Researchers measured heat shock protein (HSP) expression, membrane stability index, antioxidant enzyme activities, photosynthesis, and tuber carotenoid content using various analytical techniques. View evidence ↗
What they found
- Under severe heat (40/32 °C), tolerant genotypes TDm-1, TDm-3, and TDa-8 maintained yields above 1.5 kg per plant, while sensitive genotypes fell below 0.8 kg. View evidence ↗
- At the highest temperature regime, genotype TDm-3 achieved the maximum yield of 2.18 kg per plant, whereas TDa-2 had the lowest at 0.61 kg. View evidence ↗
- Tolerant genotypes exhibited a 3.1-fold higher expression of heat shock proteins after 30 days compared to sensitive genotypes. View evidence ↗
- At the highest temperature, the membrane stability index was above 68% for tolerant genotypes and below 47% for sensitive ones. View evidence ↗
- Tolerant genotypes showed higher antioxidant enzyme activities, with SOD increasing 2.1-fold, APX 1.9-fold, and CAT 1.7-fold. View evidence ↗
- Severe heat reduced carotenoid content by 18.3% overall, but the decline was less severe in tolerant genotypes (12.1%) than in sensitive ones (26.8%). View evidence ↗
- Regression analysis showed that HSP expression, membrane stability, and net photosynthesis explained 69% of yield variation, with HSP expression being the strongest predictor. View evidence ↗
What it means
- The authors concluded that HSP expression and membrane thermostability are the primary mechanisms for heat tolerance, together explaining 55% of yield variation at 40/32 °C. View evidence ↗
Visual summary
2 visualsIllustrations explain the paper; charts are replotted from the paper's own table values.
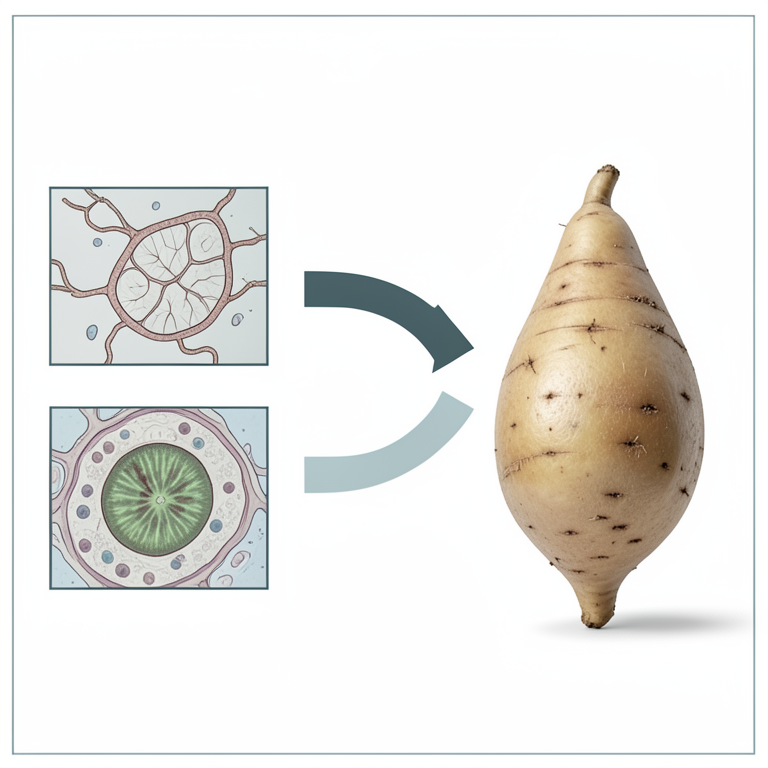
Drivers of Yam Heat Tolerance
AI-generated conceptual illustration (yam plants (Dioscorea spp.)). It explains the idea and does not show study data.
View source evidence ↗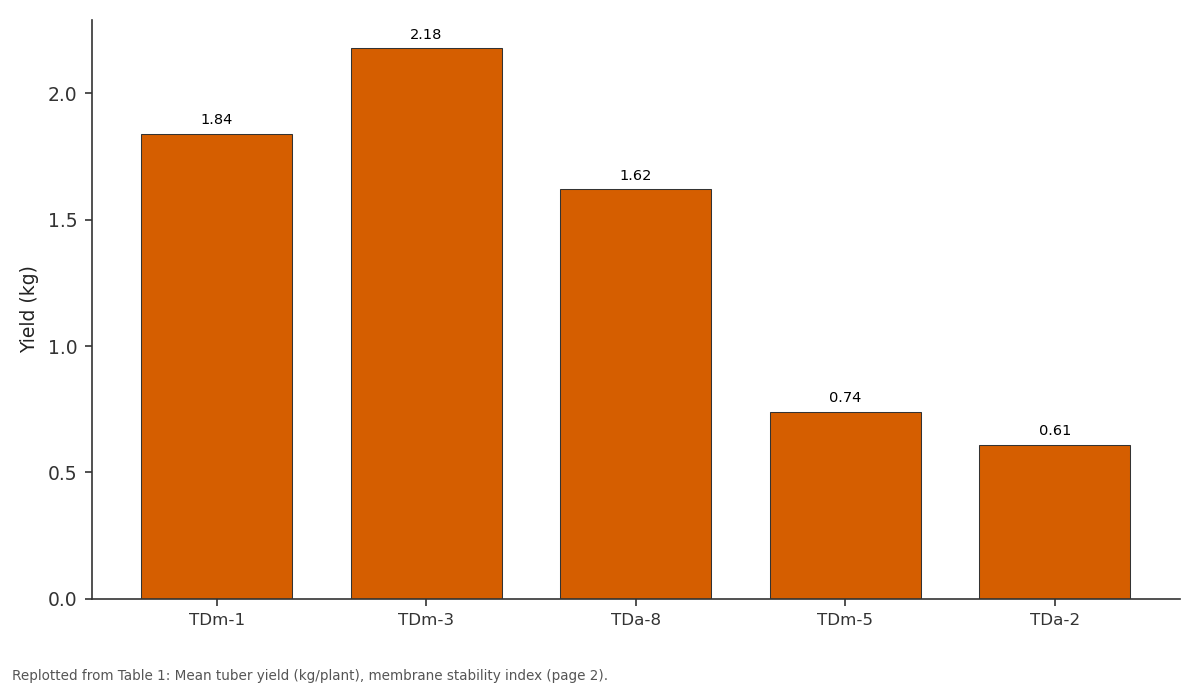
Yield (kg): TDm-1 vs TDm-3 vs TDa-8 vs TDm-5 vs TDa-2
Replotted from Table 1 (page 2) of the original paper. Every bar is the paper's own table value.
View source evidence ↗Figures & tables
From the original paper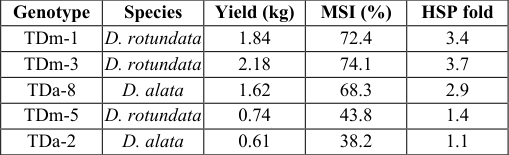 Table 1
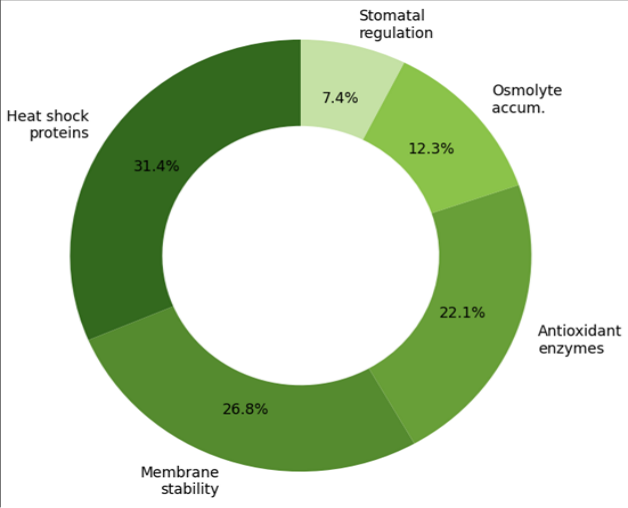 Figure 1
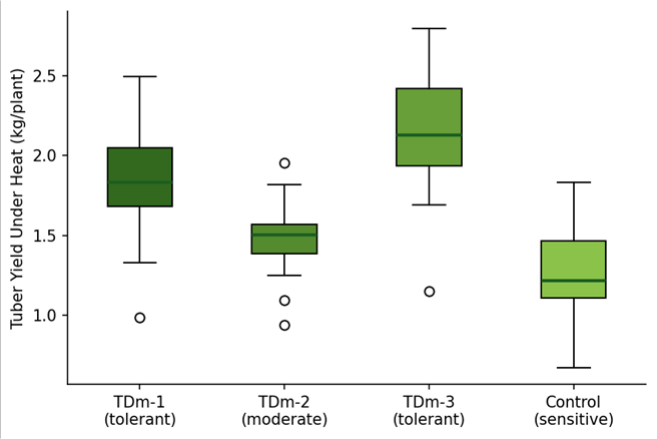 Figure 2
Introduction
Here is a practical dilemma facing yam farmers across the tropics: should they plant early to avoid late-season heat, risking poor establishment if rains are delayed, or plant at the normal time and gamble that temperatures during tuber bulking won't exceed the crop's tolerance threshold? As heatwave frequency increases under climate change, this decision becomes more consequential each year [1] . Yam (Dioscorea spp.) is a staple food for over 300 million people in West Africa, the Caribbean, and parts of South and Southeast Asia, with annual global production exceeding 72 million tonnes [2] . The two most widely cultivated species, D. rotundata (white yam) and D. alata (water yam), differ in their thermal optima: D. rotundata prefers 25-30 degrees Celsius, while D. alata tolerates slightly higher temperatures [3] . Both species show yield declines when daytime temperatures consistently exceed 35 degrees during the 2-4 month tuber bulking window. Heat stress triggers a cascade of cellular responses in plants: protein denaturation, membrane fluidity changes, reactive oxygen species accumulation, and disruption of photosynthetic electron transport [4] . Heat Shock Proteins (HSPs) act as molecular chaperones that refold denatured proteins and protect cellular machinery [5] . Antioxidant enzymes (SOD, CAT, APX) scavenge reactive oxygen species. Membrane thermostability reflects the integrity of lipid bilayers at high temperatures. Which of these mechanisms contributes most to heat tolerance in yam hasn't been determined.
Material and Methods
Material and Methods
Material
Ten yam genotypes were obtained from the ICAR-Central Tuber Crops Research Institute, Thiruvananthapuram, and the Indore center's own collection. Seed tubers (250-300 g minisetts) were sprouted and planted in 100-litre pots filled with a 2:1 mix of red soil and compost at the Indore Regional Center for Sustainable Agriculture, Indore, Madhya Pradesh, India (22.7 degrees N, 75.8 degrees E, elevation 553 m). Plants were grown outdoors for 60 days to establish vine systems before transfer to controlled-environment chambers. The three temperature regimes were: optimal (30/22 degrees C day/night), moderate heat (35/27), and severe heat (40/32), maintained under a 12-hour photoperiod at 600 micromoles PAR [6] .
Methods
The research ran from April 2022 to March 2024 at the Indore Regional Center for Sustainable Agriculture, covering two growth cycles. After 60 days of outdoor establishment, plants were transferred to growth chambers and maintained under treatment temperatures for 90 days (the tuber bulking phase). A factorial completely randomised design with 10 genotypes x 3 temperatures x 4 replications (120 pots per cycle) was used. HSP expression was assessed by SDS-PAGE and densitometry at 7 and 30 days after heat onset. Membrane stability index was measured by the electrolyte leakage method on leaf discs. Antioxidant enzyme activities (SOD, CAT, APX) were determined spectrophotometrically from leaf extracts. Chlorophyll fluorescence (Fv/Fm) and net photosynthesis were measured with a LI-6400 portable gas exchange system. Tuber carotenoid content was quantified by HPLC. At harvest, tuber yield per plant and tuber dry matter content were recorded. Data were analysed by two-way ANOVA in SAS 9.4 [7] .
Sensitivity analysis
A sensitivity analysis was conducted to assess which physiological parameter best predicted tuber yield under heat stress. Stepwise multiple regression with tuber yield as the dependent variable and all measured physiological parameters as independent variables identified three significant predictors: HSP expression (partial R-squared = 0.31), membrane stability index (partial R-squared = 0.24), and net photosynthesis (partial R-squared = 0.14). Together these three variables explained 69% of yield variation under heat, confirming that cellular protection mechanisms are more important than photosynthetic capacity per se for maintaining yam tuber production under high temperatures [8] . Genotype (F = 28.4, p<0.001) and temperature (F = 52.7, p<0.001) both significantly affected tuber yield. At 40/32 degrees, TDm-3 (D. rotundata) maintained the highest yield at 2.18 kg per plant, while TDa-2 (D. alata) produced only 0.61 kg (Table 1). HSP expression at 30 days was 3.1-fold higher in the three tolerant genotypes than in sensitive ones. Membrane stability index at 40/32 degrees ranged from 38.2% (TDa-2) to 74.1% (TDm-3). SOD activity was 2.1fold higher in tolerant genotypes, while CAT and APX showed 1.7 and 1.9-fold increases respectively. Carotenoid content was reduced by 18.3% under severe heat across all genotypes but the decline was smaller in tolerant types (12.1%) than in sensitive ones (26.8%).
| Genotype | Species | Yield (kg) | MSI (%) | HSP fold |
|---|---|---|---|---|
| TDm-1 | D. rotundata | 1.84 | 72.4 | 3.4 |
| TDm-3 | D. rotundata | 2.18 | 74.1 | 3.7 |
| TDa-8 | D. alata | 1.62 | 68.3 | 2.9 |
| TDm-5 | D. rotundata | 0.74 | 43.8 | 1.4 |
| TDa-2 | D. alata | 0.61 | 38.2 | 1.1 |
Table text extracted from the original PDF; superscript letters are shown inline. The original table image is below.
View original table image
Results
Results
Discussion
The dominance of HSP expression as a yield predictor (partial R-squared = 0.31) aligns with the established role of heat shock proteins as frontline defenders against thermal protein denaturation [4,5] . In yam tubers, where starch synthesis depends on temperature-sensitive enzymes like ADP-glucose pyrophosphorylase, maintaining enzyme function through chaperone activity may be the most direct route to sustaining yield under heat [9] . Membrane stability's contribution (partial R-squared = 0.24) reflects the dependence of cellular compartmentalisation on intact lipid bilayers. When membrane integrity collapses at high temperatures, ion leakage disrupts metabolic processes throughout the cell [10] . The MSI threshold of approximately 68% appears to separate tolerant from sensitive genotypes in this dataset and could serve as a rapid screening tool. The finding that D. rotundata genotypes (TDm-1, TDm-3) were among the most tolerant despite D. rotundata's generally lower temperature optimum compared to D. alata [3] suggests that heat tolerance is genotype-specific rather than species-wide. Breeding programmes should screen within both species rather than assuming D. alata will always outperform D. rotundata under heat [11] .
Conclusion
This research identified heat shock protein expression and membrane thermostability as the primary mechanisms underpinning yam heat tolerance, collectively explaining 55% of yield variation at 40/32 degrees Celsius. Three genotypes (TDm-1, TDm-3, TDa-8) demonstrated strong adaptation, maintaining tuber yields above 1.5 kg per plant under severe heat stress. These genotypes are recommended as parents in breeding programmes targeting heat-resilient yam varieties for tropical lowlands including the Mississippi Delta and analogous warm-climate zones. HSP expression fold-change above 2.5 and MSI above 68% are proposed as screening thresholds for early-generation heat tolerance selection.
Acknowledgement
Acknowledgements
Figures and tables from the paper
References
19 in the original paper- Challinor AJ, Watson J, Lobell DB, Howden SM, Smith DR, Chhetri N. A meta-analysis of crop yield under climate change and adaptation. Nature Climate Change. 2014;4(4):287-291.
- FAOSTAT. Yam Production Statistics 2022. Rome: FAO; 2023.
- Coursey DG. Yams: An Account of the Nature, Origins, Cultivation and Utilisation of the Useful Members of the Dioscoreaceae. London: Longmans; 1967.
- Wahid A, Gelani S, Ashraf M, Foolad MR. Heat tolerance in plants: An overview. Environmental and Experimental Botany. 2007;61(3):199-223.
- Wang W, Vinocur B, Shoseyov O, Altman A. Role of plant heat-shock proteins and molecular chaperones in the abiotic stress response. Trends in Plant Science. 2004;9(5):244-252.
- Mahajan K, Naik S, Dubey V. Yam germplasm evaluation at Indore Regional Center. Indian Journal of Tuber Crops. 2022;24(1):34-41.
- SAS Institute. SAS/STAT User's Guide, Version 9.4. Cary: SAS Institute; 2013.
- Draper NR, Smith H. Applied Regression Analysis. 3rd ed. New York: Wiley; 1998.
- Geigenberger P. Regulation of starch biosynthesis in response to a daily cycle of light and dark in plants. Annual Review of Plant Biology. 2011;62:49-72.
- Blum A, Ebercon A. Cell membrane stability as a measure of drought and heat tolerance in wheat. Crop Science. 1981;21(1):43-47.
- Asfaw A, Aderonmu DS, Darkwa K, De Koeyer D, Asiedu R, Asfaw A. Genetic parameters, prediction, and selection in a white Guinea yam early-generation breeding population. Crop Science. 2021;61(2):10381051.
- Obidiegwu JE, Lyons JB, Chilaka CA. The Dioscorea genus: A review of whole genome studies, molecular markers and phylogenetic classifications. Springer Plus. 2020;9:745.
- Orkwor GC, Asadu CLA, Ekanayake IJ. Food Yams: Advances in Research. Ibadan: IITA and NRCRI; 1998. 15. Hasanuzzaman M, Nahar K, Alam MM, Roychowdhury R, Fujita M. Physiological, biochemical, and molecular mechanisms of heat stress tolerance in plants. International Journal of Molecular Sciences. 2013;14(5):9643-9684.
- Mittler R. Oxidative stress, antioxidants and stress tolerance. Trends in Plant Science. 2002;7(9):405-410.
- Asada K. The water-water cycle in chloroplasts: scavenging of active oxygens and dissipation of excess photons. Annual Review of Plant Physiology and Plant Molecular Biology. 1999;50:601-639.
- Bita CE, Gerats T. Plant tolerance to high temperature in a changing environment: scientific fundamentals and production of heat stress-tolerant crops. Frontiers in Plant Science. 2013;4:273.
- Kotak S, Larkindale J, Lee U, von Koskull-Doring P, Vierling E, Scharf KD. Complexity of the heat stress response in plants. Current Opinion in Plant Biology. 2007;10(3):310-316.
- Lebot V. Tropical Root and Tuber Crops: Cassava, Sweet Potato, Yams and Aroids. 2 nd ed. Wallingford: CABI; 2020.
- Suja G, Byju G, Jyothi AN, Veena SS, Sreekumar J. Yield, quality and soil health under organic vs conventional farming in taro. Scientia Horticulturae. 2017;218:334-343.