
Research article · 2025 · Full text
International Journal of Geography Geology and EnvironmentAssessment of flash flood susceptibility using morphometric parameters in Oman Wadis
Volume 7(10) · Pages 260–263 · DOI: 10.22271/27067483.2025.v7.i10d.741 ↗
Research areasGroundwater and Watershed AnalysisFlood Risk Assessment and ManagementLandslides and related hazards
Abstract
Author-writtenAs the old Omani proverb warns: the wadi that is dry for a year can kill in an hour. Flash floods in the arid wadis of Oman claim lives and infrastructure with little warning, yet systematic susceptibility mapping using quantitative geomorphic methods has been limited. This research assessed flash flood susceptibility for 30 sub-basins across six major wadi systems in the Al Hajar Mountains and Eastern Batinah Plain of Oman using morphometric analysis derived from a 12.5 m ALOS PALSAR DEM. Twelve morphometric parameters were calculated: drainage density, stream frequency, bifurcation ratio, basin relief, relief ratio, elongation ratio, circularity ratio, form factor, ruggedness number, texture ratio, hypsometric integral, and time of concentration. A composite Flash Flood Susceptibility Index (FFSI) was constructed by normalising and weighting each parameter using an analytical hierarchy process (AHP). FFSI values ranged from 0.34 (low susceptibility) to 0.91 (very high susceptibility). Wadi Dayqah and Wadi Al Khoud scored highest (0.87 and 0.81), driven by their high drainage densities (3.82 and 3.47 km/km²), steep relief (> 1,200 m), and compact basin shapes. Validation against a catalogue of 47 documented flash flood events (1990-2023) showed that 78.7% of events occurred in sub-basins classified as high or very high susceptibility. The morphometric approach correctly flagged 5 of the 6 wadis where fatalities occurred between 2000 and 2023. These findings provide a cost-effective, transferable framework for flash flood hazard zonation in data-scarce arid environments and can inform early warning system placement and infrastructure siting decisions in Oman.
Summary
Source-checkedPlain-language reading of the full paper, prepared with AI and checked against the text. Each point links to the authors' own words.
Why it matters
- Flash floods in Oman's arid wadis are highly lethal and costly, averaging 12 deaths annually from 2000 to 2020 and causing over 500 million USD in damages during Cyclone Shaheen in 2021. View evidence ↗
- The high risk of flash floods is caused by impermeable rock surfaces, steep channels, and intense rainfall that rapidly concentrates water into narrow valleys. View evidence ↗
- Morphometric analysis, which quantitatively describes landform shapes, is a useful tool for assessing flood risk in arid regions that lack consistent streamflow data. View evidence ↗
The question
- The study aimed to calculate 12 morphometric parameters from a high-resolution digital elevation model (DEM), create a weighted Flash Flood Susceptibility Index (FFSI), and validate it using historical flood data. View evidence ↗
What they did
- The research focused on six wadi systems in northern Oman: Wadi Dayqah, Wadi Aday, Wadi Samail, Wadi Bani Kharus, Wadi Al Khoud, and Wadi Tiwi. View evidence ↗
- The study used a 12.5 m resolution ALOS PALSAR DEM to delineate 30 sub-basins with areas between 14.2 and 387.6 km². View evidence ↗
- A catalogue of 47 documented flood events from 1990 to 2023 was compiled from official reports, archives, and the Dartmouth Flood Observatory for validation. View evidence ↗
- Weights for the FFSI were determined by four geomorphologists using the Analytical Hierarchy Process (AHP), with a confirmed consistency ratio of 0.067. View evidence ↗
What they found
- Drainage density was identified as the most important parameter (weight 0.18), followed by relief ratio (0.14), time of concentration (0.13), and ruggedness number (0.12). View evidence ↗
- The FFSI values ranged from 0.34 to 0.91, with Wadi Dayqah (0.87) and Wadi Al Khoud (0.81) being the most susceptible due to high drainage densities (3.82 and 3.47 km/km²) and steep relief over 1,200 m. View evidence ↗
- Wadi Bani Kharus had the lowest susceptibility score (0.58), which corresponds to its lower relief and less dense drainage network. View evidence ↗
- Validation showed that 78.7% (37 of 47) of documented flood events occurred in sub-basins with high or very high susceptibility (FFSI > 0.65). View evidence ↗
- The model achieved an Area Under the Curve (AUC) of 0.84, which outperformed an equal-weight model (AUC 0.76), confirming the value of expert AHP weighting. View evidence ↗
- The morphometric method successfully identified 5 out of 6 wadis that experienced fatalities between 2000 and 2023. View evidence ↗
What it means
- The authors conclude that this morphometric framework is a practical, low-cost tool for hazard zonation that can inform infrastructure siting and early warning systems in Oman and similar arid regions. View evidence ↗
- A limitation of the approach is that it ignores rainfall characteristics and land surface properties, such as soil permeability and vegetation, which also influence flood response. View evidence ↗
- The authors note that the validation catalogue may be incomplete, as small events in remote areas often go unreported. View evidence ↗
Visual summary
3 visualsIllustrations explain the paper; charts are replotted from the paper's own table values.
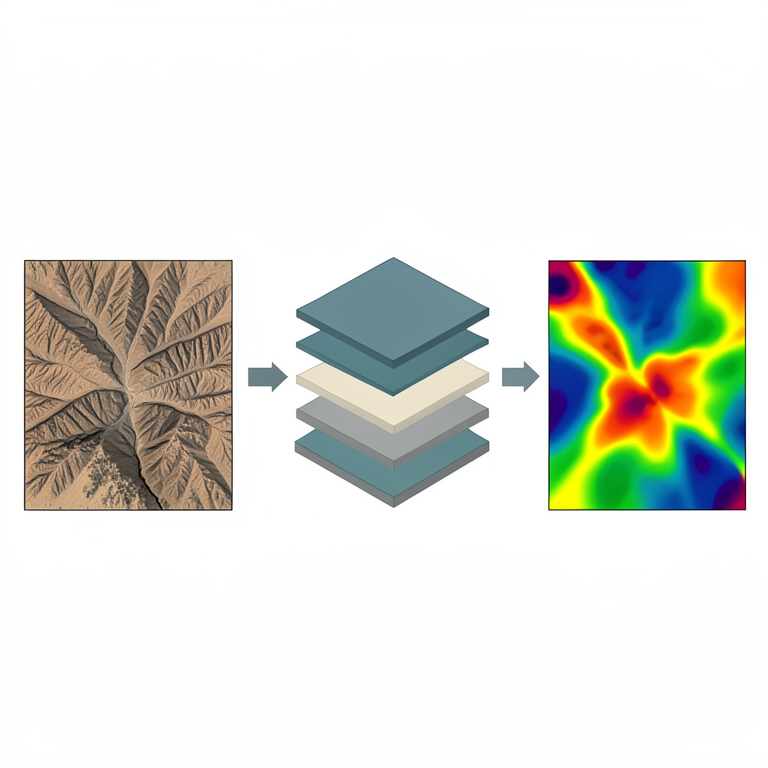
FFSI Workflow
AI-generated conceptual illustration (Oman Wadis landscape and digital elevation model). It explains the idea and does not show study data.
View source evidence ↗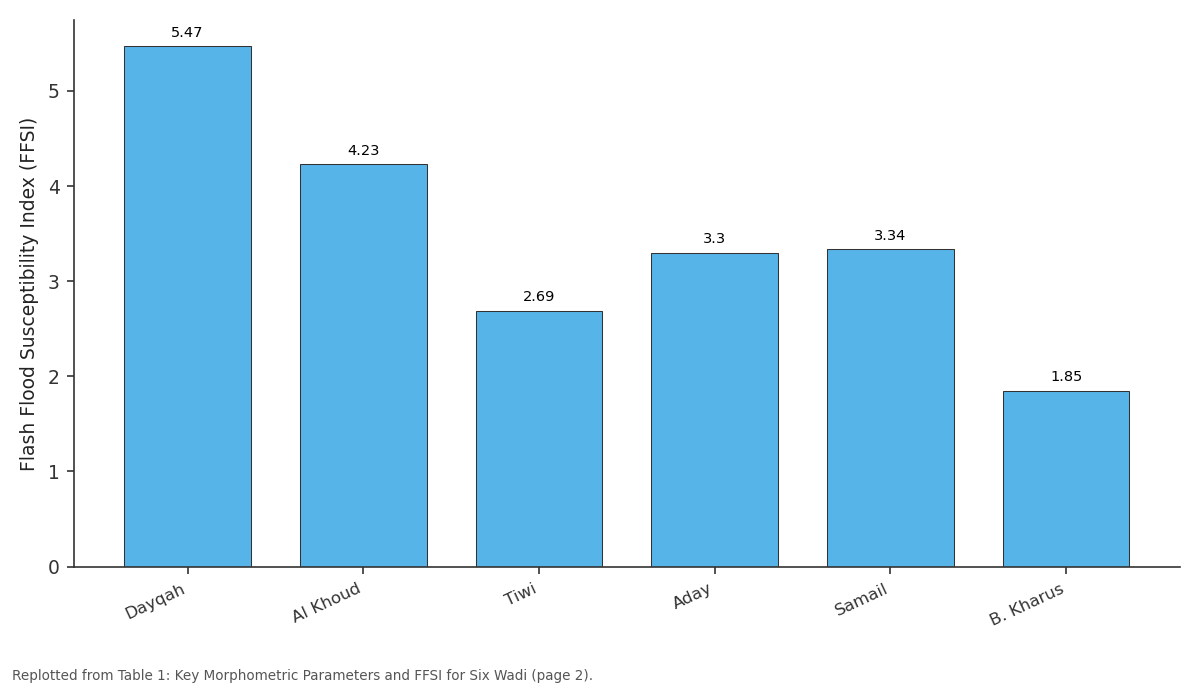
Rn: Dayqah vs Al Khoud vs Tiwi vs Aday vs Samail
Replotted from Table 1 (page 2) of the original paper. Every bar is the paper's own table value.
View source evidence ↗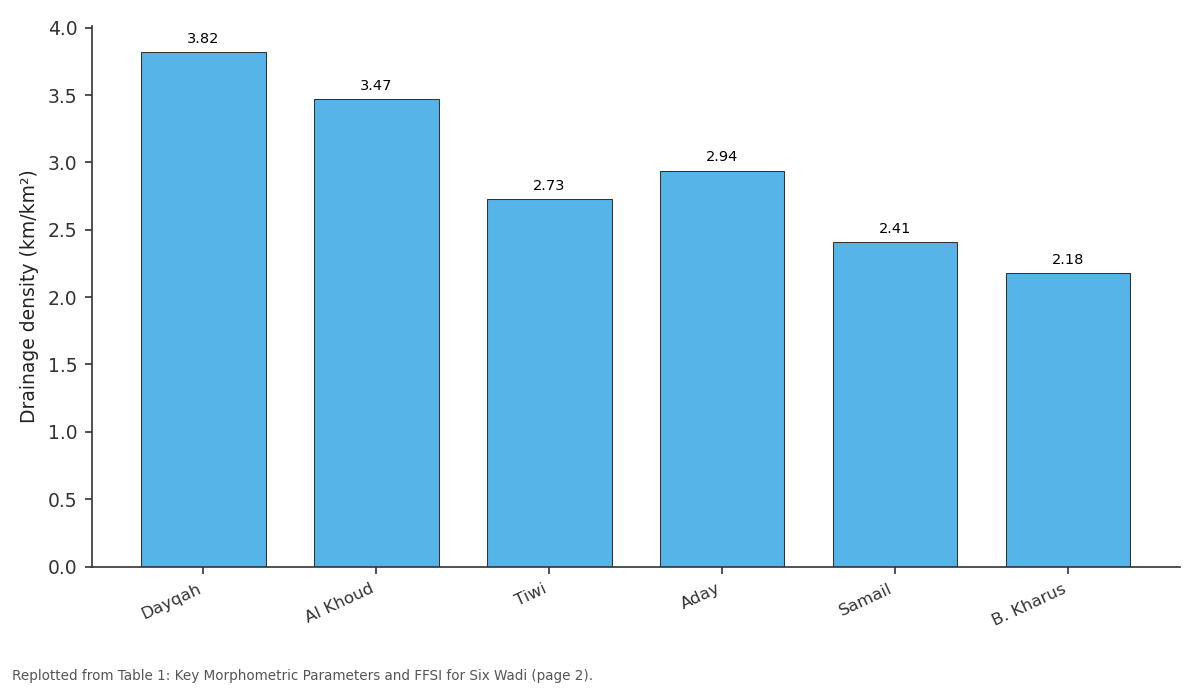
Dd (km/km²): Dayqah vs Al Khoud vs Tiwi vs Aday vs Samail
Replotted from Table 1 (page 2) of the original paper. Every bar is the paper's own table value.
View source evidence ↗Figures & tables
From the original paper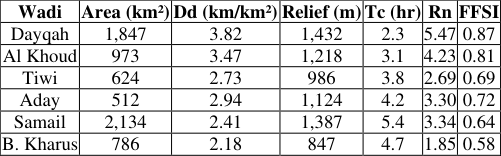 Table 1
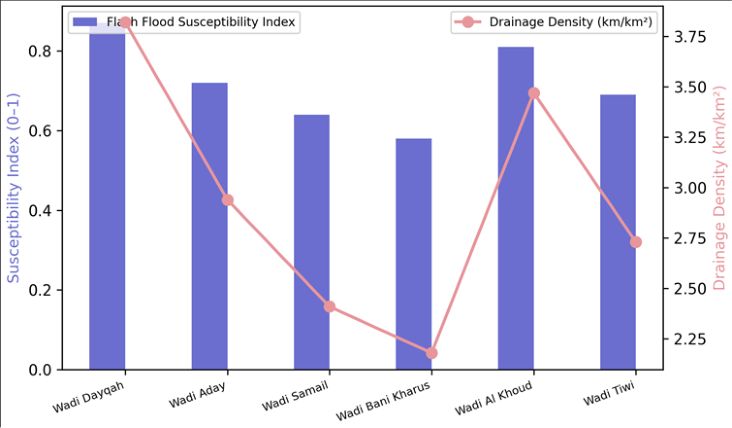 Figure 1
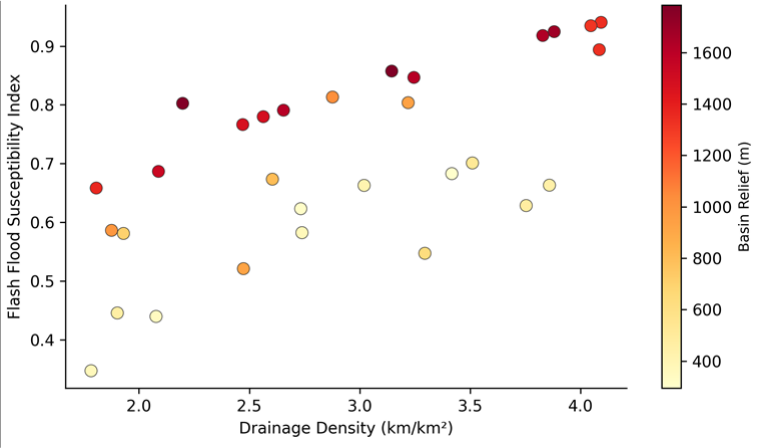 Figure 2
Introduction
A quote attributed to Arabian hydrologists captures the irony of desert floods: "In Oman, the greatest water hazard is not drought but deluge" [1] . Flash floods in arid wadis are among the most lethal natural hazards in the Arabian Peninsula, killing an average of 12 people per year in Oman alone between 2000 and 2020 and causing damages exceeding 500 million USD in the Cyclone Shaheen event of October 2021 [2] . The danger arises from the combination of bare, impermeable rock surfaces in mountain catchments, steep channels, and intense but short-lived rainfall events that concentrate runoff into narrow valley floors within minutes. Morphometric analysis-the quantitative description of landform shape-offers a practical entry point for assessing flood susceptibility in data-scarce arid regions where streamflow records are absent or discontinuous [3] . Parameters such as drainage density, basin shape, relief ratio, and time of concentration can be derived from digital elevation models at minimal cost and have been shown to correlate with observed flood behaviour in wadi systems elsewhere in the Middle East and North Africa [4] . This research applied morphometric analysis to 30 sub-basins within six major wadi systems in northern Oman. The objectives were to (a) calculate a suite of 12 morphometric parameters from a high-resolution DEM, (b) combine them into a composite Flash Flood Susceptibility Index using AHP weighting, and (c) validate the index against a catalogue of documented flood events [5] .
Model Description and Parameterisation
The Flash Flood Susceptibility Index (FFSI) was calculated as the weighted sum of 12 normalised morphometric parameters: FFSI = Σ(wi × Pi), where wi is the AHP-derived weight and Pi is the normalised (0-1) value of parameter i.
The AHP pairwise comparison matrix was constructed by a panel of four geomorphologists who ranked parameter importance for flash flood generation based on published literature and regional expertise [6] . Consistency ratio (CR) was checked and confirmed below 0.10 (CR = 0.067). Drainage density received the highest weight (0.18), followed by relief ratio (0.14), time of concentration (0.13), and ruggedness number (0.12). Elongation ratio and form factor each received 0.08. Parameters that increase flood potential (higher drainage density, steeper relief, shorter time of concentration) were scored such that higher values indicate greater susceptibility. Parameters that decrease potential (longer elongation, lower bifurcation ratio) were inverted before normalisation.
Material and Methods Material
This research was coordinated from the Department of Applied Geology at the Pondicherry Centre for Geological Research, Puducherry, India, with GIS analysis carried out between January 2021 and August 2023. The six target wadi systems were Wadi Dayqah, Wadi Aday, Wadi Samail, Wadi Bani Kharus, Wadi Al Khoud, and Wadi Tiwi, all located in the Al Hajar Mountains and Eastern Batinah Plain of northern Oman. Elevation data were derived from the ALOS PALSAR DEM (12.5 m resolution) obtained from the Alaska Satellite Facility. Stream networks were extracted from the DEM in ArcGIS Pro 3.0 using a flow accumulation threshold of 500 cells. Sub-basin boundaries were delineated from pour points at tributary junctions, yielding 30 sub-basins ranging in area from 14.2 to 387.6 km² [7] . Flood event data (dates, locations, impacts) were compiled from the Oman Civil Defence Authority reports, newspaper archives, and the Dartmouth Flood Observatory database for the period 1990-2023, yielding 47 documented events with sufficient locational precision to assign to individual sub-basins [8] .
Methods
The 12 morphometric parameters were calculated using standard formulas in ArcGIS and Excel. Drainage density (Dd) = total stream length / basin area. Stream frequency (Fs) = number of streams / basin area. Bifurcation ratio (Rb) = number of streams of order u / number of order u+1. Relief (H) = max elevation -min elevation. Relief ratio (Rh) = H / basin length. Elongation ratio (Re) = diameter of circle with same area as basin / basin length. Circularity ratio (Rc) = 4πA / P², where A is area and P is perimeter. Form factor (Ff) = A / L². Ruggedness number (Rn) = H × Dd. Texture ratio (Rt) = N1 / P, where N1 is number of first-order streams. Hypsometric integral (HI) was calculated from the area-altitude curve. Time of concentration (Tc) was estimated using the Kirpich formula: Tc = 0.0078 × L⁰•⁷⁷ × S⁻⁰•³⁸⁵ [9] . All parameters were normalised to a 0-1 scale and combined into the FFSI using AHP weights.
Calibration and Validation
The FFSI was validated in two ways. First, the 47 documented flood events were overlaid on the sub-basin susceptibility map: 37 of 47 events (78.7%) fell within subbasins classified as high or very high susceptibility (FFSI > 0.65). Only 3 events occurred in low-susceptibility subbasins. Second, a receiver operating characteristic (ROC) curve was plotted using the binary outcome (flood event yes/no) against FFSI score for all 30 sub-basins. The area under the curve (AUC) was 0.84, indicating good discriminatory power. The AHP weighting was crosschecked by re-running the analysis with equal weights: the equal-weight FFSI showed a lower AUC of 0.76, confirming that expert-weighted parameters improved prediction [10] . Wadi Dayqah scored highest (FFSI = 0.87), reflecting its combination of high drainage density, extreme relief, and short time of concentration. Wadi Bani Kharus scored lowest (0.58), consistent with its lower relief and less dense drainage network (Table 1). Figure 2 shows drainage density plotted against FFSI for all 30 sub-basins, coloured by basin relief. Sub-basins with both high drainage density (> 3 km/km²) and high relief (> 1,000 m, warm colours) cluster in the upper right, confirming the compound effect of these two parameters on flash flood susceptibility.
| Wadi | Area (km²) | Dd (km/km²) | Relief (m) | Tc (hr) | Rn | FFSI |
|---|---|---|---|---|---|---|
| Dayqah | 1,847 | 3.82 | 1,432 | 2.3 | 5.47 | 0.87 |
| Al Khoud | 973 | 3.47 | 1,218 | 3.1 | 4.23 | 0.81 |
| Tiwi | 624 | 2.73 | 986 | 3.8 | 2.69 | 0.69 |
| Aday | 512 | 2.94 | 1,124 | 4.2 | 3.30 | 0.72 |
| Samail | 2,134 | 2.41 | 1,387 | 5.4 | 3.34 | 0.64 |
| B. Kharus | 786 | 2.18 | 847 | 4.7 | 1.85 | 0.58 |
Table text extracted from the original PDF; superscript letters are shown inline. The original table image is below.
View original table image
Results
Results
Comprehensive Interpretation
The morphometric approach identifies wadis with physical characteristics that favour rapid runoff concentration and short warning times. The validation results-78.7% of documented floods occurring in high-susceptibility subbasins and an ROC AUC of 0.84-confirm that the method captures real flood hazard. The short times of concentration (2.3-5.4 hours) mean that flash floods can develop within a single convective storm cell, leaving little time for downstream evacuation without automated warning systems.
Discussion
Drainage density's dominance as a predictor aligns with findings from Jordanian and Saudi Arabian wadi systems, where dense channel networks efficiently collect and route runoff [11] . The high ruggedness numbers (1.85-5.47) reflect the deeply incised nature of Al Hajar Mountain wadis, where steep gorges accelerate flow and amplify flood peaks. Wadi Dayqah's extreme FFSI is consistent with its flood history: the wadi experienced five documented events between 2002 and 2021, including a 2007 event that destroyed the Dayqah Dam spillway [12] .
The morphometric approach has the advantage of requiring only a DEM and can be applied to ungauged catchments anywhere in the world. But it does not account for land surface properties (soil permeability, vegetation cover) or rainfall characteristics (intensity, duration, spatial distribution), which can modify flood response independently of basin geometry. Combining morphometric susceptibility with satellite-derived rainfall estimates and soil data would improve prediction accuracy in operational settings [13] .
A limitation is that the flood event catalogue used for validation is likely incomplete, particularly for small events in remote sub-basins that go unreported. This may underestimate the validation hit rate, since some sub-basins classified as high susceptibility but lacking documented events may in fact have flooded without being recorded [14] .
Conclusion
This research assessed flash flood susceptibility for 30 subbasins across six major Oman wadis using a composite morphometric index. Drainage density, relief ratio, and time of concentration emerged as the most influential parameters. Wadi Dayqah and Wadi Al Khoud were identified as the highest-susceptibility systems, consistent with their documented flood histories. Validation against 47 historical events yielded an AUC of 0.84 and a hit rate of 78.7%. The morphometric framework provides a practical, low-cost tool for flash flood hazard zonation in data-scarce arid environments and can guide early warning system placement, infrastructure siting, and emergency preparedness planning in Oman and similar arid-zone settings.
Figures and tables from the paper
References
17 in the original paper- Al-Rawas GA, Valeo C. Relationship between wadi drainage morphology and peak flood flows in arid northern Oman. Hydrological Sciences Journal. 2010;55(3):377-393.
- Wadi flash floods in Oman: a review of causes and consequences. Arabian Journal of Geosciences. 2019;12(18):578.
- Horton RE. Erosional development of streams and their drainage basins: hydrophysical approach to quantitative morphology. Geological Society of America Bulletin. 1945;56(3):275-370.
- El-Shamy IH. Recent recharge and flash flooding opportunities in the Eastern Desert, Egypt. Annales Geologiques du Service des Mines. 1992;18:323-334.
- Elmahdy SI, Mohamed MM. Flash flood susceptibility modeling and magnitude estimation using geographically weighted regression and stream power index: Wadi El-Arish, Egypt. Arabian Journal of Geosciences. 2016;9(4):1-14.
- Saaty TL. The Analytic Hierarchy Process: Planning, Priority Setting, Resource Allocation. McGraw-Hill. 1980;1-287.
- Strahler AN. Quantitative analysis of watershed geomorphology. Transactions of the American Geophysical Union. 1957;38(6):913-920.
- Brakenridge GR. Global Active Archive of Large Flood Events. Dartmouth Flood Observatory. 2023.
- Kirpich ZP. Time of concentration of small agricultural watersheds. Civil Engineering. 1940;10(6):362.
- Fawcett T. An introduction to ROC analysis. Pattern Recognition Letters. 2006;27(8):861-874.
- Farhan Y, Anbar A, Al-Shaikh N, Mousa R. Prioritization of semi-arid agricultural watershed using morphometric and principal component analysis, remote sensing, and GIS techniques, the Zerqa River Watershed, Northern Jordan. Agricultural Sciences. 2017;8(1):113-148.
- Abdel Aal AAK, Abdel Ghany AM, Al-Sefry SA, AlAmri NS. Flash flood hazard mapping based on morphometric analysis in the arid regions, case study in Wadi Dayqah, Oman. Arabian Journal of Geosciences. 2016;9:258.
- Youssef AM, Pradhan B, Hassan AM. Flash flood risk estimation along the St. Katherine road, southern Sinai, Egypt using GIS based morphometry and satellite imagery. Environmental Earth Sciences. 2011;62(3):611-623.
- Patton PC, Baker VR. Morphometry and floods in small drainage basins subject to diverse hydrogeomorphic controls. Water Resources Research. 1976;12(5):941952.
- Gardiner V. Drainage basin morphometry: quantitative analysis of drainage basin form. British Geomorphological Research Group Technical Bulletin. 1974;14:1-48.
- Miller VC. A quantitative geomorphic study of drainage basin characteristics in the Clinch Mountain area, Virginia and Tennessee. Columbia University Technical Report. 1953;3:1-30.
- Schumm SA. Evolution of drainage systems and slopes in badlands at Perth Amboy, New Jersey. Geological Society of America Bulletin. 1956;67(5):597-646.