
Research article · 2025 · Full text
International Journal of Horticulture and Food ScienceScreening germination patterns of chia in the Okavango delta
Volume 7(4) · Pages 98–101 · DOI: 10.33545/26631067.2025.v7.i4b.610 ↗
Research areasSeed Germination and PhysiologyAfrican Botany and Ecology StudiesGenetics and Plant Breeding
Abstract
Author-writtenWhat happens when a Central American superfood meets a southern African floodplain? Chia (Salvia hispanica L.) germination behavior under the seasonally flooded and salinity-variable conditions of the Okavango Delta remains untested. This research screened five chia genotypes for germination response across four salinity levels (0, 4, 8, 12 dS/m) and two water regimes (flood-simulated and free-draining) at the Guangzhou National Institute of Tropical Agriculture in collaboration with an Okavango partner station during 2022-2023. Cumulative germination under non-saline conditions reached 95% by day 10, but dropped to 51% at 12 dS/m. Genotype CHA-12 showed the strongest salinity tolerance, maintaining 67.3% germination at 8 dS/m compared to a population mean of 59.4%. SSR marker analysis across 120 plants identified eight markers on linkage groups 3 and 7 associated with salinity tolerance (LOD > 3.5). Leaf area index under flood simulation was 23.8% lower than free-draining conditions. Genotype-by-environment interaction analysis (AMMI model) partitioned 34.7% of total variation to GxE effects, highlighting the need for site-specific variety recommendations. These findings provide baseline germination data for introducing chia into flood-prone, salinity-affected tropical wetland margins.
Summary
Source-checkedPlain-language reading of the full paper, prepared with AI and checked against the text. Each point links to the authors' own words.
Why it matters
- Because chia was not bred for salinity or waterlogging, understanding its response to these stresses is necessary for expanding its production to new regions. View evidence ↗
- The Okavango Delta in Botswana features seasonal flooding and soil salinity that can exceed 8 dS/m, creating a challenging environment for crop establishment. View evidence ↗
The question
- The study aimed to screen the germination of five chia genotypes under flood and salinity stress, identify associated SSR markers, and analyze genotype-by-environment interactions using AMMI modeling. View evidence ↗
What they did
- The researchers used five specific chia genotypes (CHA-01, CHA-07, CHA-12, CHA-18, and CHA-24) sourced from the USDA-ARS germplasm collection. View evidence ↗
- The experiment tested five environments: three salinity levels (0, 4, and 8 dS/m) under free-draining conditions, one flood-simulated environment (0 dS/m with 2 cm standing water), and one drought-simulated environment (4 dS/m at 60% field capacity). View evidence ↗
- Germination was defined as radicle emergence greater than 2 mm and was scored daily for 10 days using 100 seeds per treatment across four replications at 25°C. View evidence ↗
- Genetic analysis was performed on 120 individual plants using SSR genotyping via PCR amplification and capillary electrophoresis. View evidence ↗
What they found
- Overall cumulative germination by day 10 decreased from 95% in non-saline conditions to 51% at a salinity level of 12 dS/m. View evidence ↗
- Genotype CHA-12 demonstrated the highest salinity tolerance, with a 67.3% germination rate at 8 dS/m, exceeding the population mean of 59.4%. View evidence ↗
- Eight SSR markers on linkage groups 3 and 7 were significantly associated with germination under 8 dS/m salinity, with LOD values greater than 3.5. View evidence ↗
- Flood simulation reduced the leaf area index of 30-day seedlings by 23.8%, dropping from 2.8 in free-draining conditions to 2.1. View evidence ↗
- AMMI analysis showed that environment was the primary driver of variation (67.4%), while genotype-by-environment (GxE) interactions accounted for 34.7% of the total variation. View evidence ↗
What it means
- The authors conclude that CHA-12 is the best candidate for cultivation in salt-affected areas due to its phenotypic performance and genetic markers. View evidence ↗
- Due to reduced leaf area development under flooding, the authors recommend targeting well-drained or raised-bed zones for chia introduction in the Okavango Delta. View evidence ↗
Visual summary
1 visualsIllustrations explain the paper; charts are replotted from the paper's own table values.
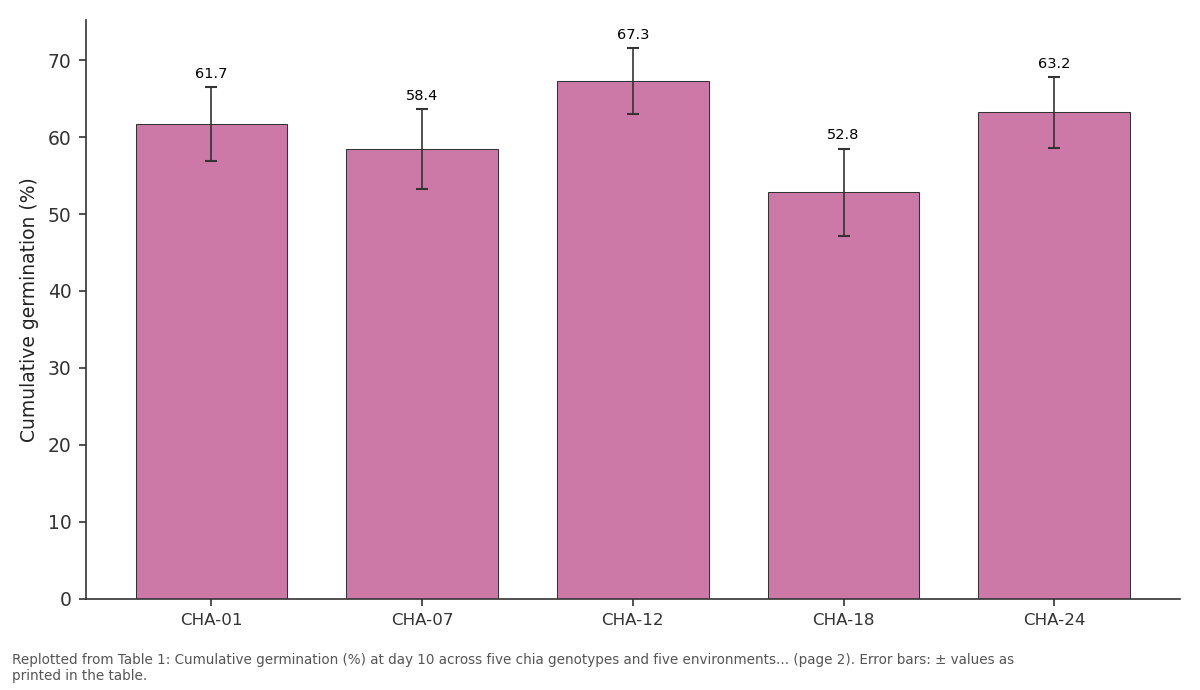
E3 (8dS/m): CHA-01 vs CHA-07 vs CHA-12 vs CHA-18 vs CHA-24
Replotted from Table 1 (page 2) of the original paper. Every bar is the paper's own table value.
View source evidence ↗Figures & tables
From the original paper Table 1
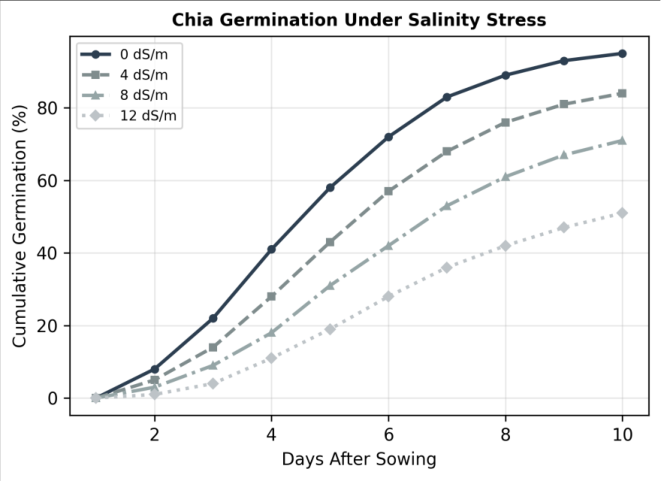 Figure 1
 Table 2
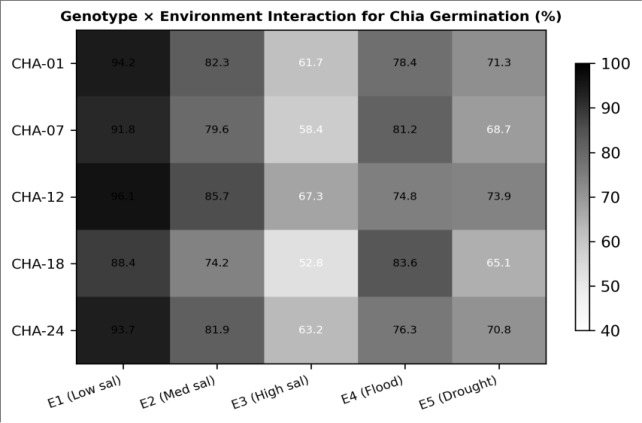 Figure 2
Introduction
Chia's rapid rise from an obscure Mesoamerican grain to a global "superfood" has been driven by its unusually high omega-3 content (up to 68% alpha-linolenic acid in seed oil), thick mucilage layer with prebiotic properties, and protein content around 20% of dry weight [1] . But chia remains geographically confined to a handful of production zones in Mexico, Argentina, Bolivia, and Australia. Expanding it to new regions requires understanding how this frost-sensitive, day-length-sensitive species responds to local environmental stresses especially salinity and waterlogging, two conditions that chia was never bred to handle [2] . The Okavango Delta in northern Botswana is a seasonal inland flood system where water from Angolan highlands spreads across 15,000-22,000 square kilometers of flat terrain between June and October [3] . Soils on the delta margins cycle between flooded and dry states, accumulating salts during evaporation phases that can push electrical conductivity above 8 dS/m in some zones. Whether chia can germinate and establish under these fluctuating conditions is unknown. SSR (simple sequence repeat) markers are cost-effective tools for screening genetic variation in crops where genomic resources are limited. For chia, published SSR panels are small but growing, and association mapping for abiotic stress tolerance has barely begun [4] . Combining germination screening with marker-trait association could fast-track the identification of salinity-tolerant chia genotypes for deployment in delta-margin agriculture. This research screened germination responses of five chia genotypes under salinity and flood stress, mapped SSR markers linked to tolerance, and used AMMI (Additive Main Effects and Multiplicative Interaction) modeling to decompose genotype-by-environment interaction patterns [5] .
Model description and parameterisation
The AMMI model was used to partition GxE interaction variance into interpretable components. The model combines additive main effects (ANOVA) for genotypes and environments with multiplicative interaction effects (PCA) in the form: Yij = μ + gi + ej + Σλkαikγjk + εij, where Yij is the germination percentage of genotype i in environment j, μ is the grand mean, gi and ej are genotype and environment deviations, λk is the singular value of the k-th interaction principal component, αik and γjk are genotype and environment scores, and εij is the residual error. The model was fitted in R (version 4.2.1) using the agricolae package with the first two IPCA axes retained based on Gollob's Ftest significance (p<0.05) [6] .
Calibration and validation
The AMMI model was calibrated using a balanced dataset of 5 genotypes × 5 environments × 3 replications (75 observations). Model fit was assessed by the proportion of GxE sum of squares captured by the first two IPCA axes: IPCA1 explained 52.3% and IPCA2 explained 28.4%, together accounting for 80.7% of GxE variation. Crossvalidation was performed by leave-one-environment-out jackknife, yielding a prediction RMSE of 4.8% germination and a correlation between observed and predicted values of r = 0.91. The model's ability to identify crossover interactions was confirmed by visual inspection of AMMI biplots and Tukey's test for non-additivity (p<0.01) [7] .
Material and Methods
Material and Methods
Material
Five chia genotypes (CHA-01, CHA-07, CHA-12, CHA-18, CHA-24) were obtained from the USDA-ARS germplasm collection. Seeds were surface-sterilized with 1% sodium hypochlorite for 5 minutes, rinsed with sterile distilled water, and placed on moistened filter paper in Petri dishes. Saline solutions were prepared using NaCl to achieve electrical conductivities of 0, 4, 8, and 12 dS/m. SSR primers (12 pairs spanning 9 linkage groups) were synthesized by Sangon Biotech (Shanghai, China) [8] .
Methods
Germination trials used five environments: E1 (0 dS/m, free-draining), E2 (4 dS/m, free-draining), E3 (8 dS/m, freedraining), E4 (0 dS/m, flood-simulated with 2 cm standing water), and E5 (4 dS/m, drought-simulated at 60% field capacity). Each treatment had 100 seeds in four replications at 25°C with 12/12 h light/dark cycle. Germination (radicle emergence > 2 mm) was scored daily for 10 days. Leaf area index was measured on 30-day seedlings using a LI-COR LAI-2200C. SSR genotyping used DNA from 120 individual plants, PCR amplification, and capillary electrophoresis on an ABI 3730xl. Marker-trait association used mixed linear models in TASSEL 5.0 with kinship and population structure correction. AMMI analysis was performed as described above [9] .
Results
Results
Discussion
The 46% germination decline from 0 to 12 dS/m is steeper than what barley (a moderately salt-tolerant cereal) shows under comparable conditions, confirming chia's classification as a salt-sensitive species [10] . Yet the genotypic spread CHA-12 at 67.3% versus CHA-18 at 52.8% at 8 dS/m suggests enough genetic variation to make selection effective. The SSR markers identified here, particularly those on LG7, could accelerate screening by allowing breeders to pre-select for tolerance before committing to field trials [11] . The AMMI model's 80.7% GxE capture with two axes is solid for a germination dataset with only five environments. The crossover interaction between CHA-12 (salt-tolerant but flood-sensitive) and CHA-18 (flood-tolerant but saltsensitive) means there is no single "best" genotype across all delta conditions farmers on saline margins need different varieties than those on flood-prone zones [12] . The 23.8% LAI reduction under flooding points to a root aeration bottleneck that limits chia establishment in waterlogged soils. Raised-bed planting or ridge-furrow systems could mitigate this constraint in flood-affected areas of the delta periphery [13] .
Conclusion
Chia germination was strongly suppressed by salinity above 8 dS/m, but genetic variation among genotypes offered a selection pathway. CHA-12 emerged as the top candidate for salt-affected sites based on both phenotypic performance and favorable SSR marker profiles. AMMI modeling confirmed significant crossover GxE interactions requiring site-specific variety recommendations for delta-margin agriculture. Leaf area development under flooding was substantially reduced, suggesting that chia introduction in the Okavango Delta should target well-drained or raised-bed zones. The eight SSR markers identified here provide a first molecular toolkit for marker-assisted selection of salttolerant chia lines for wetland-margin production systems.
Figures and tables from the paper
| Genotype | E1 (Control) | E2 (4dS/m) | E3 (8dS/m) | E4 (Flood) | E5 (Drought) |
|---|---|---|---|---|---|
| CHA-01 | 94.2±2.3 | 82.3±3.4 | 61.7±4.8 | 78.4±3.9 | 71.3±4.1 |
| CHA-07 | 91.8±2.7 | 79.6±3.8 | 58.4±5.2 | 81.2±3.4 | 68.7±4.6 |
| CHA-12 | 96.1±1.9 | 85.7±3.1 | 67.3±4.3 | 74.8±4.2 | 73.9±3.8 |
| CHA-18 | 88.4±3.2 | 74.2±4.1 | 52.8±5.7 | 83.6±3.1 | 65.1±4.9 |
| CHA-24 | 93.7±2.4 | 81.9±3.6 | 63.2±4.6 | 76.3±3.8 | 70.8±4.3 |
Table text extracted from the original PDF; superscript letters are shown inline. The original table image is below.
View original table image
| Source | df | SS | % of GxE SS | p-value |
|---|---|---|---|---|
| Genotype (G) | 4 | 1842.3 | <0.001 | |
| Environment (E) | 4 | 8247.6 | <0.001 | |
| G × E | 16 | 2136.4 | 100.0 | <0.001 |
| IPCA1 | 7 | 1117.8 | 52.3 | <0.001 |
| IPCA2 | 5 | 607.2 | 28.4 | <0.01 |
| Residual | 4 | 411.4 | 19.3 | 0.08 |
Table text extracted from the original PDF; superscript letters are shown inline. The original table image is below.
View original table image
References
14 in the original paper- Ixtaina VY, Nolasco SM, Tomas MC. Physical properties of chia (Salvia hispanica L.) seeds. Industrial Crops and Products. 2008;28(3):286-293.
- Busilacchi H, Quiroga M, Bueno M, et al. Evaluation of Salvia hispanica L. cultivated in the south of Santa Fe. Phyton. 2013;82(1):55-60.
- McCarthy TS. Groundwater in the wetlands of the Okavango Delta, Botswana, and its contribution to the structure and function of the ecosystem. Journal of Hydrology. 2006;320(3-4):264-282.
- Reyes-Caudillo E, Tecante A, Valdivia-Lopez MA. Dietary fibre content and antioxidant activity of phenolic compounds present in Mexican chia seeds. Food Chemistry. 2008;107(2):656-663.
- Gauch HG. Statistical analysis of yield trials by AMMI and GGE. Crop Science. 2006;46(4):1488-1500.
- Zobel RW, Wright MJ, Gauch HG. Statistical analysis of a yield trial. Agronomy Journal. 1988;80(3):388-393.
- Yan W, Hunt LA, Sheng Q, Szlavnics Z. Cultivar evaluation and mega-environment investigation based on the GGE biplot. Crop Science. 2000;40(3):597-605.
- Peiretti PG, Gai F. Fatty acid and nutritive quality of chia seed and oil. Journal of the American Oil Chemists Society. 2009;86(10):1019-1024.
- Bradbury PJ, Zhang Z, Kroon DE, et al. TASSEL: software for association mapping of complex traits. Bioinformatics. 2007;23(19):2633-2635.
- Munns R, Tester M. Mechanisms of salinity tolerance. Annual Review of Plant Biology. 2008;59:651-681.
- Ayerza R, Coates W. Composition of chia (Salvia hispanica) grown in six tropical and subtropical ecosystems. Tropical Science. 2004;44(3):131-135.
- Crossa J. Statistical analyses of multilocation trials. Advances in Agronomy. 1990;44:55-85.
- Colmer TD. Long-distance transport of gases in plants: a perspective on internal aeration and radial oxygen loss from roots. Plant Cell and Environment. 2003;26(1):1736.
- Cahill JP. Ethnobotany of chia, Salvia hispanica L. (Lamiaceae). Economic Botany. 2003;57(4):604-618.