
Research article · 2026 · Full text
International Journal of Biology SciencesTrend and instability analysis of mushroom production in Haryana
Volume 8(5) · Pages 01–05 · DOI: 10.33545/26649926.2026.v8.i5a.818 ↗
Research areasAgricultural Economics and PracticesAgricultural and Food Production StudiesSocial and Economic Development in India
Abstract
Author-writtenThis study examines the growth dynamics and stability of mushroom production and infrastructure (No. of Trays) in Haryana from 1991 to 2025. Using exponential growth models and the Cuddy-Della Valle Instability Index (CDVI), the data across four distinct decades and an overall period were analysed. The results reveal that while growth was highest during the initial phase (1991-2000), a significant resurgence in productivity is observed in the most recent period (2021-2025). Trend fitting analysis shows that the Quadratic model provides the best fit for both production and tray counts, indicating a non-linear expansion of the industry.
Summary
Source-checkedPlain-language reading of the full paper, prepared with AI and checked against the text. Each point links to the authors' own words.
Why it matters
- Mushroom cultivation is a key diversified agricultural activity in India that supports rural employment, waste management, and nutritional security. View evidence ↗
- The sector is economically important because it converts agricultural wastes, mainly rice and wheat straw, into high-quality protein. View evidence ↗
The question
- The study aims to quantify the long-term growth and instability of mushroom production and infrastructure (number of trays) in Haryana from 1991 to 2025. View evidence ↗
What they did
- The researchers used secondary annual state-level data from the Department of Horticulture, Haryana, covering a 35-year period from 1990-91 to 2024-25. View evidence ↗
- Compound annual growth rates (CAGR) for production and tray counts were estimated using a semi-log (log-linear) model. View evidence ↗
- The Cuddy-Della Valle Index (CDVI) was employed to measure instability by removing the influence of long-term trends from the data. View evidence ↗
What they found
- The Quadratic model provided the best fit for both production (R²=0.95) and tray counts (R²=0.947), indicating non-linear industry expansion. View evidence ↗
- The most rapid expansion occurred between 1991 and 2000, with a production CAGR of 18.59% and a tray CAGR of 14.79%. View evidence ↗
- While instability was low during sub-periods (4.97% to 11.17%), the overall period (1991-2025) showed higher instability (Prod. CDVI 19.88%), reflecting structural shifts in cultivation practices. View evidence ↗
What it means
- The authors conclude that the recent trend of production growth outpacing tray growth indicates improved vertical productivity per tray. View evidence ↗
- The authors recommend that future policies encourage technological adoption and maintain stability to sustain the high growth seen in the 2020s. View evidence ↗
Visual summary
3 visualsIllustrations explain the paper; charts are replotted from the paper's own table values.
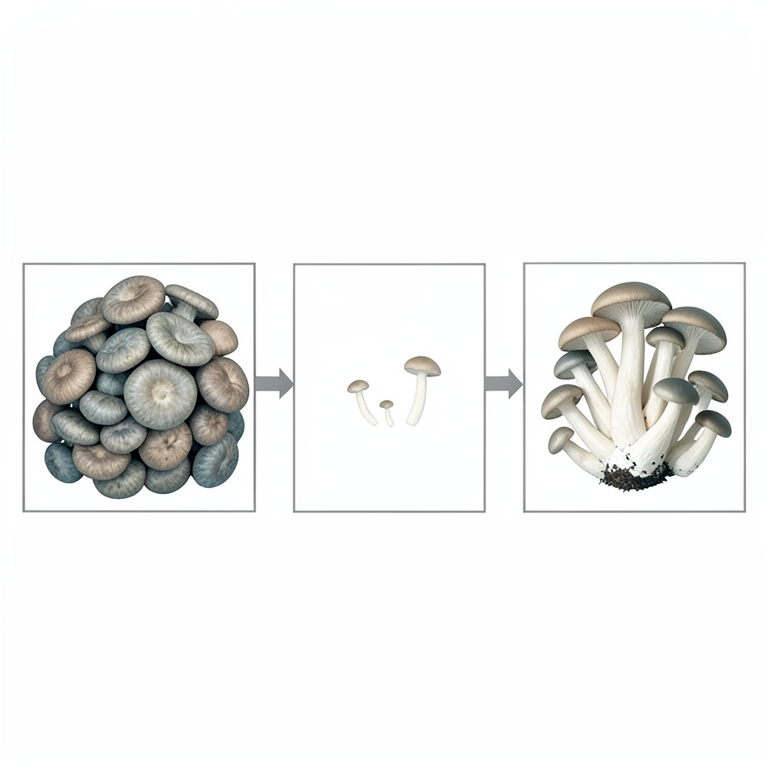
Mushroom Production Growth Waves
AI-generated conceptual illustration (Oyster and Button mushrooms grown in cultivation trays). It explains the idea and does not show study data.
View source evidence ↗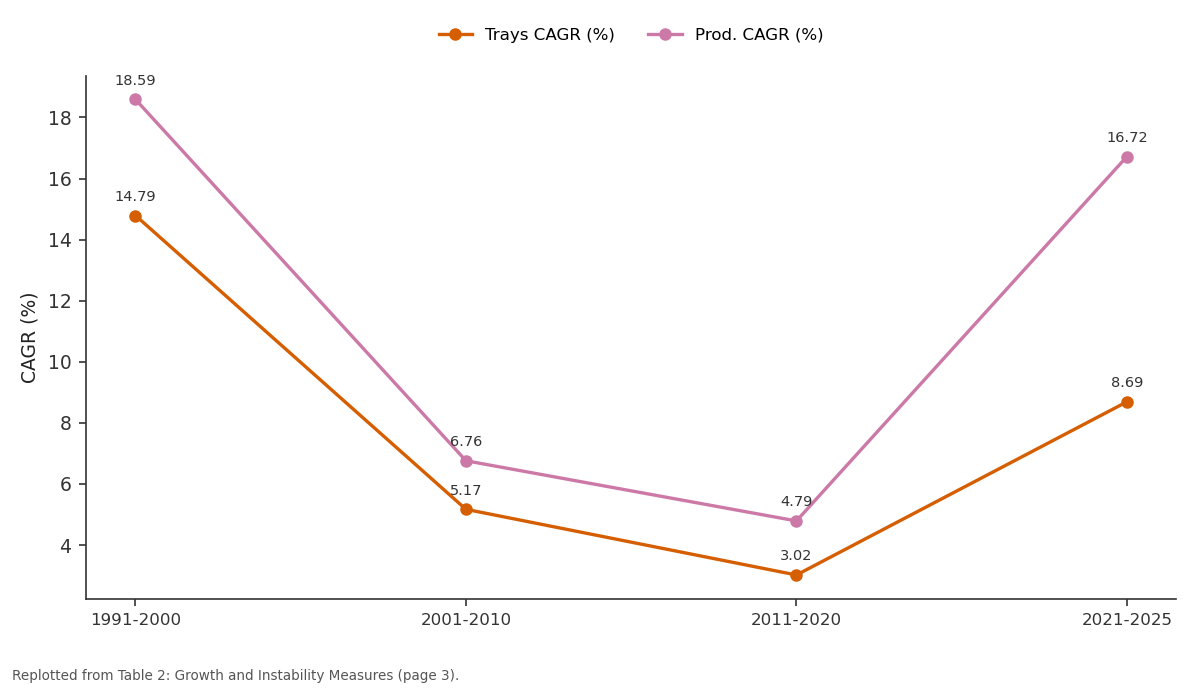
Trays CAGR (%) and Prod. CAGR (%): 1991-2000 vs 2001-2010 vs 2011-2020 vs 2021-2025
Replotted from Table 2 (page 3) of the original paper. Every bar is the paper's own table value.
View source evidence ↗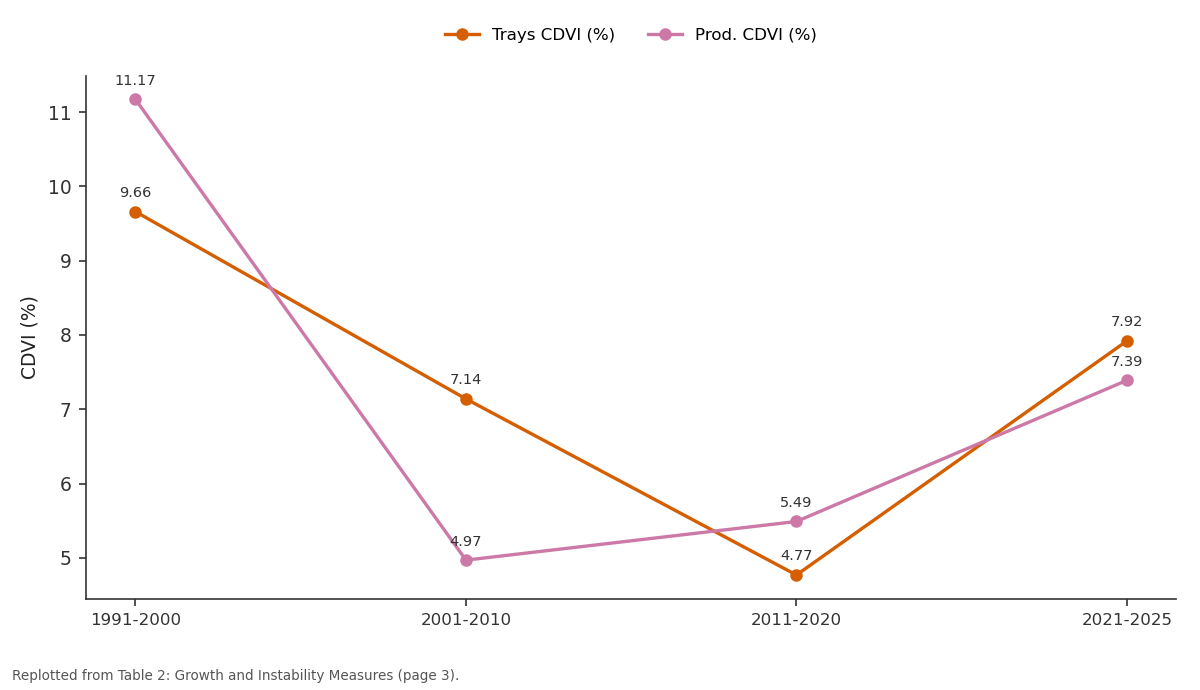
Trays CDVI (%) and Prod. CDVI (%): 1991-2000 vs 2001-2010 vs 2011-2020 vs 2021-2025
Replotted from Table 2 (page 3) of the original paper. Every bar is the paper's own table value.
View source evidence ↗Figures & tables
From the original paper Table 1
 Table 2
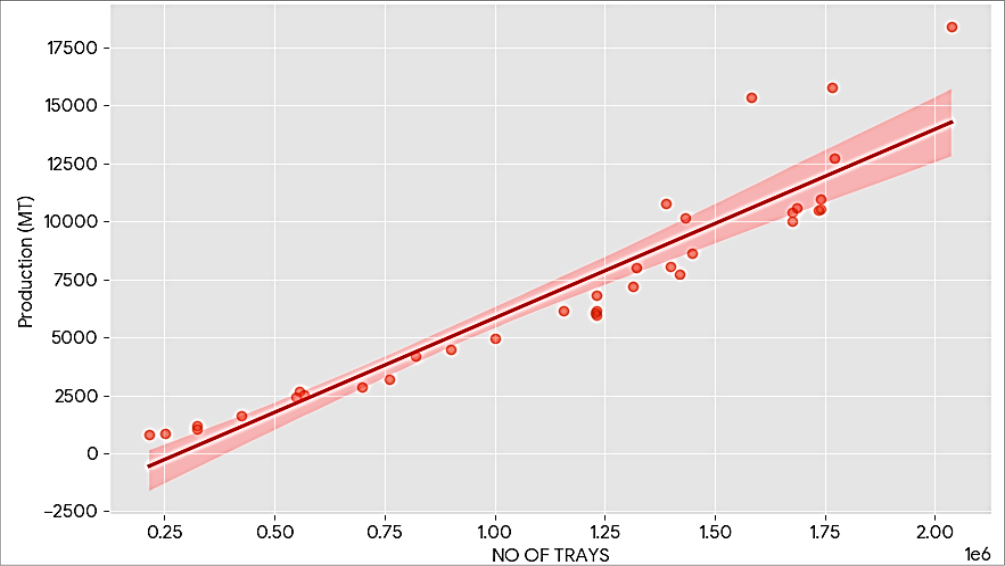 Figure 1
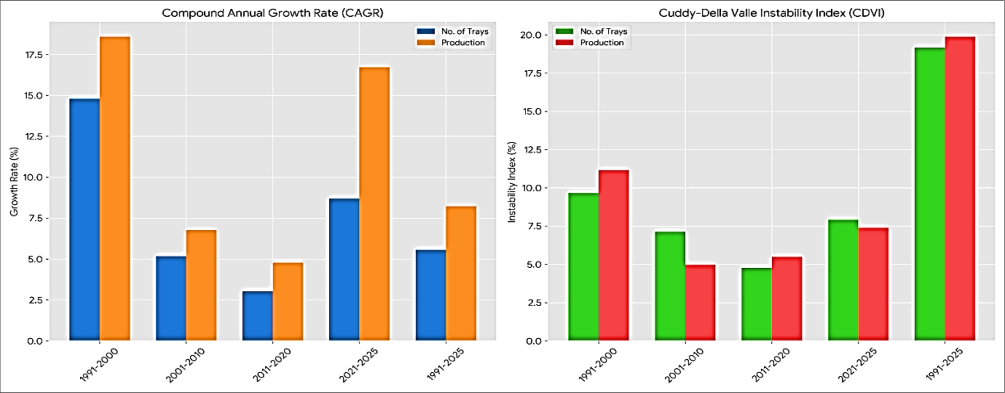 Figure 2
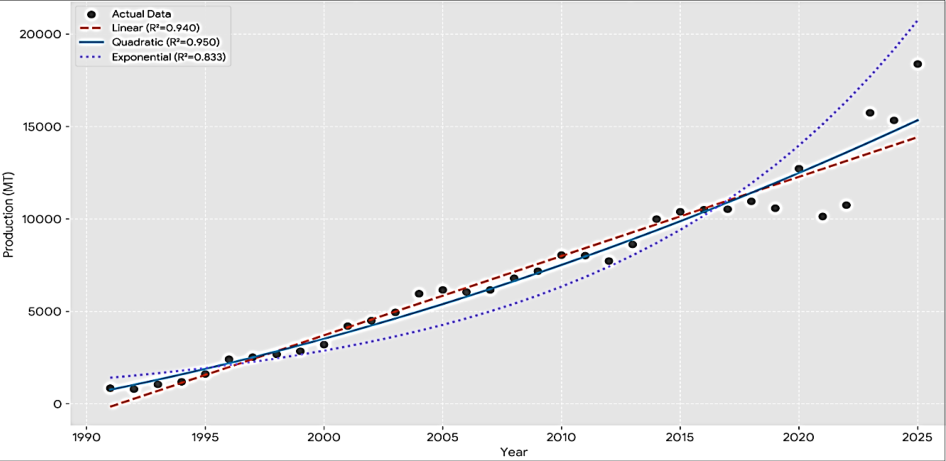 Figure 3
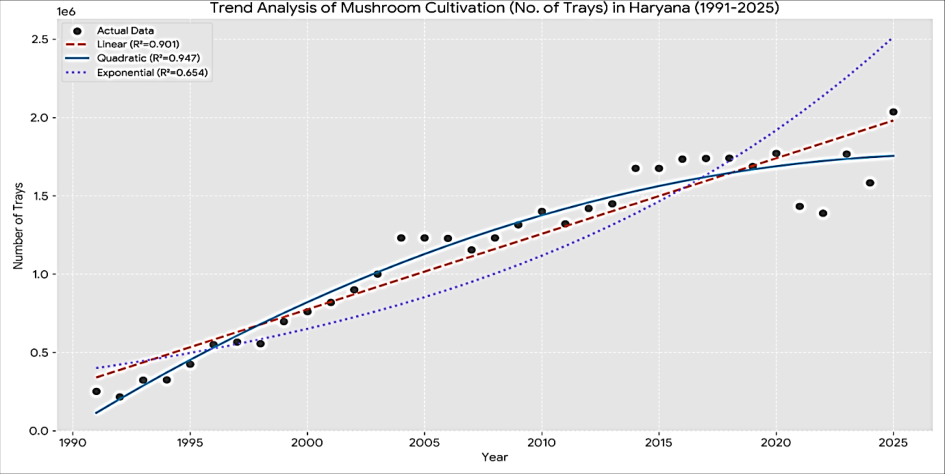 Figure 4
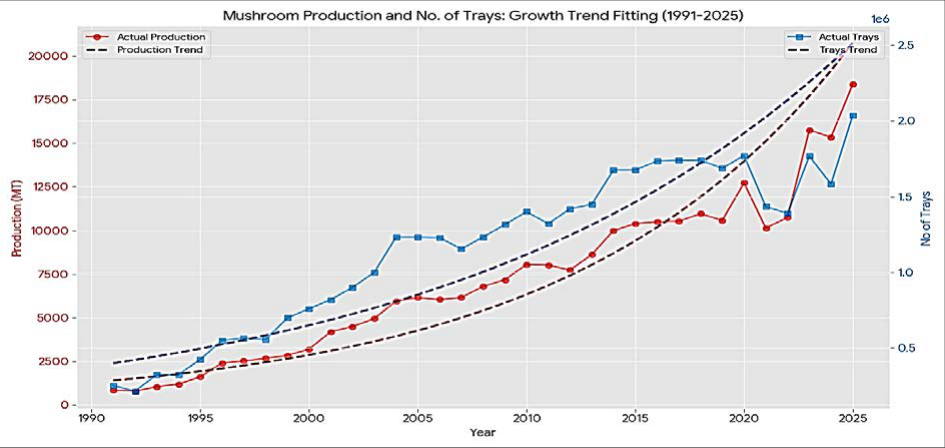 Figure 5
Introduction
Mushroom cultivation has emerged as one of the most significant diversified agricultural activities in India, offering a potent solution for nutritional security, waste management and rural employment. In the state of Haryana, often referred to as the "Mushroom Hub of India," this sector has transitioned from a seasonal, small-scale venture into a sophisticated commercial enterprise. Unlike traditional field crops, mushroom production is a land-saving, indoor activity that utilizes vertical space, making it an ideal subsidiary enterprise for small and marginal farmers. The economic importance of mushrooms in Haryana is underscored by their ability to convert lignocellulosic agricultural wastes-predominantly wheat and rice straw-into highquality proteinaceous food. As the state grapples with diminishing per capita land holdings, the high per-unit productivity of mushrooms offers a viable pathway for augmenting farm income. This study aims to quantify the long-term growth dynamics and the degree of instability in both infrastructure (number of trays) and output (production) over a comprehensive 35-year period (1991-2025), providing a data-driven perspective on the sector's evolution through various economic phases. Within India, Haryana, along with Punjab and Bihar, remains a dominant production hub, particularly for Agaricus bisporus (White Button Mushroom), which accounts for roughly 75-90% of the state's total output (Arunachalam et al., 2023) [2] . Singh et al. (2018) [13] conducted an economic assessment of mushroom growers in Haryana, revealing that the "economies of scale" operate significantly on large-sized farms, though small-scale seasonal growers contribute the bulk of the volume during winter months. A study from Krishi Vigyan Kendras (KVKs) in districts like Kurukshetra and Sonipat have highlighted that mushroom farming is a "quick monetary gain" vocation, with benefit-cost ratios typically ranging from 1.61 to 1.83 (Aditya & Bhatia, 2020) [1] . The use of the Cuddy-Della Valle Index (CDVI) in agricultural statistics is a standardized method to distinguish between genuine growth and mere fluctuations. Literature on crop instability in Haryana suggests that while horticultural crops often face high price instability, mushrooms maintain a relatively stable production environment due to controlled indoor conditions. However, structural shifts-such as the transition from seasonal "thatched hut" cultivation to year-round "environmentally controlled units" (ECUs)-introduce phases of variability, which are captured through multi-period instability analysis (Mishra et al., 2021) [6] .
Recent literature identifies a "Shroom Boom" post-2020, driven by rising health consciousness and the demand for vegan protein sources. This level of growth far exceeds the broader global mushroom market, which is estimated to grow at a CAGR of roughly 7% to 9% through 2030 (Sharma et al., 2024; Shonte et al., 2024) [10,12] . Sachan et al., (2019) and Singh et al., (2010) [8,14] emphasizes that Haryana, particularly districts like Sonipat and Gurgaon, serves as the "Mushroom Hub" of North India. Their studies highlight that mushroom production has historically shown an affirmative correlation with farm size and technological adoption. While the Linear model often captures the basic trajectory of agricultural output, Mishra et al., (2021) [6] argue that non-linear models like the Quadratic and Exponential functions are more appropriate for highvalue horticultural crops that experience "growth spurts" due to policy interventions or technological breakthroughs. National-level data analysed by James Paul (2023) [15] corroborates a sustained upward trajectory in Indian mushroom production, reporting a CAGR of approximately 9.77% between 1997 and 2021, mirroring the expansion phases observed in state-level datasets. A critical concern in agricultural planning is the distinction between steady growth and volatile fluctuations. The Cuddy-Della Valle Index (CDVI) has been identified as the superior metric for this purpose, as it de-trends the data to prevent the overestimation of instability that often occurs with the standard Coefficient of Variation (Pavani et al., 2025) [7] . Literature on Indian horticulture suggests that while many crops face high production instability due to weather dependency, mushrooms maintain lower CDVI values because of the controlled indoor environment (Aditya & Bhatia, 2020) [1] . However, Sharma et al., (2021) [11] note that instability often spikes during periods of structural transition such as the shift from "long method" composting to "short method" pasteurization-reflecting the temporary disruptions caused by new technology adoption. Koirala (2019) and Sharma (2021) [5,11] found that mushroom cultivation contributes significantly to farm income, often accounting for 43% to 72% of total earnings in medium to large categories.
Materials and Methods
Materials and Methods
Data Source
The study is based on secondary data pertaining to mushroom production and number of trays in Haryana. The data were collected from the official website of the Department of Horticulture, Haryana (Hort Haryana). The dataset covers a time period of 35 years, from 1990-91 to 2024-25. The data are annual in nature and represent aggregated state-level statistics.
Nature of Data
Two key variables were considered for analysis:
• Total mushroom production (in metric tonnes)
• Number of trays used for mushroom cultivation
The data were organized as a time series to examine changes over time. Prior to analysis, the dataset was checked for consistency, missing values and any abnormal observations.
Trend Analysis
To examine the long-term movement in mushroom production and number of trays, a linear trend model was fitted:
where 𝑌𝑌 𝑡𝑡 represents production or number of trays at time 𝑏𝑏, 𝑎𝑎 is the intercept, 𝑏𝑏 is the trend coefficient, and 𝜀𝜀 𝑡𝑡 is the random error term. The sign and magnitude of the coefficient 𝑏𝑏 indicate the direction and rate of change over time. A positive value of 𝑏𝑏 indicates an increasing trend, while a negative value indicates a declining trend.
Growth Rate Estimation
The compound growth rate of mushroom production and number of trays was estimated using a semi-log (log-linear) model: ln (𝑌𝑌 𝑡𝑡 ) = 𝛼𝛼 + 𝛽𝛽𝑏𝑏 The compound annual growth rate (CAGR) was computed as: 𝐶𝐶𝐶𝐶𝐶𝐶𝐶𝐶 = (𝑒𝑒 𝛽𝛽 -1) × 100 This method captures the exponential growth pattern and provides a more accurate measure of growth over time compared to simple averages.
Measurement of Instability
Instability in mushroom production and number of trays was measured using both the coefficient of variation (CV) and the Cuddy-Della Valle Index (CDVI). The coefficient of variation was calculated as: 𝐶𝐶𝐶𝐶 = 𝜎𝜎 𝜇𝜇 × 100, where 𝜎𝜎 is the standard deviation and 𝜇𝜇 is the mean. To account for the effect of trend in the data, the Cuddy-Della Valle Index was used:
where 𝐶𝐶 2 is the coefficient of determination obtained from the trend regression. The CDVI provides a more reliable measure of instability by eliminating the influence of longterm trend.
Results and Discussion Trend Fitting and Model Selection
The trend fitting analysis indicates that the expansion of mushroom cultivation in Haryana follows a non-linear path. The Quadratic model emerged as the best fit for both variables, suggesting that growth has not been constant but has accelerated or stabilized at different intervals.
Growth Rate Analysis (CAGR)
The industry experienced its most rapid expansion in the 1990s (Production CAGR: 18.59%). After a period of deceleration between 2001 and 2020, there is a notable "Second Wave" of growth in 2021-2025, with production growing at 16.72%.
Instability Analysis (CDVI)
Instability remained relatively low and manageable throughout the sub-periods (ranging from 4.97% to 11.17%). However, the overall period (1991-2025) shows a higher index (approx. 19.88%), reflecting the structural shifts and the transition from traditional to modern cultivation practices over 35 years.
Conclusion
The mushroom sector in Haryana has shown remarkable resilience and a recent return to high growth levels. The higher growth rate of production compared to the number of trays in the recent decade points towards improved vertical productivity (yield per tray). Future policies should focus on maintaining this stability while encouraging technological adoption to sustain the high growth observed in the 2020s.
Figures and tables from the paper
| Variable | Linear | Quadratic | Exponential |
|---|---|---|---|
| No. of Trays | 0.901 | 0.947 | 0.654 |
| Production (MT) | 0.94 | 0.95 | 0.833 |
Table text extracted from the original PDF; superscript letters are shown inline. The original table image is below.
View original table image
| Period | Trays CAGR (%) | Trays CDVI (%) | Prod. CAGR (%) | Prod. CDVI (%) |
|---|---|---|---|---|
| 1991-2000 | 14.79 | 9.66 | 18.59 | 11.17 |
| 2001-2010 | 5.17 | 7.14 | 6.76 | 4.97 |
| 2011-2020 | 3.02 | 4.77 | 4.79 | 5.49 |
| 2021-2025 | 8.69 | 7.92 | 16.72 | 7.39 |
| 1991-2025 | 5.56 | 19.16 | 8.23 | 19.88 |
Table text extracted from the original PDF; superscript letters are shown inline. The original table image is below.
View original table image
References
15 in the original paper- Aditya S, Bhatia JK. Economics of mushroom cultivation in North India: A case study. J Agric Ext Manag. 2020;21(2):45-58.
- Arunachalam A, Palanichamy NV, Rohini A, et al. Production, import and export trend of the mushroom industry in India. Asian J Agric Ext Econ Sociol. 2023;41(10):131-139.
- Arunachalam R, Jegadeesh R, Balasubramanian P. Status and future prospects of mushroom industry in India. Indian J Mushrooms. 2023;41(1):1-12.
- Cuddy JDA, Della Valle PA. Measuring the instability of time series data. Oxford Bull Econ Stat. 1978;40(1):79-85.
- Koirala M. Economics of mushroom production and its contribution to household income in Bagmati Province, Nepal. J Agric Nat Resour. 2019;2(1):201-212.
- Mishra P, Sahu PK, Dhekale BS, Vishwajith KP. Growth and instability analysis of horticultural crops in Haryana: A structural shift approach. Indian J Ext Educ. 2021;57(4):88-93.
- Pavani M, Sharon MM, Suseela K. Growth, instability and decomposition analysis of high-value crops in India. Asian J Agric Ext Econ Sociol. 2025;43(3):112125.
- Sachan S, Gohain N, Jawla SK. Cost-benefit analysis and marketing of mushroom in Haryana. J Agrometeorol. 2019;21(Special Issue):167-172.
- Sharma A, Singh P, Verma SK. Socio-economic impact of mushroom cultivation on livelihood security of farmers in Haryana. Indian J Agric Sci. 2021;91(4):512516.
- Sharma E, Bairwa R, Lal P, et al. Edible mushrooms trending in food: Nutrigenomics, bibliometric, from bench to valuable applications. Heliyon. 2024;10(19):36963.
- Sharma S. Profitability and contribution of mushroom cultivation to the livelihood of farmers in Nepal. Int J Appl Sci Biotechnol. 2021;9(3):194-201.
- Shonte TT, Mulla MF, Foley L, Pathania S. Mechanisms of action and preservation effects of packaging systems for mushrooms: Novel approaches to preserve Irish edible mushrooms. Coatings. 2024;14(2):172.
- Singh A, Kumar A, Singh P. Economic analysis of mushroom cultivation in Haryana. Econ Aff. 2018;63(2):433-438.
- Singh R, Bishnoi DK, Singh A. Cost benefit analysis and marketing of mushroom in Haryana. Agric Econ Res Rev. 2010;23(1):165-171.
- Hanson H, Astiazaran-Symonds E, Amendola LM, Balmaña J, Foulkes WD, James P, Klugman S, Ngeow J, Schmutzler R, Voian N, Wick MJ. Management of individuals with germline pathogenic/likely pathogenic variants in CHEK2: A clinical practice resource of the American College of Medical Genetics and Genomics (ACMG). Genetics in Medicine. 2023 Oct 1;25(10):100870.