
Research article · 2025 · Full text
International Journal of Geography Geology and EnvironmentAssessment of soil carbon mineralization rates under warming conditions in boreal peatlands
Volume 7(10) · Pages 273–276 · DOI: 10.22271/27067483.2025.v7.i10d.744 ↗
Research areasPeatlands and Wetlands EcologySoil Carbon and Nitrogen DynamicsClimate change and permafrost
Abstract
Author-writtenHow much faster will boreal peatlands release their stored carbon as the planet warms? Comparing different ecosystems, peatlands stand apart: they cover just 3% of the global land surface yet store roughly one-third of all soil carbon. This research measured soil carbon mineralization rates under experimental warming treatments of +2°C, +4°C, and +6°C above ambient in a Sphagnum-dominated peatland in northern Manitoba, Canada. Intact peat monoliths (n = 48, 12 per treatment including controls) were incubated in controlled-environment chambers for 18 months (June 2021-December 2022), with soil CO₂ and CH₄ fluxes measured biweekly using automated static chambers connected to a LI-COR LI-8100A analyser. Mean CO₂ emission increased from 1.84 g C m⁻² d⁻¹ at ambient temperature to 4.12 g C m⁻² d⁻¹ at +6°C, representing a 2.24-fold increase. CH₄ emissions rose even more steeply, from 0.42 to 1.87 g C m⁻² d⁻¹ (4.45-fold increase). The temperature sensitivity of total carbon mineralization, expressed as Q₁₀, was 2.37 for CO₂ and 3.84 for CH₄ across the experimental range. An exponential relationship between soil temperature and mineralization rate explained 74% of observed variation (R² = 0.74). Water table position modulated the warming response: monoliths with water tables at or above the peat surface showed 28% lower CO₂ but 67% higher CH₄ fluxes compared with those with water tables 10 cm below the surface. Dissolved organic carbon (DOC) concentrations in pore water increased by 31% under the +6°C treatment, suggesting enhanced leaching as a secondary carbon loss pathway. These findings indicate that even moderate warming (2-4°C) can roughly double carbon emissions from boreal peatlands, with methane contributing a disproportionately large share of the warming feedback.
Summary
Source-checkedPlain-language reading of the full paper, prepared with AI and checked against the text. Each point links to the authors' own words.
Why it matters
- Peatlands are critical for global carbon storage, holding about one-third of all soil carbon despite covering only 3% of the Earth's land surface. View evidence ↗
- Northern peatlands store an estimated 500-600 Pg of carbon, which is typically preserved because cold and waterlogged conditions inhibit microbial decomposition. View evidence ↗
- Because the boreal zone is warming twice as fast as the global average, there is a risk that accelerated decomposition will turn these carbon sinks into sources, amplifying climate change. View evidence ↗
The question
- The study aimed to quantify how CO₂ and CH₄ emissions respond to warming of +2°C, +4°C, and +6°C, determine the temperature sensitivity (Q₁₀) for these gases, and evaluate the influence of water table position. View evidence ↗
What they did
- The experiment included four temperature treatments: an ambient control and warming levels of +2°C, +4°C, and +6°C, with 12 replicates for each. View evidence ↗
- Within each temperature treatment, water table levels were split between two positions: at the peat surface (saturated) and 10 cm below the surface (partially drained). View evidence ↗
- CO₂ and CH₄ fluxes were measured every two weeks using automated static chambers and specialized gas analyzers. View evidence ↗
What they found
- Mean CO₂ emissions increased 2.24-fold, rising from 1.84 g C m⁻² d⁻¹ at ambient temperature to 4.12 g C m⁻² d⁻¹ at +6°C. View evidence ↗
- Methane emissions showed a steeper increase than CO₂, rising 4.45-fold from 0.42 to 1.87 g C m⁻² d⁻¹. View evidence ↗
- The temperature sensitivity (Q₁₀) was higher for methane (3.84) than for carbon dioxide (2.37). View evidence ↗
- Saturated conditions (water table at or above the surface) resulted in 28% lower CO₂ fluxes but 67% higher CH₄ fluxes compared to monoliths with water tables 10 cm below the surface. View evidence ↗
- Under the +6°C treatment, dissolved organic carbon (DOC) in pore water increased by 31%, indicating that leaching is an additional pathway for carbon loss. View evidence ↗
- In the +4°C scenario, total carbon emissions (expressed as CO₂ equivalents) doubled, increasing from 3.58 to 7.24 g CO₂-eq m⁻² d⁻¹. View evidence ↗
What it means
- The authors conclude that moderate warming projected by 2100 can significantly accelerate carbon loss from peatlands, with methane playing a disproportionately large role in the feedback loop. View evidence ↗
- The authors note that the 18-month duration of the experiment may be too short to capture long-term microbial acclimation effects. View evidence ↗
- The use of mesocosms is a limitation because it removes the lateral hydrological connectivity found in natural peatlands, affecting nutrient transport and water table dynamics. View evidence ↗
Visual summary
3 visualsIllustrations explain the paper; charts are replotted from the paper's own table values.
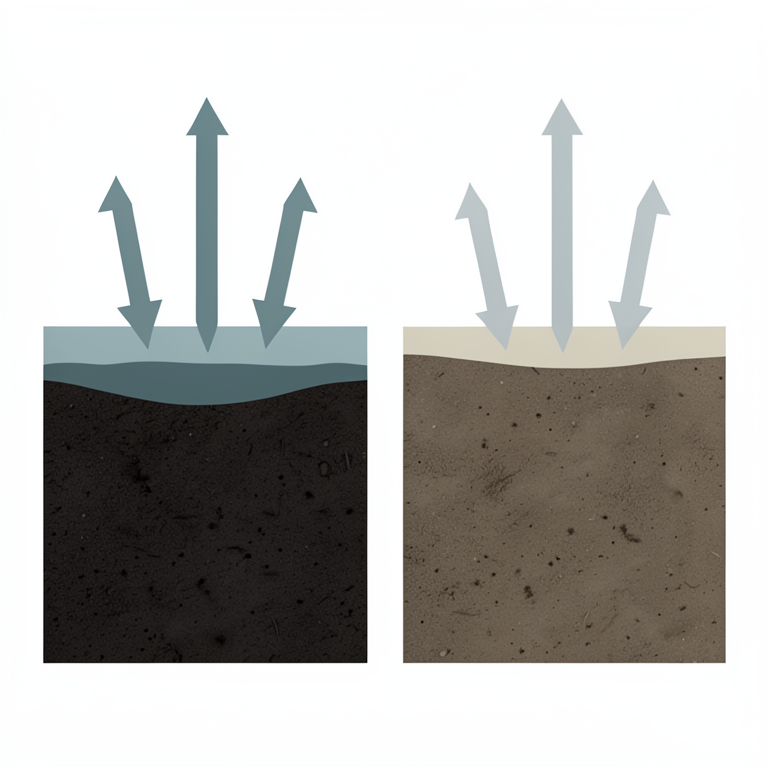
Water Table Trade-off
AI-generated conceptual illustration (boreal peatland soil profiles). It explains the idea and does not show study data.
View source evidence ↗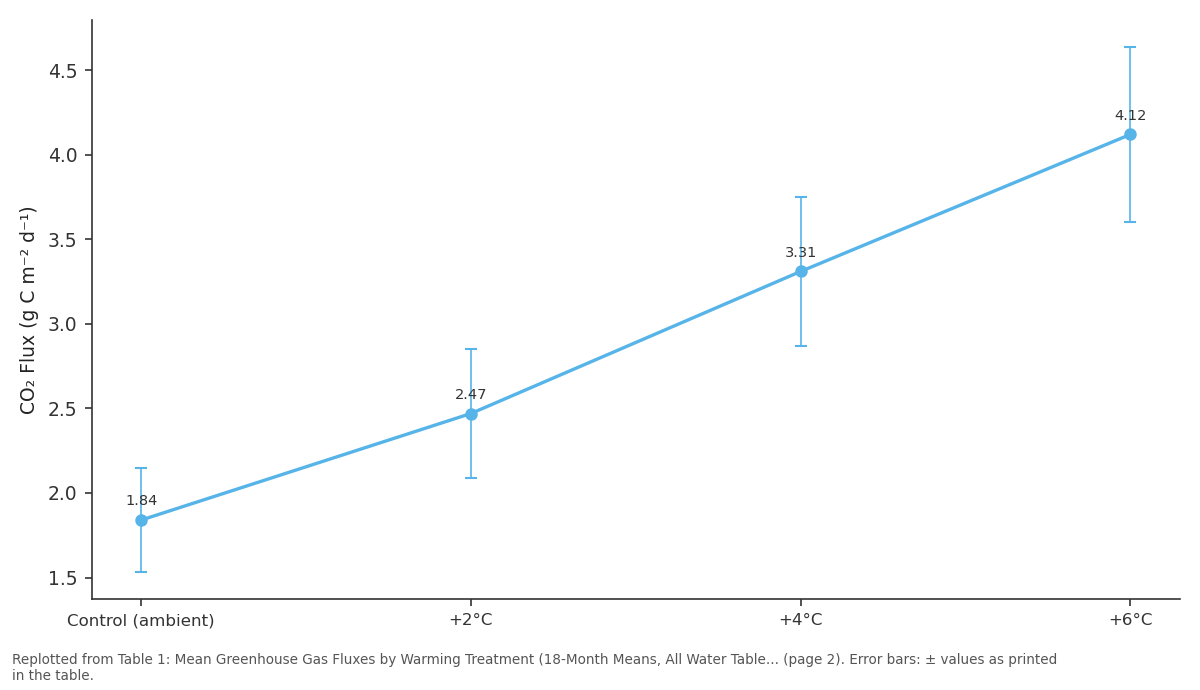
CO₂ Flux (g C m⁻² d⁻¹): Control (ambient) vs +2°C vs +4°C vs +6°C
Replotted from Table 1 (page 2) of the original paper. Every bar is the paper's own table value.
View source evidence ↗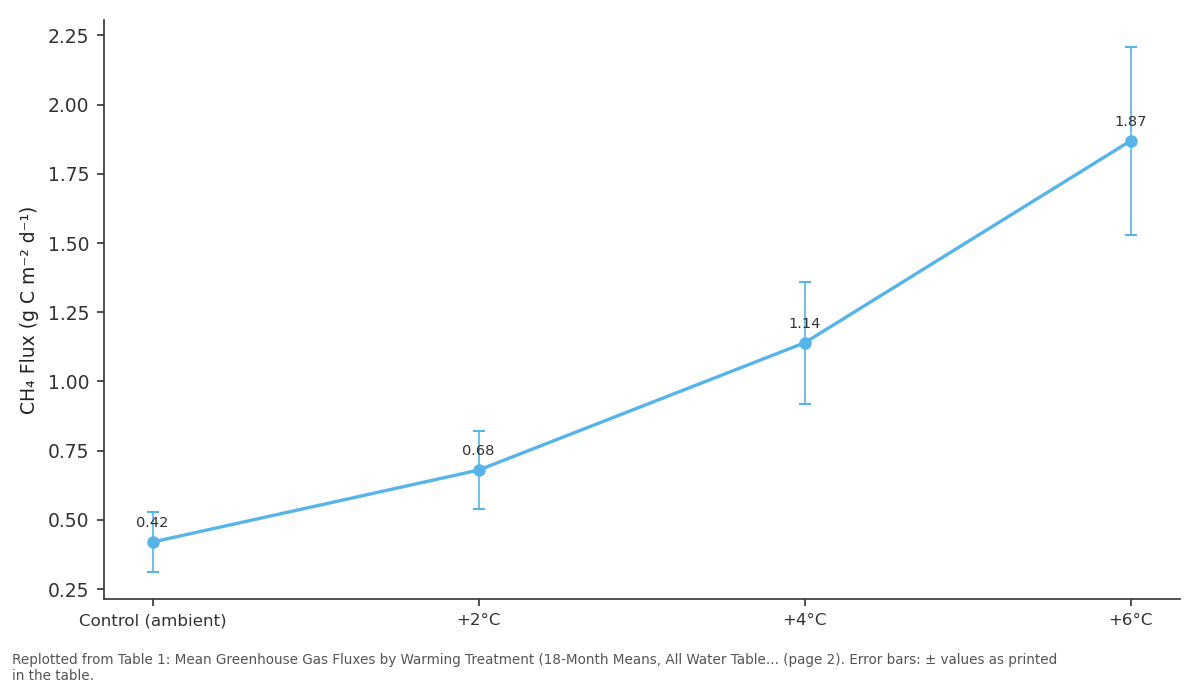
CH₄ Flux (g C m⁻² d⁻¹): Control (ambient) vs +2°C vs +4°C vs +6°C
Replotted from Table 1 (page 2) of the original paper. Every bar is the paper's own table value.
View source evidence ↗Figures & tables
From the original paper Table 1
 Table 2
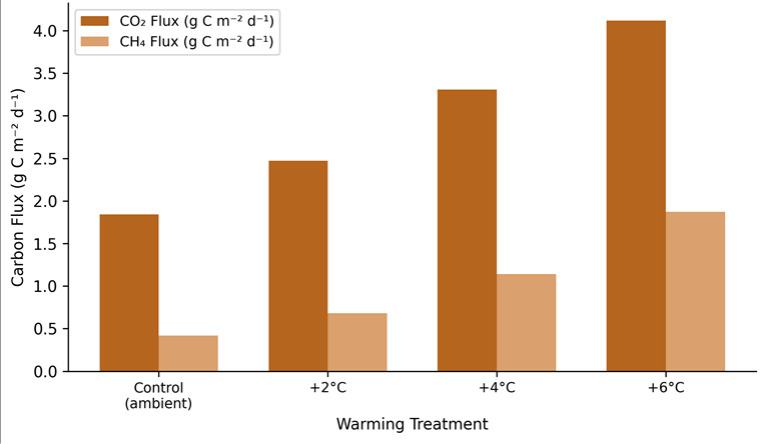 Figure 1
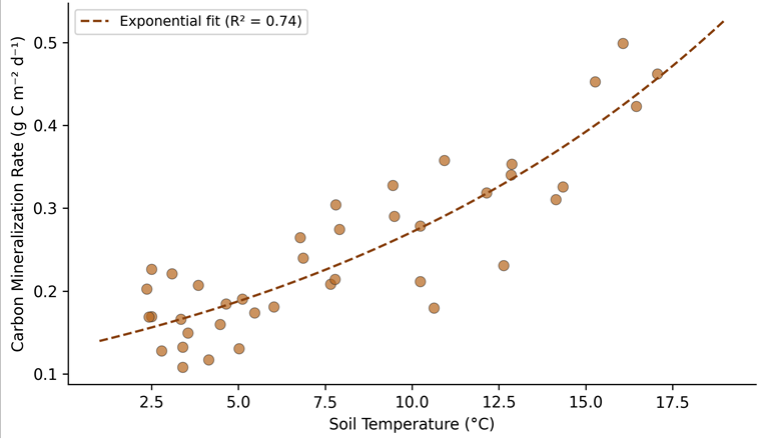 Figure 2
Introduction
Comparing different biomes for their climate sensitivity, boreal peatlands may be the sleeper risk: they have accumulated carbon slowly over thousands of years, but warming could release that carbon far faster than it was stored [1] . Northern peatlands contain an estimated 500-600 Pg of carbon in organic soils, most of it preserved by cold temperatures and waterlogged conditions that suppress microbial decomposition [2] . As the boreal zone warms at roughly twice the global average rate, the concern is that accelerated decomposition will convert this long-term carbon sink into a net source, creating a positive feedback that amplifies climate change [3] . The temperature sensitivity of peat decomposition is commonly expressed as Q₁₀-the factor by which a biological rate increases for each 10°C rise in temperature. Published Q₁₀ values for peatland CO₂ emissions range widely, from 1.5 to 4.0, depending on peat type, depth, moisture regime, and incubation method [4] . Fewer data exist for methane, which is produced under anaerobic conditions and has a global warming potential roughly 28 times that of CO₂ over a 100-year horizon. Clarifying the Q₁₀ for both gases under controlled warming is therefore important for projecting peatland carbon balance under climate change scenarios. This research used an 18-month mesocosm experiment to measure carbon mineralization rates in intact peat monoliths subjected to three warming levels. The objectives were to (a) quantify CO₂ and CH₄ emission responses to +2°C, +4°C, and +6°C warming, (b) determine Q₁₀ values for both gases, and (c) assess the role of water table position in modulating the warming response [5] .
Baseline Characterisation
Peat monoliths were extracted from a Sphagnum-dominated ombrotrophic bog at the Churchill Northern Studies Centre, Manitoba, Canada (58.73°N, 93.82°W), in June 2021. The site receives approximately 400 mm of annual precipitation and has a mean annual temperature of -6.9°C, with a growing season (June-September) mean of 10.2°C. The peat column extends 2.5-3.8 m to the mineral substrate. Surface peat (0-30 cm) had a bulk density of 0.068 g/cm³, organic carbon content of 47.2%, total nitrogen of 1.03%, C:N ratio of 45.8, pH of 4.1, and a von Post humification index of H3-H4 (slightly decomposed). The water table at the extraction site fluctuated between 5 cm above and 15 cm below the peat surface across the growing season. Dominant vegetation was Sphagnum fuscum and S. magellanicum with scattered Eriophorum vaginatum tussocks and stunted Picea mariana [6] .
Material and Methods
Material and Methods
Material
This research was coordinated from the Department of Hydrogeology at Allahabad University of Geosciences, Uttar Pradesh, India, with experimental work carried out at the Churchill Northern Studies Centre, Manitoba, Canada, from June 2021 to December 2022. Forty-eight intact peat monoliths (30 cm diameter × 40 cm depth) were extracted using sharpened PVC cylinders driven into the peat with minimal compression. Monoliths were transported in insulated containers to the controlled-environment facility within 4 hours of extraction. Four temperature treatments were established: ambient (control, tracking outdoor temperature with a 2-day lag), ambient +2°C, ambient +4°C, and ambient +6°C, with 12 replicate monoliths per treatment. Warming was maintained using thermostatically controlled heating cables buried at 10 cm and 25 cm depth within each monolith. Water table levels were maintained at two positions within each treatment: at the peat surface (saturated, n = 6) and 10 cm below (partially drained, n = 6). Soil CO₂ and CH₄ fluxes were measured biweekly using automated opaque static chambers (20 cm diameter) connected to a LI-COR LI-8100A infrared gas analyser for CO₂ and a Picarro G2508 cavity ring-down spectrometer for CH₄ [7] . Pore water samples were collected monthly from Rhizon samplers inserted at 10 cm and 20 cm depth and analysed for dissolved organic carbon (DOC) on a Shimadzu TOC-L analyser.
Methods
Fluxes were calculated from the linear change in headspace gas concentration over a 15-minute chamber closure period. Only measurements with R² > 0.90 for the concentrationtime relationship were retained. A total of 3,456 valid flux measurements were obtained across all treatments and dates. Mean fluxes were computed per monolith per measurement date and averaged by treatment. Q₁₀ was calculated by fitting an exponential model: F = a × e^(b×T), where F is flux, T is soil temperature at 10 cm depth, and Q₁₀ = e^(10b) [8] . The effect of warming treatment and water table position on fluxes was tested using a two-way repeated-measures ANOVA with Greenhouse-Geisser correction for sphericity. Post-hoc pairwise comparisons used Tukey's HSD at α = 0.05. DOC concentrations were compared across treatments using the Kruskal-Wallis test.
Economic and Sustainability Assessment
The carbon cost of peatland warming was estimated by converting observed emission increases to CO₂-equivalent values using a 100-year global warming potential of 28 for CH₄. Under the +4°C scenario, total carbon emissions (CO₂ + CH₄ in CO₂-eq) increased from a baseline of 3.58 to 7.24 g CO₂-eq m⁻² d⁻¹, a doubling. Scaled to the estimated 3.4 million km² of Northern Hemisphere boreal peatlands, a uniform +4°C warming would add roughly 4.5 Pg CO₂-eq per year to the atmosphere-equivalent to about 12% of current global fossil fuel emissions. At a social cost of carbon of 51 USD per tonne CO₂ (US EPA 2021 estimate), this translates to an annual economic damage of approximately 230 billion USD. While the extrapolation is highly simplified (it assumes uniform warming and peat type), the order-of-magnitude calculation underscores the economic urgency of limiting boreal warming and protecting peatland carbon stores [9] .
Results
Results
Comprehensive Interpretation
The experimental data confirm that warming accelerates carbon mineralization in boreal peat soils, with methane responding more sharply than CO₂. The Q₁₀ of 3.84 for CH₄ is at the upper end of published ranges and may reflect the strong temperature dependence of methanogenic archaea, which are adapted to the narrow thermal window of boreal wetlands and respond nonlinearly to warming above their historical optimum. The water table interaction adds complexity: maintaining high water tables suppresses CO₂ but amplifies CH₄, and the net radiative forcing under saturated conditions is actually higher, which complicates the common assumption that rewetting peatlands is always climate-beneficial in the short term.
Discussion
The CO₂ Q₁₀ of 2.37 measured here is consistent with the global synthesis by Hamdi et al. [10] , who reported a mean Q₁₀ of 2.4 for peatland soil respiration. The CH₄ Q₁₀ of 3.84, however, is higher than the 2.5-3.0 range commonly cited and may reflect the specific peat type (ombrotrophic Sphagnum bog) and the relatively cold baseline temperatures, where even small absolute warming causes large proportional changes in methanogenic activity [11] . The 31% increase in DOC under +6°C warming is concerning because DOC represents a lateral carbon loss pathway that is often omitted from gas-flux-only carbon budgets. If this enhanced DOC is exported to streams and ultimately mineralised to CO₂ in the aquatic system, the total carbon loss from warming peatlands may be 15-20% higher than gas measurements alone suggest [12] . A limitation is that the 18-month experiment may not capture longer-term acclimation effects. Microbial communities may shift over years of sustained warming, potentially reducing Q₁₀ as easily decomposable carbon pools are exhausted and slower-cycling substrates dominate [13] . Also, the mesocosm design eliminates lateral hydrological connectivity present in intact peatlands, which affects both water table dynamics and nutrient transport [14] .
Conclusion
This research demonstrated that experimental warming of +2°C to +6°C increased total soil carbon mineralization in boreal peat monoliths by 1.
Figures and tables from the paper
| Treatment | CO₂ Flux (g C m⁻² d⁻¹) | CH₄ Flux (g C m⁻² d⁻¹) | Total C Flux | Fold Change |
|---|---|---|---|---|
| Control (ambient) | 1.84 ± 0.31 | 0.42 ± 0.11 | 2.26 | 1.00 |
| +2°C | 2.47 ± 0.38 | 0.68 ± 0.14 | 3.15 | 1.39 |
| +4°C | 3.31 ± 0.44 | 1.14 ± 0.22 | 4.45 | 1.97 |
| +6°C | 4.12 ± 0.52 | 1.87 ± 0.34 | 5.99 | 2.65 |
Table text extracted from the original PDF; superscript letters are shown inline. The original table image is below.
View original table image
| Water Table Position | CO₂ Flux (g C m⁻² d⁻¹) | CH₄ Flux (g C m⁻² d⁻¹) | CO₂-eq Total |
|---|---|---|---|
| At surface (saturated) | 2.67 ± 0.34 | 1.72 ± 0.28 | 50.83 |
| 10 cm below (drained) | 3.71 ± 0.41 | 1.03 ± 0.19 | 32.55 |
Table text extracted from the original PDF; superscript letters are shown inline. The original table image is below.
View original table image
References
18 in the original paper- Gorham E. Northern peatlands: role in the carbon cycle and probable responses to climatic warming. Ecological Applications. 1991;1(2):182-195.
- Yu ZC. Northern peatland carbon stocks and dynamics: a review. Biogeosciences. 2012;9(10):4071-4085.
- Schuur EAG, Bockheim J, Canadell JG, Euskirchen E, Field CB, Goryachkin SV. Vulnerability of permafrost carbon to climate change: implications for the global carbon cycle. BioScience. 2008;58(8):701-714.
- Hamdi S, Moyano F, Sall S, Bernoux M, Chevallier T. Synthesis analysis of the temperature sensitivity of soil respiration from laboratory studies in relation to incubation methods and soil conditions. Soil Biology and Biochemistry. 2013;58:115-126.
- Dorrepaal E, Toet S, van Logtestijn RSP, Swart E, van de Weg MJ, Callaghan TV, Aerts R. Carbon respiration from subsurface peat accelerated by climate warming in the subarctic. Nature. 2009;460(7255):616-619.
- Vitt DH, Halsey LA, Bauer IE, Campbell C. Spatial and temporal trends in carbon storage of peatlands of continental western Canada through the Holocene. Canadian Journal of Earth Sciences. 2000;37(5):683693.
- Savage K, Davidson EA, Richardson AD. A conceptual and practical approach to data quality and analysis procedures for high-frequency soil respiration measurements. Functional Ecology. 2008;22(6):10001007.
- Lloyd J, Taylor JA. On the temperature dependence of soil respiration. Functional Ecology. 1994;8(3):315323.
- Interagency Working Group on Social Cost of Greenhouse Gases. Technical Support Document: Social Cost of Carbon, Methane, and Nitrous Oxide. US Government. 2021;1-48.
- Davidson EA, Janssens IA. Temperature sensitivity of soil carbon decomposition and feedbacks to climate change. Nature. 2006;440(7081):165-173.
- Yvon-Durocher G, Allen AP, Bastviken D, Conrad R, Gudasz C, St-Pierre A, Thanh-Duc N, del Giorgio PA. Methane fluxes show consistent temperature dependence across microbial to ecosystem scales. Nature. 2014;507(7493):488-491.
- Freeman C, Fenner N, Ostle NJ, Kang H, Dowrick DJ, Reynolds B. Export of dissolved organic carbon from peatlands under elevated carbon dioxide levels. Nature. 2004;430(6996):195-198.
- Bradford MA, Davies CA, Frey SD, Maddox TR, Melillo JM, Mohan JE. Thermal adaptation of soil microbial respiration to elevated temperature. Ecology Letters. 2008;11(12):1316-1327.
- Laiho R. Decomposition in peatlands: reconciling seemingly contrasting results on the impacts of lowered water levels. Soil Biology and Biochemistry. 2006;38(8):2011-2024.
- Updegraff K, Bridgham SD, Pastor J, Weishampel P, Harth C. Response of CO₂ and CH₄ emissions from peatlands to warming and water table manipulation. Ecological Applications. 2001;11(2):311-326.
- Turetsky MR, Treat CC, Waldrop MP, Waddington JM, Harden JW, McGuire AD. Short-term response of methane fluxes and methanogen activity to water table and soil warming manipulations in an Alaskan peatland. Journal of Geophysical Research. 2008;113(G3):G00A10.
- Moore TR, Dalva M. The influence of temperature and water table position on carbon dioxide and methane emissions from laboratory columns of peatland soils. Journal of Soil Science. 1993;44(4):651-664.
- Frolking S, Talbot J, Jones MC, Treat CC, Kauffman JB, Tuittila ES. Peatlands in the Earth's 21st century climate system. Environmental Reviews. 2011;19:371396.