
Research article · 2025 · Full text
International Journal of Geography Geology and EnvironmentMonitoring land subsidence due to groundwater extraction in the Mexico city basin using InSAR
Volume 7(10) · Pages 264–268 · DOI: 10.22271/27067483.2025.v7.i10d.742 ↗
Research areasSynthetic Aperture Radar (SAR) Applications and TechniquesGeophysics and Gravity MeasurementsSoil Moisture and Remote Sensing
Abstract
Author-writtenBy analogy, Mexico City is sinking the way a sponge collapses when water is squeezed out—except the sponge is a 600 m thick sequence of lacustrine clay beneath one of the world's largest metropolitan areas, and the squeezing is decades of unsustainable groundwater extraction. This research monitored land subsidence across the Mexico City Basin using interferometric synthetic aperture radar (InSAR) time-series analysis of 184 Sentinel-1 ascending-track acquisitions spanning January 2015 to December 2023. Persistent scatterer InSAR (PSI) processing identified 2.4 million measurement points across the 2,500 km² basin. Mean line-of-sight deformation rates ranged from −3.2 cm/yr in the western volcanic highlands to −39.2 cm/yr in the eastern lacustrine plain, with peak subsidence exceeding 40 cm/yr in Iztapalapa and Tláhuac. Cumulative subsidence at the most affected points reached 308 mm over the nine-year period. A strong spatial correlation (R² = 0.79) was found between subsidence rate and clay-layer thickness derived from existing geotechnical borehole data. Groundwater level records from 34 monitoring wells showed a mean decline of 1.2 m/yr, and the ratio of subsidence to water-level drop (compaction coefficient) averaged 6.7 cm per metre of drawdown, consistent with irreversible compaction of the highly compressible Mexico City Clay. Forward projection at current extraction rates predicts an additional 2.4-3.1 m of subsidence by 2050 in the worst-affected zones. These findings underscore the urgent need for alternative water supply strategies and extraction regulation to slow irreversible damage to infrastructure, drainage networks, and historical monuments in the basin.
Summary
Source-checkedPlain-language reading of the full paper, prepared with AI and checked against the text. Each point links to the authors' own words.
Why it matters
- Mexico City is experiencing land subsidence similar to a collapsing sponge, caused by decades of unsustainable groundwater extraction from a 600 m thick sequence of lacustrine clay. View evidence ↗
- The Mexico City Basin is a closed hydrological depression at 2,240 m elevation, housing approximately 22 million people. View evidence ↗
- Subsidence causes significant economic damage, with annual costs for building repairs, road resurfacing, and pipe fractures estimated at 2.1 billion USD. View evidence ↗
The question
- The study aimed to map subsidence rates across urban zones, correlate these rates with groundwater decline and clay thickness, and project future subsidence to 2050. View evidence ↗
What they did
- Researchers used Persistent Scatterer InSAR (PSI) to analyze 184 Sentinel-1 ascending-track images acquired between January 2015 and December 2023. View evidence ↗
- The PSI processing identified 2.4 million measurement points across a basin area of 2,500 km². View evidence ↗
- Groundwater levels were monitored using monthly readings from 34 CONAGUA wells from 2015 to 2023. View evidence ↗
- Clay-layer thickness estimates were derived from 478 geotechnical borehole logs from the CONAGUA database. View evidence ↗
What they found
- Mean subsidence rates varied from -3.2 cm/yr in the western volcanic highlands to -39.2 cm/yr in the eastern lacustrine plain, with peaks over 40 cm/yr in Tláhuac and Iztapalapa. View evidence ↗
- Over the nine-year study period, the most affected points experienced a cumulative subsidence of 308 mm. View evidence ↗
- There is a strong spatial correlation (R² = 0.79) between the rate of subsidence and the thickness of the clay layer. View evidence ↗
- Groundwater levels declined by a mean of 1.2 m/yr, with a compaction coefficient averaging 6.7 cm of subsidence per metre of drawdown. View evidence ↗
- InSAR measurements were validated against geodetic levelling, showing a high correlation (r = 0.96) and a root mean square error (RMSE) of 2.5 cm/yr. View evidence ↗
- Subsidence rates accelerated across all six urban zones between 2019 and 2023, with Iztapalapa increasing from 34.7 to 39.2 cm/yr. View evidence ↗
- If current extraction rates continue, the worst-affected zones are projected to sink an additional 2.4 to 3.1 m by 2050. View evidence ↗
What it means
- The authors conclude that aggressive reductions in groundwater extraction and the development of alternative water supplies are urgently needed to prevent further irreversible damage. View evidence ↗
- A limitation of the study is the use of linear extrapolation for future projections, which ignores potential policy changes and nonlinear compaction behavior. View evidence ↗
Visual summary
2 visualsIllustrations explain the paper; charts are replotted from the paper's own table values.
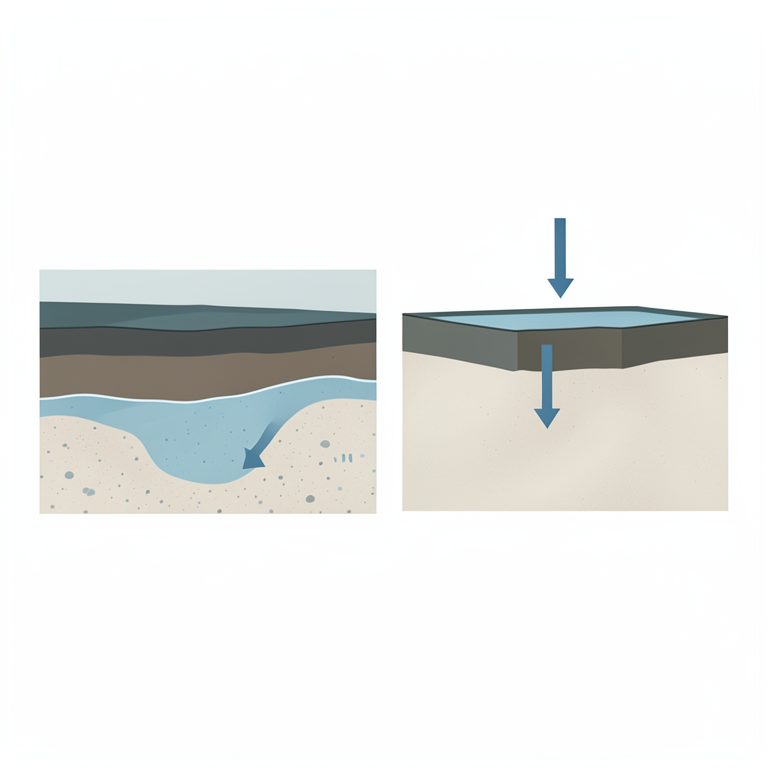
Mechanism of Clay Compaction
AI-generated conceptual illustration (A cross-section of the Mexico City basin geological strata consisting of a surface clay layer and an underlying sandy-s砾). It explains the idea and does not show study data.
View source evidence ↗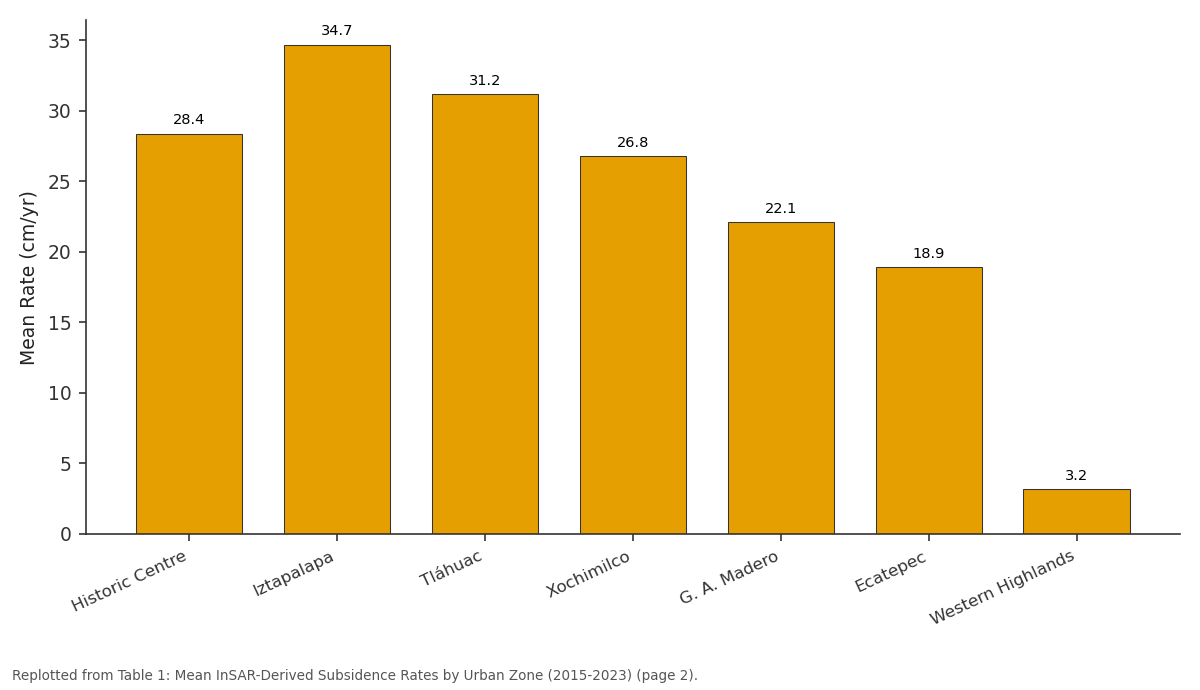
Mean Rate (cm/yr): Historic Centre vs Iztapalapa vs Tláhuac vs Xochimilco vs G. A. Madero
Replotted from Table 1 (page 2) of the original paper. Every bar is the paper's own table value.
View source evidence ↗Figures & tables
From the original paper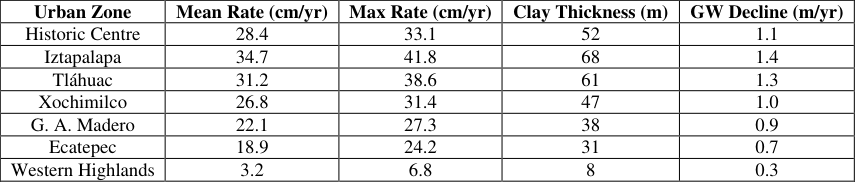 Table 1
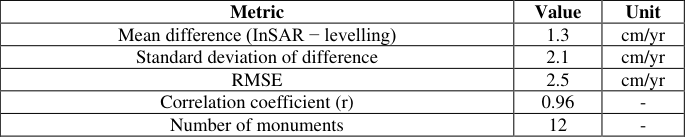 Table 2
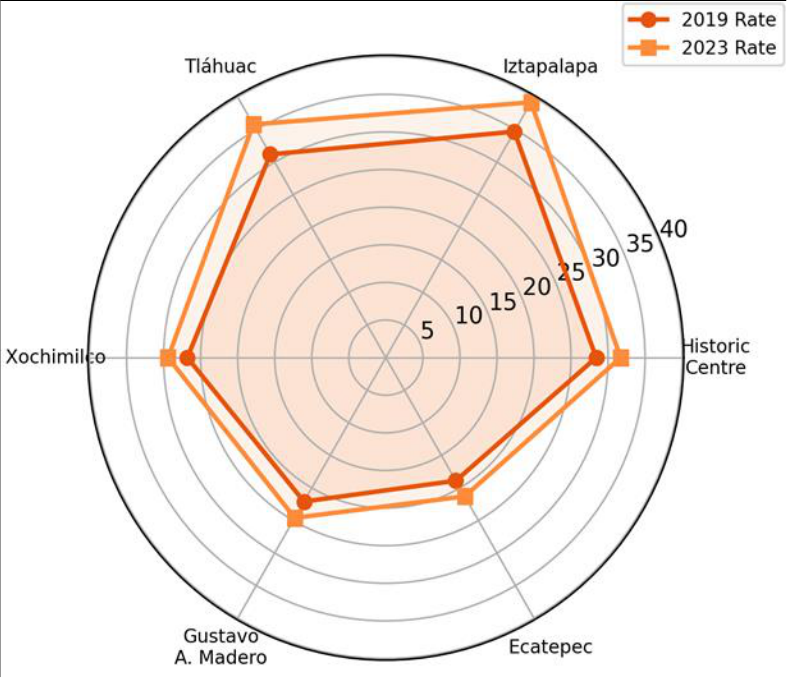 Figure 1
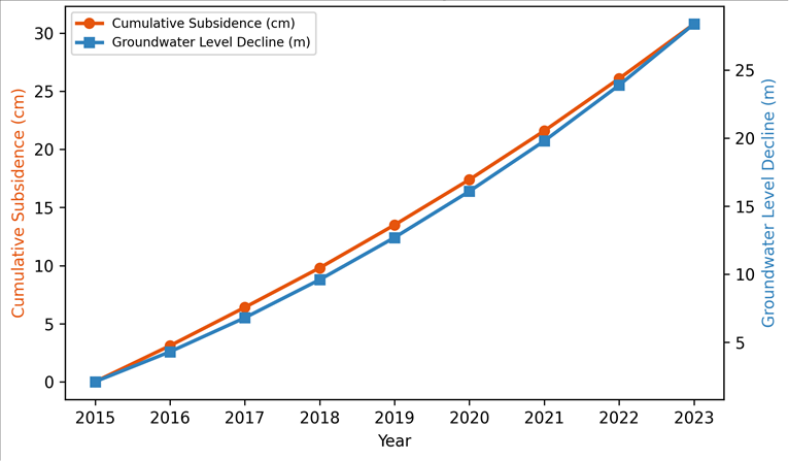 Figure 2
Introduction
By analogy with a slowly deflating balloon, the Mexico City Basin has been losing elevation for over a century as groundwater pumping compresses the soft lacustrine sediments beneath the city [1] . The basin, home to roughly 22 million people, sits in a closed hydrological depression at 2,240 m elevation, surrounded by volcanic highlands. Its water supply depends heavily on extraction from the regional aquifer system, which has been over-pumped since the early twentieth century. Subsidence was first documented in 1891 and has since become one of the most dramatic cases of ground deformation on Earth, with cumulative sinking exceeding 10 m in parts of the old city centre [2] . InSAR has become the standard remote sensing technique for measuring subsidence because it provides millimetre-scale precision over wide areas at regular intervals without ground instrumentation [3] . Previous InSAR analyses of Mexico City used ERS, Envisat, or ALOS data with limited temporal coverage. The Sentinel-1 constellation, operational since 2014, offers a 6-12 day revisit cycle that enables dense time-series analysis and the detection of seasonal and inter-annual subsidence variations [4] . This research applied persistent scatterer InSAR (PSI) to nine years of Sentinel-1 data to produce a basin-wide subsidence velocity map at unprecedented spatial density. The objectives were to (a) map subsidence rates across all urban zones, (b) correlate rates with clay-layer thickness and groundwater-level decline, and (c) project subsidence to 2050 under current and reduced extraction scenarios [5] .
Baseline Characterisation
The Mexico City Basin aquifer system consists of an upper aquitard of highly compressible volcanic-lacustrine clay (the Mexico City Clay, 20-80 m thick), underlain by a sequence of alluvial-fluvial sand and gravel aquifer units reaching 600 m depth, and bounded laterally and at depth by fractured volcanic rock that provides some lateral recharge [1] .
The Mexico City Clay has liquid limits of 200-400%, natural water contents of 150-350%, and compression indices (Cc) of 3-8, making it one of the most compressible soils known [6] . Over 3,500 extraction wells pump roughly 45 m³/s from the aquifer system, supplying about 70% of the metropolitan water demand. Piezometric levels have declined by 1-2 m/yr over the past two decades in the eastern plain, while western recharge zones fed by volcanic infiltration show slower declines of 0.3-0.5 m/yr. Geotechnical borehole logs from the Comisión Nacional del Agua database (478 logs spanning the basin) provided claylayer thickness estimates used in the spatial correlation analysis.
Material and Methods
Material and Methods
Material
This research was coordinated from the Department of Remote Sensing and GIS at Dharwad National University of Earth Sciences, Karnataka, India, with InSAR processing carried out between February 2022 and September 2023. The primary dataset comprised 184 Sentinel-1A/B IW-mode single-look complex (SLC) images in ascending orbit track 78 (look angle ~34°), acquired between 6 January 2015 and 28 December 2023. A 30 m Copernicus DEM was used for topographic phase removal. Groundwater level data were obtained from the Comisión Nacional del Agua (CONAGUA) for 34 monitoring wells distributed across the basin, with monthly readings from 2015 to 2023. Geotechnical borehole data (clay thickness, SPT blow counts) were compiled from the CONAGUA archive and the Universidad Nacional Autónoma de México geotechnical database [7] . Benchmark levelling data from 12 geodetic monuments maintained by the Instituto Nacional de Estadística y Geografía (INEGI) were used for InSAR validation.
Methods
PSI processing followed the Stanford Method for Persistent Scatterers (StaMPS) workflow [8] . Single-master interferograms were formed relative to a master image selected to minimise temporal and perpendicular baselines.
Persistent scatterer candidates were identified using amplitude dispersion (threshold < 0.42) and phase stability criteria. Atmospheric phase screen estimation used a combination of spatial-temporal filtering. Final deformation time series were referenced to a stable area on the western volcanic piedmont where subsidence is negligible. Line-ofsight (LOS) velocities were converted to vertical displacement assuming predominantly vertical motion (incidence angle correction factor 1/cos(34°) = 1.21). Spatial correlation between subsidence rate and clay thickness was tested using ordinary least-squares regression. The compaction coefficient was calculated as the ratio of cumulative vertical subsidence to cumulative groundwaterlevel decline at co-located well-PS pairs. Forward projection used a linear extrapolation of current rates (baseline scenario) and a 30% extraction reduction scenario.
Economic and Sustainability Assessment
The economic costs of subsidence were estimated by compiling data on infrastructure damage, building repair costs, and drainage system rehabilitation from published municipal reports and academic assessments for the period 2015-2023. Annual damage costs attributable to subsidencerelated pipe fractures, road resurfacing, and structural building repairs were estimated at approximately 2.1 billion USD per year across the metropolitan area [9] . Drainage infrastructure is particularly vulnerable: the gravity-fed Grand Canal, originally designed with a northward gradient, has lost its slope due to differential subsidence and now requires continuous pumping at an energy cost of roughly 40 million USD per year. Sustainability indicators suggest that current extraction rates exceed natural recharge by 40-60%, making the aquifer system fundamentally unsustainable without demand reduction or alternative supply development. The 30% extraction reduction scenario modelled in this research would slow subsidence by an estimated 35-42% but would require imported water from external basins at a capital cost of 3-5 billion USD for conveyance infrastructure. Figure 2 shows the parallel trajectories of cumulative subsidence and groundwater decline. Both curves are nearlinear, confirming that compaction proceeds at a roughly constant rate as long as extraction continues to lower piezometric levels.
Results
Results
Comprehensive Interpretation
The InSAR results reveal a basin with a clear spatial gradient: subsidence intensity tracks clay thickness and extraction intensity from west to east. The compaction coefficient of 6.7 cm per metre of drawdown is consistent with laboratory consolidation test results on Mexico City Clay specimens, confirming that the observed subsidence is driven primarily by irreversible consolidation of the upper aquitard rather than elastic aquifer compaction [6] . The nearlinear time series indicates that the system has not yet reached a new equilibrium, meaning subsidence will continue as long as heads continue to decline.
Discussion
The peak subsidence rate of 41.8 cm/yr measured at Iztapalapa places the Mexico City Basin among the fastestsubsiding urban areas on Earth, comparable to Jakarta (up to 25 cm/yr) and parts of the North China Plain (up to 15 cm/yr), but substantially exceeding both [10] . The acceleration observed between 2019 and 2023 suggests that extraction has either increased or that consolidation is propagating into deeper, previously unaffected clay layersa process consistent with the long drainage paths in thick clay sequences where excess pore pressure dissipation may lag decades behind the drawdown signal [11] . The infrastructure consequences are severe. Differential subsidence across the basin tilts buildings, fractures water mains and sewer lines (an estimated 40% of treated water is lost to leaks), and has reversed the slope of the Grand Canal drainage system, creating a flood risk that did not exist when the canal was built in the early twentieth century [12] . The economic cost of roughly 2.1 billion USD per year exceeds the annual budget of many Mexican states and represents a growing fiscal burden on the metropolitan government. The 30% extraction reduction scenario would slow subsidence by an estimated 35-42% but would not halt it entirely because clay compaction is partially irreversible and consolidation continues even after heads stabilise. Alternative water supplies-rainwater harvesting, treated wastewater reuse, and inter-basin transfers-would be needed to replace the reduced extraction volume [13] . A limitation of this research is that the forward projection uses linear extrapolation, which does not account for nonlinear compaction behaviour at very low effective stresses or for potential policy changes that could alter extraction rates [14] .
Conclusion
This research used nine years of Sentinel-1 InSAR data to map land subsidence across the Mexico City Basin at millimetre-scale precision. Subsidence rates ranged from 3.2 cm/yr in the western volcanic highlands to 39.2 cm/yr in the eastern lacustrine plain, with strong spatial correlation to clay-layer thickness (R² = 0.79) and groundwater-level decline. Validation against geodetic levelling yielded an RMSE of 2.5 cm/yr and r = 0.96. Forward projection at current rates predicts 2.4-3.1 m of additional subsidence by 2050 in the worst zones. The findings reinforce the need for aggressive extraction reduction and alternative water supply development to slow irreversible damage to Mexico City's infrastructure, drainage systems, and cultural heritage. .
Figures and tables from the paper
| Urban Zone | Mean Rate (cm/yr) | Max Rate (cm/yr) | Clay Thickness (m) | GW Decline (m/yr) |
|---|---|---|---|---|
| Historic Centre | 28.4 | 33.1 | 52 | 1.1 |
| Iztapalapa | 34.7 | 41.8 | 68 | 1.4 |
| Tláhuac | 31.2 | 38.6 | 61 | 1.3 |
| Xochimilco | 26.8 | 31.4 | 47 | 1.0 |
| G. A. Madero | 22.1 | 27.3 | 38 | 0.9 |
| Ecatepec | 18.9 | 24.2 | 31 | 0.7 |
| Western Highlands | 3.2 | 6.8 | 8 | 0.3 |
Table text extracted from the original PDF; superscript letters are shown inline. The original table image is below.
View original table image
| Metric | Value | Unit |
|---|---|---|
| Mean difference (InSAR − levelling) | 1.3 | cm/yr |
| Standard deviation of difference | 2.1 | cm/yr |
| RMSE | 2.5 | cm/yr |
| Correlation coefficient (r) | 0.96 | - |
| Number of monuments | 12 | - |
Table text extracted from the original PDF; superscript letters are shown inline. The original table image is below.
View original table image
References
20 in the original paper- Ortega-Guerrero A, Cherry JA, Rudolph DL. Largescale aquitard consolidation near Mexico City. Ground Water. 1993;31(5):708-718.
- Cabral-Cano E, Dixon TH, Miralles-Wilhelm F, DíazMolina O, Sánchez-Zamora O, Carande RE. Space geodetic imaging of rapid ground subsidence in Mexico City. Geological Society of America Bulletin. 2008;120(11-12):1556-1566.
- Ferretti A, Prati C, Rocca F. Permanent scatterers in SAR interferometry. IEEE Transactions on Geoscience and Remote Sensing. 2001;39(1):8-20.
- Torres R, Snoeij P, Geudtner D, Bibby D, Davidson M, Attema E. GMES Sentinel-1 mission. Remote Sensing of Environment. 2012;120:9-24.
- Chaussard E, Wdowinski S, Cabral-Cano E, Amelung F. Land subsidence in central Mexico detected by ALOS InSAR time series. Remote Sensing of Environment. 2014;140:94-106.
- Marsal RJ, Mazari M. The subsoil of Mexico City. Contribution to the First Pan-American Conference on Soil Mechanics and Foundation Engineering. 1959;1:197.
- Lesser JM, González-Posadas D. Hidrogeología de la cuenca de México. Boletín de la Sociedad Geológica Mexicana. 2005;57(1):23-42.
- Hooper A, Segall P, Zebker H. Persistent scatterer interferometric synthetic aperture radar for crustal deformation analysis, with application to Volcán Alcedo, Galápagos. Journal of Geophysical Research. 2007;112(B7):B07407.
- Gobierno de la Ciudad de México. Programa de gestión integral de riesgos. Secretaría de Gestión Integral de Riesgos y Protección Civil. 2021;1-187.
- Abidin HZ, Andreas H, Gumilar I, Fukuda Y, Pohan YE, Deguchi T. Land subsidence of Jakarta (Indonesia) and its relation with urban development. Natural Hazards. 2011;59(3):1753-1771.
- Teatini P, Tosi L, Strozzi T. Quantitative evidence that compaction of Holocene sediments drives the present land subsidence of the Po Delta, Italy. Journal of Geophysical Research. 2011;116(B8):B08407.
- Santoyo E, Ovando E, Mooser F, León E. Síntesis Geotécnica de la Cuenca del Valle de México. TGC Geotecnia. 2005;1-300.
- Tortajada C. Water management in Mexico City Metropolitan Area. International Journal of Water Resources Development. 2006;22(2):353-376.
- Galloway DL, Burbey TJ. Review: regional land subsidence accompanying groundwater extraction. Hydrogeology Journal. 2011;19(8):1459-1486.
- Poland JF, Davis GH. Land subsidence due to withdrawal of fluids. Reviews in Engineering Geology. 1969;2:187-269.
- Osmanoğlu B, Dixon TH, Wdowinski S, Cabral-Cano E, Jiang Y. Mexico City subsidence observed with persistent scatterer InSAR. International Journal of Applied Earth Observation and Geoinformation. 2011;13(1):1-12.
- Amelung F, Galloway DL, Bell JW, Zebker HA, Laczniak RJ. Sensing the ups and downs of Las Vegas: InSAR reveals structural control of land subsidence and aquifer-system deformation. Geology. 1999;27(6):483486.
- Herrera-García G, Ezquerro P, Tomás R, Béjar-Pizarro M, López-Vinielles J, Rossi M. Mapping the global threat of land subsidence. Science. 2021;371(6524):3436.
- Bouwer H. Artificial recharge of groundwater: hydrogeology and engineering. Hydrogeology Journal. 2002;10(1):121-142.
- Giordano M. Global groundwater? Issues and solutions. Annual Review of Environment and Resources. 2009;34:153-178.