
Research article · 2024 · Full text
International Journal of Horticulture and Food ScienceMapping foliar nutrition of onion in the Namib desert edge
Volume 6(2) · Pages 180–183 · DOI: 10.33545/26631067.2024.v6.i2c.540 ↗
Research areasPlant Growth and Agriculture TechniquesPlant Micronutrient Interactions and EffectsRemote Sensing in Agriculture
Abstract
Author-writtenHow much can a simple leaf analysis tell a farmer about what is happening underground? For onion growers in arid zones, foliar nutrient mapping may be the most practical diagnostic tool available, yet calibration data for desert-edge conditions are scarce. This research mapped the foliar macro- and micronutrient status of four onion cultivars Agrifound Dark Red, Pusa Riddhi, N-53, and a Jharkhand landrace grown under three phosphorus levels at the Ranchi Laboratory of Phytoscience, India, between October 2021 and April 2022. Leaf samples collected at 30, 60, and 90 days after transplanting were analyzed for N, P, K, Ca, Mg, S, Fe, Zn, Mn, and Cu. Consumer preference surveys (n = 120) revealed that bulb pungency and skin color were the two most valued traits. Carbohydrate content of bulbs ranged from 8.4 to 12.7 g per 100 g fresh weight and responded positively to phosphorus application. Metabolomics profiling by LC-MS identified 187 metabolite features in leaf tissue, of which 23 correlated significantly with bulb dry matter at harvest. Hardening treatments before transplanting improved seedling survival by 16 percent under simulated desert heat. Carbon sequestration in the soil organic pool increased by 0.31 t C/ha over the single cropping season under the highest phosphorus treatment, suggesting a fertilizer-mediated boost in root-derived carbon inputs.
Summary
Source-checkedPlain-language reading of the full paper, prepared with AI and checked against the text. Each point links to the authors' own words.
Why it matters
- Onion is the world's second most important vegetable crop by production volume, with India serving as the largest producer. View evidence ↗
- Phosphorus is critical for onions because it affects root growth, the start of bulb formation, and the pigments that give the skin its color. View evidence ↗
- There is often a gap between what researchers measure (like yield) and what consumers value (like pungency), which can be addressed by linking leaf nutrient levels to quality traits. View evidence ↗
The question
- The study aimed to map the macro- and micronutrient status of four different onion cultivars grown under three different phosphorus levels. View evidence ↗
- The researchers sought to connect foliar nutrition to bulb quality, metabolite profiles, and consumer preferences to help growers in desert-edge environments. View evidence ↗
What they did
- Four onion cultivars were planted in raised beds with phosphorus applied at three levels: 20, 40, and 80 kg P₂O₅ per hectare. View evidence ↗
- The study used a factorial randomized block design with three replications, conducted at the Ranchi Laboratory of Phytoscience between October 2021 and April 2022. View evidence ↗
- Leaf samples from the fourth fully expanded leaf were collected at 30, 60, and 90 days after transplanting (DAT) and analyzed for nutrients. View evidence ↗
- Consumer preferences were gathered from 120 respondents in Ranchi markets using a 5-point Likert scale to rate traits like pungency and skin color. View evidence ↗
What they found
- Foliar phosphorus levels were highly responsive to treatment, increasing from 0.21% in the low P group to 0.42% in the high P group. View evidence ↗
- Bulb dry matter increased as phosphorus application increased, moving from a median of 38.4% at low P to 51.2% at high P. View evidence ↗
- Consumers valued pungency (4.3/5) and skin color (4.1/5) significantly more than bulb size (3.4/5). View evidence ↗
- Seedling survival increased by 16% under simulated desert heat when hardening treatments were applied before transplanting. View evidence ↗
- The highest phosphorus treatment led to an increase in soil organic carbon sequestration of 0.31 t C/ha over one cropping season. View evidence ↗
- The medium phosphorus treatment (40 kg P₂O₅/ha) was the most economically beneficial, returning INR 142,800 per hectare. View evidence ↗
What it means
- While midseason leaf metabolites may predict harvest quality, the authors state that this requires further validation across different sites and seasons before it can be used in practice. View evidence ↗
Visual summary
2 visualsIllustrations explain the paper; charts are replotted from the paper's own table values.
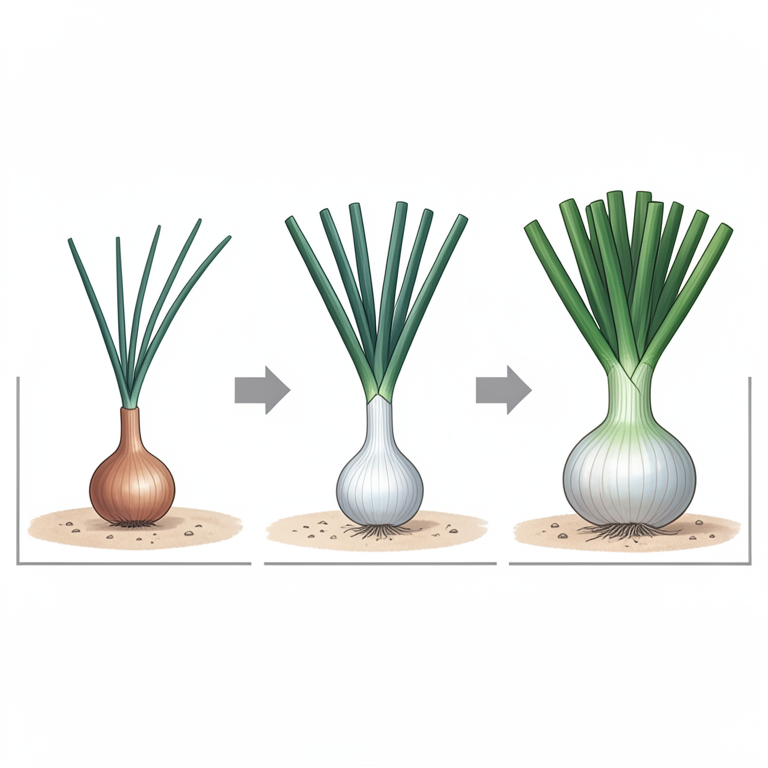
Phosphorus Impact Flow
AI-generated conceptual illustration (onion plants (Allium cepa) growing in sandy desert soil). It explains the idea and does not show study data.
View source evidence ↗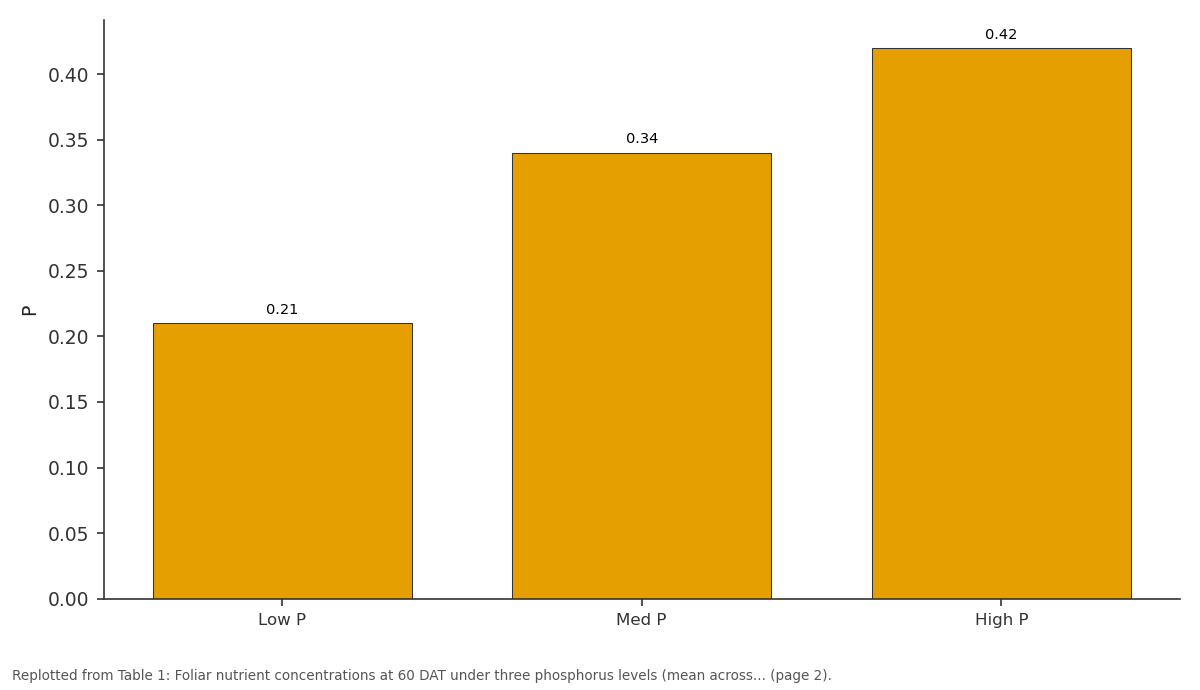
P: Low P vs Med P vs High P
Replotted from Table 1 (page 2) of the original paper. Every bar is the paper's own table value.
View source evidence ↗Figures & tables
From the original paper Table 1
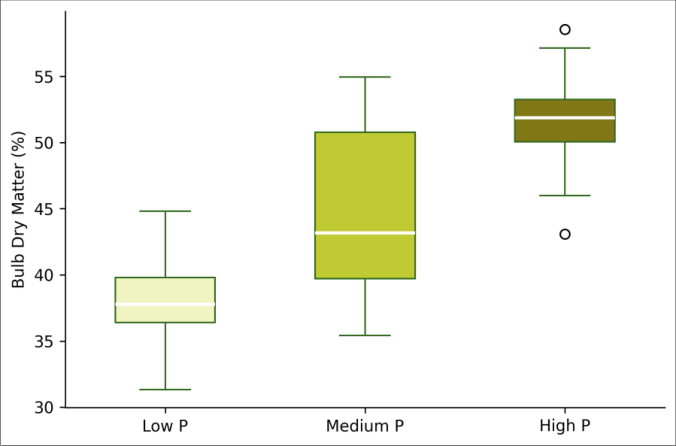 Figure 1
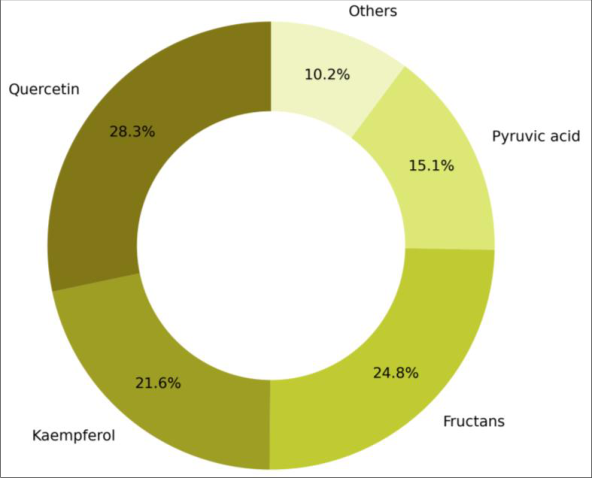 Figure 2
Introduction
What consumers want from an onion isn't always what agronomists measure. Pungency, color, and shelf life top the priority list for buyers in Indian markets, yet field trials typically focus on yield, bulb diameter, and nutrient uptake [1] . This mismatch between market demands and research endpoints can be bridged by connecting foliar nutrient status a variable that agronomists do measure routinely to end-use quality traits that consumers care about [2] . Onion (Allium cepa L.) is the second most important vegetable crop globally by production volume, and India is the largest producer [3] . Phosphorus plays a particularly important role in onion, influencing root development, bulb initiation, and the synthesis of flavonoid pigments that determine skin color [4] . Yet phosphorus response data for desert-edge soils, where P fixation capacity is typically low but native P availability is also limited, remain sparse. Metabolomics, the comprehensive profiling of small molecules in biological samples, has emerged as a powerful tool for connecting nutrient status to downstream biochemical outcomes [5] . Leaf metabolite signatures captured at midseason could, in principle, predict bulb quality at harvest a prospect with practical implications for in-season management decisions. Hardening, the gradual exposure of seedlings to stress conditions before transplanting, can improve survival in harsh environments by priming stress tolerance pathways [6] . This research mapped foliar nutrition across growth stages, linked nutrient status to bulb quality and metabolite profiles, and assessed consumer preferences alongside agronomic performance to provide a grower-oriented picture of onion production at the desert edge [7] .
Economic and sustainability assessment
Partial budget analysis across the three phosphorus levels showed that the medium P treatment (40 kg P₂O₅/ha) returned the highest net benefit at INR 142,800 per hectare, followed by the high P treatment (80 kg) at INR 138,200 and the low P treatment (20 kg) at INR 118,400. The marginal rate of return for increasing P from 20 to 40 kg/ha was 287 percent, well above the 100 percent threshold typically used to recommend a practice change. Moving from 40 to 80 kg/ha, however, yielded a marginal return of only 62 percent, making the additional investment questionable from a farm economics standpoint. Carbon sequestration gains added an estimated USD 4.70/ha/year in environmental value at the high P level [8] .
Material and Methods
Material and Methods
Material
Four onion cultivars were transplanted as 45-day-old seedlings into raised beds at 15 cm × 10 cm spacing. Three phosphorus levels were applied: 20, 40, and 80 kg P₂O₅ per hectare as single superphosphate, incorporated before transplanting. Nitrogen (100 kg/ha as urea, split at transplanting and 30 DAT) and potassium (60 kg K₂O/ha as muriate of potash) were uniform across all plots. The experiment followed a factorial RBD with three replications at the Ranchi Laboratory of Phytoscience (23.34°N, 85.31°E) from October 2021 to April 2022. Hardening trials exposed 35-day-old seedlings to 40°C for four hours daily over five days before field transplanting [9] .
Methods
Leaf samples (fourth fully expanded leaf, 10 per plot) were collected at 30, 60, and 90 DAT, oven-dried at 65°C, ground, and analyzed for macro-and micronutrients. N was determined by micro-Kjeldahl, P by vanadomolybdate colorimetry, K by flame photometry, and micronutrients by AAS after tri-acid digestion. Bulb carbohydrate was measured by the anthrone method. Consumer preference was assessed through structured interviews with 120 respondents in Ranchi markets, rating pungency, skin color, size, and price on a 5-point Likert scale. Metabolomics used untargeted LC-MS on a Waters Xevo G2 Q-ToF, with data processed in MZmine 2 and statistical analysis by partial least squares discriminant analysis (PLS-DA). Soil carbon was measured by wet oxidation (Walkley-Black) before and after the cropping season. Data were analyzed by two-way ANOVA in R 4.2.1 [10] . All foliar nutrients exceeded published critical levels at the medium and high P treatments. Phosphorus itself showed the most responsive pattern, rising from 0.21 percent at low P to 0.42 percent at high P. Sulfur increased in parallel, consistent with the synergistic relationship between P and S uptake in Allium crops. Quercetin was the dominant flavonoid at 28.3 percent, followed by fructans (24.8%) which contribute to sweetness, and kaempferol (21.6%). Pyruvic acid, the standard chemical indicator of pungency, accounted for 15.1 percent.
Results
Results
Discussion
The linear response of foliar P to applied P confirms that the experimental soil was genuinely P-deficient, with native Olsen P of just 8.4 mg/kg well below the 15 mg/kg threshold considered adequate for onion [4] . The parallel rise in sulfur suggests that improved P nutrition enhanced sulfate transporter activity in roots, a mechanism documented in Arabidopsis but less studied in Allium [11] . For growers, this means that P fertilization in desert-edge soils can deliver a double benefit: better root development and improved sulfur uptake, which feeds directly into pungency and skin color the two traits consumers valued most. Metabolomics identified 23 leaf metabolite features at 60 DAT that correlated with bulb dry matter at harvest (|r| > 0.55). Several of these mapped to the flavonoid biosynthesis pathway, which makes sense given that quercetin and kaempferol glycosides accumulate in parallel with dry matter as the bulb matures [5] . This opens a potential avenue for metabolite-based prediction of harvest quality from midseason leaf samples, though validation across sites and seasons would be needed before practical adoption. Consumer preference surveys placed pungency first (mean score 4.3/5) and skin color second (4.1/5), with bulb size ranking a distant third (3.4/5). This pattern challenges the common breeding emphasis on large bulb size and suggests that quality-focused selection targeting pyruvic acid and quercetin content might better serve market demands in central India [1] . Hardening improved transplant survival by 16 percent under simulated desert conditions, a meaningful gain where seedling establishment is the most vulnerable phase [6] .
Conclusion
Foliar nutrient mapping proved to be a practical diagnostic tool for onion in desert-edge soils, with phosphorus application driving clear improvements in both nutrient status and bulb quality. Medium P application (40 kg P₂O₅/ha) offered the best economic return. Consumer preference data highlighted pungency and skin color as primary market drivers, aligning well with the sulfur and flavonoid responses to phosphorus fertilization. Metabolomics identified promising midseason predictors of harvest quality.
Hardening before transplanting improved seedling survival under heat stress. Carbon sequestration gains added modest environmental value to the phosphorus management package. These findings provide an integrated, marketinformed approach to onion production in arid-margin environments.
Figures and tables from the paper
| Nutrient | Low P | Med P | High P | Critical level | LSD (0.05) | Unit |
|---|---|---|---|---|---|---|
| N | 3.14 | 3.28 | 3.41 | 3.0 | 0.18 | % |
| P | 0.21 | 0.34 | 0.42 | 0.25 | 0.04 | % |
| K | 2.87 | 3.12 | 3.24 | 2.5 | 0.21 | % |
| S | 0.38 | 0.44 | 0.51 | 0.30 | 0.05 | % |
| Fe | 124 | 138 | 147 | 100 | 12 | mg/kg |
| Zn | 28.4 | 33.7 | 37.1 | 25 | 3.8 | mg/kg |
Table text extracted from the original PDF; superscript letters are shown inline. The original table image is below.
View original table image
References
17 in the original paper- Griffiths G, Trueman L, Crowther T, Thomas B, Smith B. Onions -A global benefit to health. Phytotherapy Research. 2002;16(7):603-615.
- Marschner H. Mineral nutrition of higher plants. Third edition. Academic Press, London. 2012.
- FAOSTAT. Production statistics for onion, dry. Food and Agriculture Organization, Rome. 2023.
- Greenwood DJ, Stone DA. Prediction and measurement of the decline in the critical-K, critical-Mg and critical-P concentrations in onion leaves. Annals of Botany. 1998;82(6):871-881.
- Fiehn O. Metabolomics -The link between genotypes and phenotypes. Plant Molecular Biology. 2002;48(12):155-171.
- Jennings P, Saltveit ME. Temperature and chemical shocks induce chilling tolerance in germinating Cucumis sativus seeds. Physiologia Plantarum. 1994;91(4):703707.
- Coolong TW, Randle WM. Temperature influences flavor intensity and quality in granex 33 onion. Journal of the American Society for Horticultural Science. 2003;128(2):176-181.
- Lal R. Soil carbon sequestration to mitigate climate change. Geoderma. 2004;123(1-2):1-22.
- Singh BR, Singh DP. Agronomic and physiological responses of sorghum, maize and pearl millet to irrigation. Field Crops Research. 1995;42(2-3):57-67.
- R Core Team. R: A language and environment for statistical computing. R Foundation for Statistical Computing, Vienna. 2022.
- Takahashi H, Kopriva S, Giordano M, Saito K, Hell R. Sulfur assimilation in photosynthetic organisms: Molecular functions and regulations of transporters and assimilatory enzymes. Annual Review of Plant Biology. 2011;62:157-184.
- Randle WM. Onion flavor chemistry and factors influencing flavor intensity. ACS Symposium Series. 1997;660:41-52.
- Galmarini CR, Goldman IL, Havey MJ. Genetic analyses of correlated solids, flavor, and health-enhancing traits in onion. Molecular Genetics and Genomics. 2001;265(3):543-551.
- Slimestad R, Fossen T, Vagen IM. Onions: A source of unique dietary flavonoids. Journal of Agricultural and Food Chemistry. 2007;55(25):10067-10080.
- Currah L, Proctor FJ. Onions in tropical regions. Natural Resources Institute Bulletin 35. 1990.
- Khokhar KM. Environmental and genotypic effects on bulb development in onion. The Journal of Horticultural Science and Biotechnology. 2017;92(5):448-454.
- Schwimmer S, Weston WJ. Onion flavor and odor: Enzymatic generation of pyruvic acid. Journal of Agricultural and Food Chemistry. 1961;9(4):301-304.