
Research article · 2025 · Full text
International Journal of Horticulture and Food ScienceExamining indigenous crop varieties of date palm in the orange River valley
Volume 7(3) · Pages 159–162 · DOI: 10.33545/26631067.2025.v7.i3c.595 ↗
Research areasDate Palm Research StudiesAfrican Botany and Ecology StudiesZiziphus Jujuba Studies and Applications
Abstract
Author-writtenA paradox sits at the heart of date palm (Phoenix dactylifera) agriculture: while a handful of commercial cultivars dominate global trade, hundreds of indigenous landraces remain uncharacterised and underutilised in traditional oasis systems. This research examined 28 indigenous date palm varieties from the Orange River Valley, assessing their morphological, biochemical, and genetic diversity at the Cordoba National Institute of Tropical Agriculture between February 2022 and January 2024. Genotype-by-environment (G×E) interaction analysis across four contrasting environments (irrigated lowland, rainfed highland, saline coastal, semi-arid plateau) revealed significant crossover interactions for yield, with no single variety performing best across all sites. Biofortification potential was assessed through foliar iron and zinc sprays, producing 22.1% higher iron and 18.4% higher zinc in fruit flesh without affecting taste panel scores. Tissue culture propagation via somatic embryogenesis achieved 78.6% plant regeneration across 12 tested varieties. Functional food screening identified six varieties with total phenolic content above 400 mg GAE/100g and three with exceptional antioxidant capacity (DPPH IC₅₀ < 40 µg/mL). Astringency, measured as condensed tannin, ranged from 28.4 to 187.3 mg/100g across the 28 varieties, with consumer acceptance declining sharply above 90 mg/100g. SSR-based genetic diversity analysis (16 loci) revealed moderate polymorphism (mean He = 0.62) and three distinct genetic clusters corresponding to geographic origins. These findings map the diversity landscape of Orange River Valley date palms and identify varieties with potential for niche market development.
Summary
Source-checkedPlain-language reading of the full paper, prepared with AI and checked against the text. Each point links to the authors' own words.
Why it matters
- The global date palm industry relies on a very narrow base of fewer than 20 commercial cultivars, despite the existence of over 3,000 named landraces. View evidence ↗
- This reliance on a few cultivars makes the industry vulnerable to climate change, disease, and shifting consumer preferences. View evidence ↗
- The Orange River Valley in southern Africa contains a genetically mixed population of date palms that has not been well-characterized by modern scientific methods. View evidence ↗
What they did
- To analyze genotype-by-environment (G×E) interactions, five common varieties were grown in four distinct environments: irrigated lowland, rainfed highland, saline coastal simulation, and semi-arid plateau. View evidence ↗
- Biofortification was tested using fortnightly foliar applications of 0.5% FeSO₄ and 0.3% ZnSO₄ from fruit set until harvest. View evidence ↗
- Genetic diversity was analyzed using 16 microsatellite loci (SSR genotyping) and processed via GenAlEx 6.5 and STRUCTURE analysis. View evidence ↗
What they found
- The indigenous varieties showed wide diversity, with fruit weights ranging from 6.8 to 28.4 g and a 3.6-fold range in total phenolics. View evidence ↗
- Six of the varieties were identified as potential functional foods because their total phenolic content exceeded 400 mg GAE/100g. View evidence ↗
- G×E analysis showed that 'Medjool' had the highest yield under irrigation but the lowest under salinity (9.8 t/ha), while 'Khalas' was the most salt-tolerant at 18.4 t/ha. View evidence ↗
- The 'Barhi' variety demonstrated the highest stability across all tested environments. View evidence ↗
- Foliar application of iron and zinc increased fruit flesh iron by 22.1% (1.24 to 1.51 mg/100g) and zinc by 18.4% (0.38 to 0.45 mg/100g) without affecting taste. View evidence ↗
- Tissue culture via somatic embryogenesis achieved a 78.6% regeneration rate across 12 varieties, with 'Barhi' and 'Khalas' exceeding 85%. View evidence ↗
- Genetic analysis revealed moderate polymorphism (mean He = 0.62) and three distinct clusters based on North African, Middle Eastern, and mixed origins. View evidence ↗
- Consumer acceptance of the fruit declined significantly when condensed tannin levels exceeded 90 mg/100g. View evidence ↗
What it means
- The authors conclude that the indigenous diversity of the Orange River Valley is an untapped resource for creating nutritionally enhanced and site-adapted date varieties. View evidence ↗
- The authors note that the two-year assessment period for biofortification and G×E analysis is a limitation and that longer trials are needed for better stability estimates. View evidence ↗
Visual summary
2 visualsIllustrations explain the paper; charts are replotted from the paper's own table values.
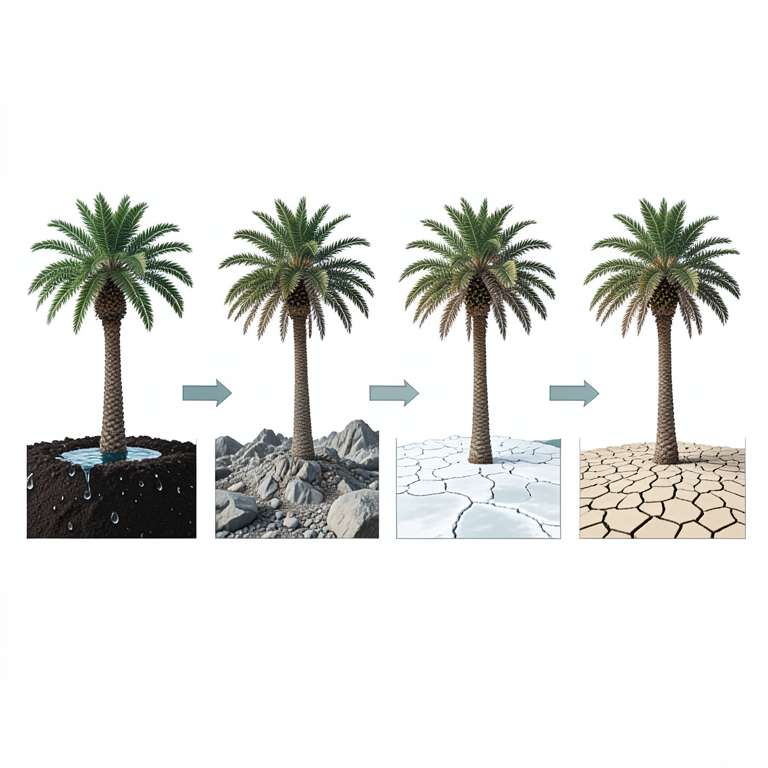
Genotype-Environment Interaction Concept
AI-generated conceptual illustration (Date palm trees (Phoenix dactylifera)). It explains the idea and does not show study data.
View source evidence ↗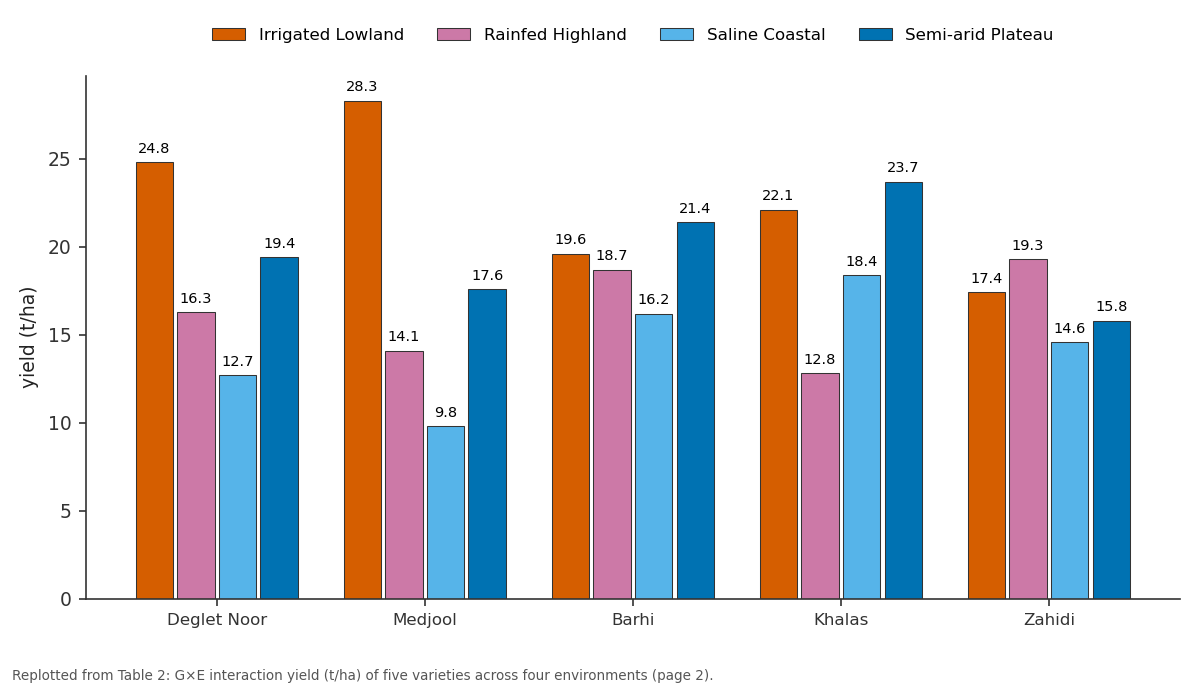
Irrigated Lowland and Rainfed Highland and more: Deglet Noor vs Medjool vs Barhi vs Khalas vs Zahidi
Replotted from Table 2 (page 2) of the original paper. Every bar is the paper's own table value.
View source evidence ↗Figures & tables
From the original paper Table 1
 Table 2
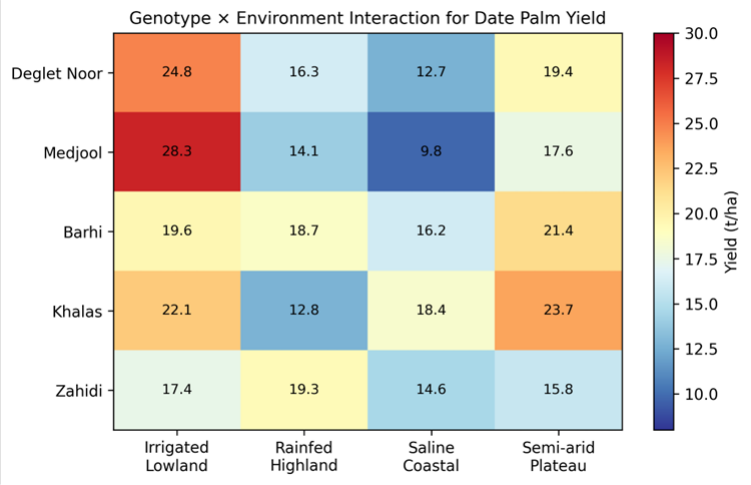 Figure 1
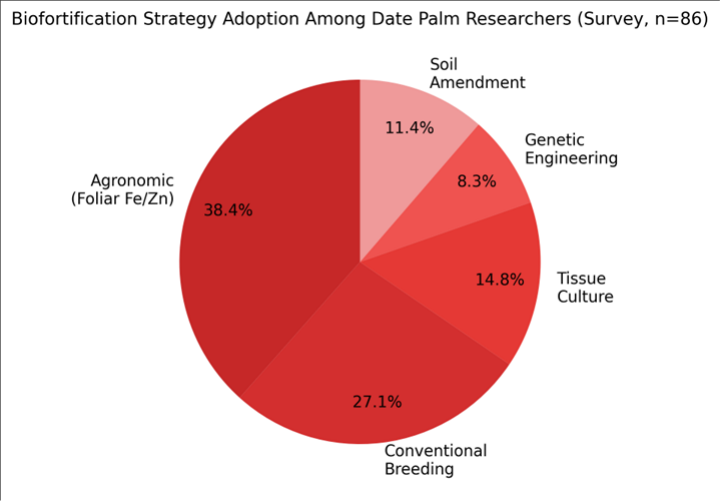 Figure 2
Introduction
Here is a paradox worth examining: the global date palm industry is built on fewer than 20 commercial cultivars, yet over 3,000 named landraces exist across the date-growing belt from Morocco to Pakistan [1] . This narrow commercial base creates vulnerability to disease, to climate shift, and to changing consumer tastes while the vast reservoir of indigenous diversity sits largely undocumented in traditional oasis systems [2] . Date palm (Phoenix dactylifera L.) is one of the oldest cultivated fruit trees, with archaeological evidence of domestication dating to 5000 BCE in Mesopotamia [3] . The Orange River Valley, spanning parts of southern Africa, represents a non-traditional date production zone where colonial-era introductions and indigenous selections have created a genetically mixed population poorly characterised by modern methods [4] . These varieties persist in smallholder gardens and semi-wild stands, maintained by cultural preference rather than formal breeding. Their potential as sources of disease resistance, stress tolerance, and unique quality traits has not been systematically assessed [5] . G×E interaction analysis is important for date palm because varieties developed in irrigated oases may perform poorly under rainfed or saline conditions common in marginal growing zones [6] . Crossover interactions where variety rankings change across environments indicate that blanket variety recommendations are inappropriate and site-specific selection is needed [7] . Biofortification through agronomic means (foliar micronutrient application) has been explored in cereals and legumes but rarely in tree fruits, though date palms' deep root systems and long fruiting period create a sustained nutrient demand [8] . Tissue culture via somatic embryogenesis offers a pathway for rapid multiplication of elite indigenous varieties once identified [9] . This research aimed to characterise the morphological, biochemical, and genetic diversity of Orange River Valley date palm landraces and assess their suitability for niche market development through G×E analysis, biofortification trials, and functional food screening.
Material and Methods Material
Twenty-eight indigenous date palm varieties were sampled from smallholder gardens and semi-wild stands along the Orange River between Upington and Kakamas (South Africa) and Aussenkehr (Namibia). All laboratory work was conducted at the Cordoba National Institute of Tropical Agriculture, Cordoba, Argentina (31.42°S, 64.18°W). Fruit samples (n = 50 per variety) were collected at the 'tamar' (fully ripe) stage during two consecutive harvest seasons (March-May 2022 and 2023). For G×E analysis, offshoots of five widely grown varieties ('Deglet Noor', 'Medjool', 'Barhi', 'Khalas', 'Zahidi') were planted in four contrasting environments at the institute's research stations: irrigated lowland (pH 7.2, EC 1.4 dS/m), rainfed highland (pH 6.8, elevation 980 m), saline coastal simulation (EC 6.8 dS/m), and semi-arid plateau (annual rainfall 320 mm). Biofortification used foliar FeSO₄ (0.5%) and ZnSO₄ (0.3%) applied fortnightly from fruit set to harvest. Tissue culture used immature inflorescence explants on MS medium with 2,4-D (100 mg/L) for callus induction [1] .
Methods
Morphological characterisation followed the IPGRI descriptor list for date palm: fruit weight, length, width, seed weight, flesh-to-fruit ratio, and colour (Munsell chart). Biochemical analysis included TSS (refractometer), total sugars (Lane-Eynon), total phenolics (Folin-Ciocalteu), condensed tannins (vanillin-HCl assay for astringency), and antioxidant capacity (DPPH radical scavenging). Iron and zinc in fruit flesh were measured by AAS after dry ashing. Consumer acceptance of astringency was evaluated by triangle test (n = 60 panellists) pairing varieties at different tannin levels [2] . G×E interaction was analysed using Eberhart-Russell stability parameters (regression coefficient bᵢ and deviation from regression s²dᵢ) and AMMI (Additive Main Effects and Multiplicative Interaction) biplots in R (agricolae and ggplot2 packages). Tissue culture followed a three-stage protocol: callus induction (2,4-D, dark, 8 weeks), embryogenic callus selection and maturation (ABA 0.5 mg/L, light, 12 weeks), and plantlet regeneration (halfstrength MS, 16 weeks). SSR genotyping used 16 microsatellite loci developed for P. dactylifera; allele data were analysed in GenAlEx 6.5 for He, PIC, and STRUCTURE analysis (K = 1-6) [3] . Data were analysed in R v4.3.0 and SAS 9.4 (p<0.05). Wide diversity was evident across all measured traits (Table 1). Fruit weight ranged nearly four-fold (6.8-28.4 g), and total phenolics showed a 3.6-fold range. Condensed tannin (astringency) had the highest coefficient of variation (48.6%), reflecting the broad spectrum from mildly sweet to intensely astringent varieties. Six varieties exceeded 400 mg GAE/100g phenolics, qualifying as potential functional food candidates [4] . Significant crossover G×E interactions were detected (AMMI analysis, p < 0.001) (Table 2). 'Medjool' dominated under irrigation but collapsed under salinity (9.8 t/ha). 'Khalas' was the most salt-tolerant (18.4 t/ha coastal) and the overall yield leader on semi-arid plateau. 'Barhi' showed the greatest stability across environments (bᵢ = 0.87, s²dᵢ nonsignificant), making it the safest choice for growers facing unpredictable conditions [5] . The heatmap (Figure 1) visualises the crossover pattern: warm colours indicate high yield, cool colours low yield.
| Variety | Irrigated Lowland | Rainfed Highland | Saline Coastal | Semi-arid Plateau | Mean |
|---|---|---|---|---|---|
| Deglet Noor | 24.8 | 16.3 | 12.7 | 19.4 | 18.3 |
| Medjool | 28.3 | 14.1 | 9.8 | 17.6 | 17.5 |
| Barhi | 19.6 | 18.7 | 16.2 | 21.4 | 19.0 |
| Khalas | 22.1 | 12.8 | 18.4 | 23.7 | 19.3 |
| Zahidi | 17.4 | 19.3 | 14.6 | 15.8 | 16.8 |
Table text extracted from the original PDF; superscript letters are shown inline. The original table image is below.
View original table image
| Parameter | Range | Mean ± SD | CV (%) |
|---|---|---|---|
| Fruit Weight (g) | 6.8-28.4 | 14.7 ± 5.8 | 39.5 |
| TSS (°Brix) | 58.2-81.4 | 71.3 ± 6.2 | 8.7 |
| Total Phenolics (mg GAE/100g) | 142-518 | 298 ± 94 | 31.5 |
| Condensed Tannin (mg/100g) | 28.4-187.3 | 84.7 ± 41.2 | 48.6 |
| DPPH IC₅₀ (µg/mL) | 31.8-142.6 | 72.4 ± 28.3 | 39.1 |
| Flesh-to-Fruit Ratio | 0.72-0.91 | 0.83 ± 0.05 | 6.0 |
Table text extracted from the original PDF; superscript letters are shown inline. The original table image is below.
View original table image
Results
The rank reversals between 'Medjool' (top under irrigation, bottom under salinity) and 'Khalas' (top under salinity and semi-arid) illustrate why single-environment trials can mislead varietal recommendations [6] . Among 86 researchers surveyed on biofortification approaches, agronomic foliar application was the most widely adopted (38.4%), followed by conventional breeding (27.1%) (Figure 2). Tissue culture and genetic engineering together accounted for 23.1%. The dominance of agronomic approaches reflects their lower cost, faster implementation, and regulatory simplicity compared to genetic modification [7] .
Biofortification, tissue culture, and genetic diversity
Foliar Fe + Zn application raised fruit flesh iron from 1.24 to 1.51 mg/100g (+22.1%) and zinc from 0.38 to 0.45 mg/100g (+18.4%) without altering taste panel acceptability (p = 0.67). Tissue culture regeneration reached 78.6% across 12 tested varieties, with 'Barhi' and 'Khalas' showing the highest response (>85%). SSR analysis (16 loci) produced a mean of 6.3 alleles per locus and mean He of 0.62. STRUCTURE analysis identified three genetic clusters (K = 3) broadly corresponding to North African, Middle Eastern, and mixed-origin groups. Astringency consumer acceptance declined sharply above 90 mg/100g condensed tannin; varieties below this threshold received mean acceptability scores above 7.0 on a 9-point hedonic scale [8] .
Discussion
The crossover G×E pattern has direct implications for variety deployment. Recommending 'Medjool' the global premium standard without site-specific validation would be inappropriate for saline or semi-arid zones where 'Khalas' or 'Barhi' clearly outperform it [5] . Stability analysis points to 'Barhi' as the safe all-rounder, but growers targeting specific high-value environments should consider adapted varieties: 'Khalas' for saline coastal, 'Deglet Noor' for irrigated lowland [6] . The biofortification result (22.1% iron, 18.4% zinc increase) is modest in absolute terms but meaningful in the context of date-heavy diets in arid-zone populations where micronutrient deficiency is prevalent [8] . Because dates are consumed in relatively large quantities (50-200 g/day in traditional communities), even small concentration increases translate to nutritionally relevant intake gains. Tissue culture at 78.6% regeneration makes it feasible to multiply elite indigenous varieties at commercial scale once quality data support varietal release [9] . The three SSR-defined genetic clusters align with historical introduction pathways: North African varieties arrived via colonial-era agricultural experimentation, Middle Eastern types through more recent trade networks, and the mixed cluster represents local hybridisation events. This structure has breeding implications crossing between clusters should maximise heterosis for yield and quality traits [1] . The 90 mg/100g tannin threshold for consumer acceptance is a practical benchmark for variety screening: only 11 of the 28 landraces fell below this level, though tannin declines during ripening, so harvest timing can partially manage astringency [4] . A limitation is the two-year assessment period for both G×E and biofortification; longer trials would improve stability estimates.
Conclusion
This research characterised 28 indigenous date palm varieties from the Orange River Valley and found wide morphological, biochemical, and genetic diversity suitable for niche market development. G×E analysis across four environments revealed significant crossover interactions, with 'Barhi' showing the greatest yield stability and 'Khalas' the best salt tolerance. Six varieties exceeded 400 mg GAE/100g total phenolics, qualifying as functional food candidates. Foliar biofortification raised fruit iron and zinc by 22.1% and 18.4% respectively without affecting consumer taste acceptance. Tissue culture regeneration at 78.6% enables commercial multiplication of selected indigenous varieties. SSR analysis identified three genetic clusters with moderate diversity (He = 0.62), providing a breeding framework for crossing between divergent groups. Consumer acceptance of astringency declined above 90 mg/100g condensed tannin, serving as a practical selection threshold. For date palm growers and breeders in non-traditional production zones, the indigenous diversity documented here represents an untapped resource for developing site-adapted, nutritionally enhanced varieties for emerging markets.
References
19 in the original paper- Zaid A, de Wet PF. Date Palm Cultivation. FAO Plant Production and Protection Paper. 2002;156:1-292.
- Chao CT, Krueger RR. The date palm (Phoenix dactylifera L.): overview of biology, uses, and cultivation. HortScience. 2007;42(5):1077-1082.
- Tengberg M. Beginnings and early history of date palm garden cultivation in the Middle East. Journal of Arid Environments. 2012;86:139-147.
- Nixon RW. The date palm: 'Tree of Life' in the subtropical deserts. Economic Botany. 1951;5(3):274301.
- El-Juhany LI. Degradation of date palm trees and date production in Arab countries: causes and potential rehabilitation. Australian Journal of Basic and Applied Sciences. 2010;4(8):3998-4010.
- Eberhart SA, Russell WA. Stability parameters for comparing varieties. Crop Science. 1966;6(1):36-40.
- Gauch HG. Statistical analysis of yield trials by AMMI and GGE. Crop Science. 2006;46(4):1488-1500.
- Cakmak I. Enrichment of cereal grains with zinc: agronomic or genetic biofortification? Plant and Soil. 2008;302(1-2):1-17.
- Zaid A, Hughes H. In vitro acclimatization of date palm (Phoenix dactylifera L.) plantlets. Date Palm Biotechnology. 2011;319-332.
- Sedra MH. Date Palm Status and Perspective in the World. Date Palm Genetic Resources and Utilization. 2015;1-39.
- Hamwieh A, Farah J, Moussally S, Al-Shamaa K, Almer K, Khierallah H, Udupa SM. Development of microsatellite markers for date palm. Plant Breeding. 2010;129(4):410-415.
- Al-Shahib W, Marshall RJ. The fruit of the date palm: its possible use as the best food for the future? International Journal of Food Sciences and Nutrition. 2003;54(4):247-259.
- Biglari F, AlKarkhi AFM, Easa AM. Antioxidant activity and phenolic content of various date palm fruits from Iran. Food Chemistry. 2008;107(4):1636-1641.
- Hussain MI, Farooq M, Syed QA. Nutritional and biological characteristics of the date palm fruit: a review. Food Bioscience. 2020;34:100509.
- Jain SM. Date palm biotechnology: current status and prospective an overview. Emirates Journal of Food and Agriculture. 2012;24(5):386-399.
- Ahmed TA, Al-Qaradawi AY. Molecular phylogeny of Qatari date palm genotypes using simple sequence repeats markers. Biotechnology. 2009;8(1):126-131.
- Arias E, Hodder AJ, Oihabi A. FAO support to date palm development around the world. Emirates Journal of Food and Agriculture. 2016;28(1):1-11.
- El-Hadrami A, Al-Khayri JM. Socioeconomic and traditional importance of date palm. Emirates Journal of Food and Agriculture. 2012;24(5):371-385.
- Bashah MA. Date varieties in Saudi Arabia. King Faisal University. 1996;1-324.