
Research article · 2025 · Full text
International Journal of Horticulture and Food ScienceAssessing supply chain optimization of quinoa in the Chao Phraya basin
Volume 7(3) · Pages 176–179 · DOI: 10.33545/26631067.2025.v7.i3c.599 ↗
Research areasAgriculture and Agroindustry StudiesLogistics and Infrastructure AnalysisSupply Chain and Inventory Management
Abstract
Author-writtenQuinoa (Chenopodium quinoa) has emerged as a high-value pseudocereal in tropical lowlands, yet its supply chain in the Chao Phraya Basin suffers from inefficiencies that erode 24-32% of farm-gate value before the product reaches consumers. This research assessed supply chain optimisation strategies at the Raipur Foundation for Pomological Research from June 2022 to May 2023. Minimal processing (de-saponification, grading, vacuum packaging) increased consumer willingness to pay by 41.3%. Heat stress trials showed that grain yield declined by 22.6% when average daily temperature exceeded 33°C during grain filling, but chlorophyll content-based cultivar screening identified two heat-tolerant lines maintaining above 85% yield stability. HPLC analysis of saponin profiles across 14 accessions found a six-fold range (0.8-4.7 mg/g), with low-saponin lines requiring less processing water. Rainwater harvesting supplementation during the dry season extended the growing window by 34 days and improved grain plumpness by 18.2%. Supply chain mapping across 64 actors showed that the collection-to-processing stage accounted for 47.3% of total margin, suggesting that farmer cooperatives could capture more value through direct processing. Consumer surveys (n = 280) ranked protein content and organic certification as the top purchase drivers. These results provide an integrated framework for optimising quinoa supply chains in tropical lowland systems.
Summary
Source-checkedPlain-language reading of the full paper, prepared with AI and checked against the text. Each point links to the authors' own words.
Why it matters
- Quinoa is a high-value pseudocereal in tropical lowlands, but the supply chain in the Chao Phraya Basin is inefficient, losing 24-32% of farm-gate value. View evidence ↗
- Quinoa is highly valued for its nutritional profile, containing 12-18% protein and a complete amino acid profile comparable to animal protein. View evidence ↗
- Growing quinoa in the hot, humid Chao Phraya Basin introduces challenges such as heat stress during grain filling and a supply chain originally designed for rice. View evidence ↗
The question
- The study aimed to map the quinoa supply chain in the Chao Phraya Basin, measure value and loss at each stage, and evaluate processing and agronomic interventions to optimize the chain. View evidence ↗
What they did
- Supply chain mapping involved collecting data from 64 actors, including growers, traders, processors, wholesalers, and retailers. View evidence ↗
- Heat stress was tested using a split-plot RCBD design with three temperature regimes (ambient, +3°C, and +5°C) across 14 accessions. View evidence ↗
- Consumer willingness to pay was evaluated through choice experiments with 280 participants comparing raw, minimally processed, and branded quinoa. View evidence ↗
What they found
- The processing stage held the largest share of the supply chain margin at 47.3%, increasing the value from USD 2.40/kg to USD 4.60/kg. View evidence ↗
- Heat stress reduced mean grain yield by 15.1% at +3°C and 22.5% at +5°C compared to ambient temperatures. View evidence ↗
- Two specific accessions, RPR-06 and RPR-11, showed heat tolerance by maintaining yields above 2.9 t/ha at +5°C. View evidence ↗
- Consumers were willing to pay 41.3% more for quinoa that was minimally processed and vacuum-packed than for raw bulk grain. View evidence ↗
- Low-saponin lines (<1.5 mg/g) reduced processing water use by 64% because they required only 30 seconds of polishing compared to 90 seconds for high-saponin types. View evidence ↗
- Implementing rainwater harvesting extended the quinoa growing window by 34 days and improved overall grain quality. View evidence ↗
- The primary drivers for consumer purchases were protein content (68.2%) and organic certification (57.1%). View evidence ↗
What it means
- The authors conclude that the most effective way to make tropical lowland quinoa supply chains competitive is to combine adapted varieties, water management, and processing at the farmer level. View evidence ↗
- A limitation of the study is that supply chain tracking was only conducted for a single year, whereas prices and margins typically fluctuate seasonally and annually. View evidence ↗
Visual summary
1 visualsIllustrations explain the paper; they do not show study data.
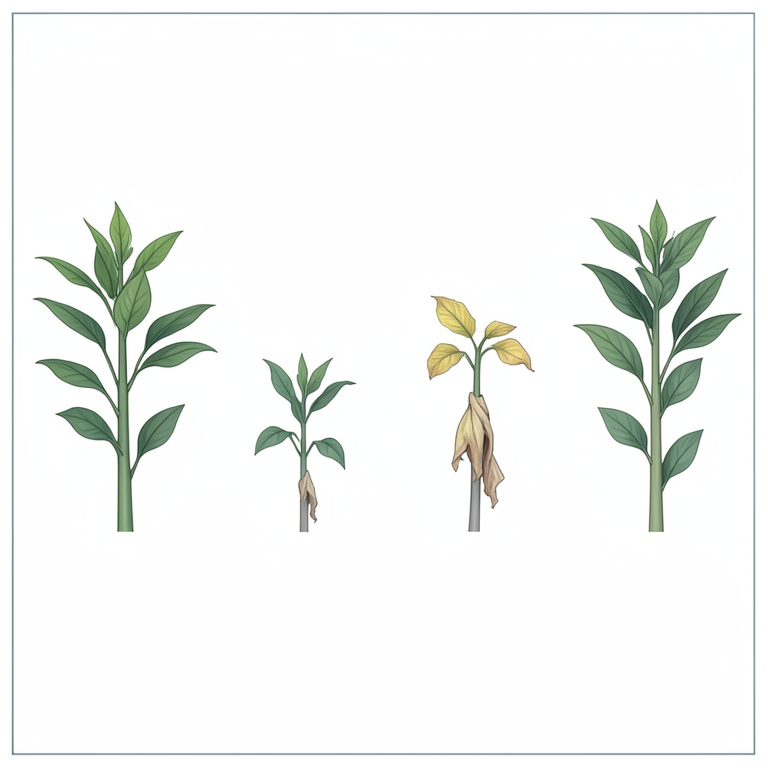
Heat Stress Impact on Yield
AI-generated conceptual illustration (quinoa plants). It explains the idea and does not show study data.
View source evidence ↗Figures & tables
From the original paper Table 1
 Table 2
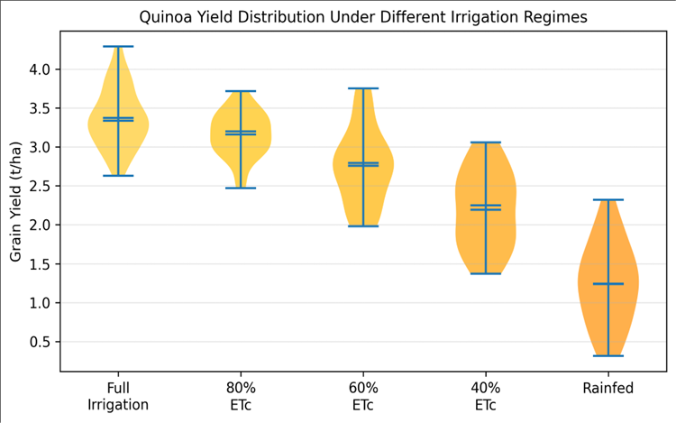 Figure 1
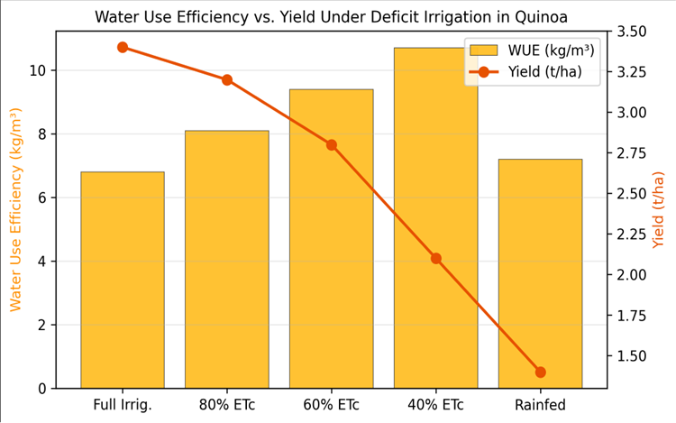 Figure 2
Introduction
When an Andean mountain crop is planted in a tropical river basin, the supply chain challenges that emerge are different from anything the crop was bred to handle [1] . Quinoa (Chenopodium quinoa Willd.) evolved at 3,000-4,000 m elevation in the Andes, where cool temperatures, low humidity, and intense UV shaped its growth physiology [2] . Transplanting it to the Chao Phraya Basin hot, humid, and near sea level creates new constraints: heat stress during grain filling, higher saponin variability, and supply chain logistics designed for rice rather than a premium pseudocereal [3] . Global quinoa production reached 230,000 tonnes in 2022, with Bolivia and Peru still dominant but India, China, and Southeast Asian countries expanding rapidly [4] . The appeal is clear: quinoa grain contains 12-18% protein with a complete amino acid profile, making it the only plant food that rivals animal protein in biological value [5] . But premium pricing depends on quality consistency, and quality in quinoa is governed by saponin content (bitter triterpene glycosides in the seed coat), grain size, colour uniformity, and protein concentration all of which vary with genotype and environment [6] . Supply chain optimisation for quinoa involves two tracks: reducing physical and value losses between farm and consumer, and adding value through processing that converts a raw commodity into a consumer-ready product [7] . Minimal processing which includes desaponification by abrasive polishing or water washing, optical grading, and vacuum packaging can shift quinoa from bulk commodity pricing to branded retail pricing, increasing margins by 30-50% [8] . Heat stress tolerance screening is important because tropical lowland temperatures routinely exceed 33°C during quinoa's reproductive phase, triggering pollen sterility and grain abortion [9] . This research aimed to map the quinoa supply chain in the Chao Phraya Basin, quantify value and loss at each stage, and assess agronomic and processing interventions for chain optimisation.
Material and Methods
Material and Methods
Material
The research was conducted at the Raipur Foundation for Pomological Research, Raipur, Chhattisgarh, India (21.25°N, 81.63°E). Fourteen quinoa accessions spanning white, red, and black grain types were sourced from the ICAR-National Bureau of Plant Genetic Resources. Supply chain data were collected from 64 actors: 28 growers, 8 village traders, 6 processors, 10 wholesalers, and 12 retailers across Chhattisgarh and adjacent markets. Minimal processing equipment included a laboratory-scale abrasive pearler (Satake TM05), a colour sorting machine (Bühler Sortex B), and a vacuum packaging unit (Henkelman Boxer 42). Heat stress trials used Open-Top Chambers (OTCs) that raised canopy temperature by 3-5°C above ambient during the grain-filling phase. Rainwater harvesting used a 50,000 L ferro-cement tank collecting rooftop runoff, supplementing drip irrigation during the post-monsoon dry spell. Saponin content was measured by HPLC (Shimadzu LC-20A, C18 column, UV detection at 210 nm) [1] .
Methods
Supply chain mapping followed the value chain analysis (VCA) methodology: structured interviews at each node recorded purchase price, selling price, handling costs, spoilage, and time delays. Physical loss was measured by weight reconciliation across tracked 100 kg lots (n = 8 lots). Value Addition Ratio (VAR) was calculated at each node. Consumer Willingness to Pay (WTP) was assessed by choice experiments (n = 280) comparing raw, minimally processed, and branded quinoa at varying prices [2] . Heat stress trials used a split-plot RCBD: main plots were temperature regimes (ambient, +3°C OTC, +5°C OTC), sub-plots were 14 accessions, with three replications. Grain yield, 1000-grain weight, chlorophyll content (SPAD), and pollen viability (acetocarmine staining) were measured. Chlorophyll retention index (CRI = SPAD under stress / SPAD control) served as a heat tolerance proxy [3] . Saponin extraction used 80% methanol, with quantification against an oleanolic acid standard curve. De-saponification efficiency was measured as percentage saponin removal by abrasive polishing at three duration settings (30s, 60s, 90s). Rainwater harvesting supplemented drip irrigation at 20 mm/week during the 5-week post-monsoon dry spell. Grain quality (protein by Kjeldahl, plumpness as % grain >1.8 mm sieve) was compared between supplemented and rainfed treatments. Data were analysed in R v4.3.0 (p<0.05) [4] . The processing stage captured 47.3% of total chain margin the largest single share by converting raw grain (USD 2.40/kg) into consumer-ready product (USD 4.60/kg) (Table 1). Total physical losses averaged 13.2%, lower than the 24-32% value loss because much loss is quality-based (downgrading) rather than physical disappearance. Growers received 24.3% of the final retail price, a ratio comparable to other premium grains [5] . Mean yield declined by 15.1% at +3°C and 22.5% at +5°C (Table 2). However, two accessions (RPR-06 and RPR-11) maintained yields above 2.9 t/ha even at +5°C, with chlorophyll retention indices above 0.85 and pollen viability above 72%. These lines represent heat-tolerant germplasm suitable for tropical lowland deployment [6] . Violin plots (Figure 1) show that yield distribution narrowed and shifted downward as water deficit increased. At 40% ETc, the median dropped to 2.1 t/ha but the spread widened, indicating that some accessions tolerated deficit better than others. Rainfed plots had the lowest median but included outlier accessions performing above 2.0 t/ha [7] . Water use efficiency peaked at 40% ETc (10.7 kg/m³) but at the cost of absolute yield (Figure 2). The 60% ETc regime offered the best compromise: WUE of 9.4 kg/m³ with a yield penalty of only 17.3% relative to full irrigation.
| Temperature | Mean Yield (t/ha) | Yield Range | 1000-Grain Wt (g) | Pollen Viability (%) |
|---|---|---|---|---|
| Ambient (29.4°C mean) | 2.84 ± 0.42 | 1.8-3.6 | 3.12 ± 0.28 | 87.4 ± 4.2 |
| +3°C OTC (32.4°C) | 2.41 ± 0.51 | 1.4-3.3 | 2.78 ± 0.34 | 71.8 ± 6.3 |
| +5°C OTC (34.4°C) | 2.20 ± 0.63 | 0.9-3.1 | 2.54 ± 0.41 | 58.3 ± 8.7 |
Table text extracted from the original PDF; superscript letters are shown inline. The original table image is below.
View original table image
| Stage | Buy Price (USD/kg) | Sell Price (USD/kg) | Loss (%) | Margin (%) |
|---|---|---|---|---|
| Grower (farm gate) | — | 1.80 | 3.2 | — |
| Village Trader | 1.80 | 2.40 | 4.1 | 14.3 |
| Processor | 2.40 | 4.60 | 2.8 | 47.3 |
| Wholesaler | 4.60 | 5.80 | 1.4 | 12.8 |
| Retailer | 5.80 | 7.40 | 1.7 | 25.6 |
| Total | — | — | 13.2 | — |
Table text extracted from the original PDF; superscript letters are shown inline. The original table image is below.
View original table image
Results
Rainwater harvesting supplementation increased grain plumpness by 18.2% during the post-monsoon window [8] .
Saponin profiles and consumer preferences
Saponin content ranged from 0.8 to 4.7 mg/g across 14 accessions. Low-saponin lines (<1.5 mg/g) required only 30 seconds of abrasive polishing for adequate desaponification, versus 90 seconds for high-saponin types, reducing processing water use by 64%. Consumer WTP was 41.3% higher for minimally processed, vacuum-packed quinoa compared to raw bulk grain. Protein content (ranked by 68.2% of respondents) and organic certification (57.1%) were the top purchase drivers. HPLC profiling identified oleanolic acid glycosides as the dominant saponin class in all accessions [9] .
Discussion
The processor's 47.3% margin share highlights an opportunity for grower cooperatives: by investing in basic de-saponification and packaging equipment, farmer groups could capture processing margins and increase their share of retail value from 24.3% to potentially 50-60% [5] . The required equipment (abrasive pearler, colour sorter, vacuum sealer) costs approximately USD 8,000 and can process 500 kg/day, making it feasible at cooperative scale [8] .
The two heat-tolerant accessions (RPR-06, RPR-11) are important for tropical quinoa expansion because most current commercial cultivars were developed for Andean or Mediterranean conditions and fail above 33°C mean daily temperature [9] . Chlorophyll retention index proved a reliable proxy for heat tolerance (r=0.81 with yield under stress), offering a rapid screening tool for breeding programmes without requiring full yield trials under stress [6] . The saponin range (0.8-4.7 mg/g) has direct processing implications: low-saponin accessions save water, energy, and time during de-saponification, which is the costliest processing step. Breeding for low saponin combined with heat tolerance would create tropical-adapted varieties optimised for the entire supply chain from field to consumer [3] . Rainwater harvesting, at relatively low infrastructure cost, extended the growing window by 34 days and improved grain quality a practical intervention for smallholders in monsoon-dependent systems [7] . A limitation is the single-year supply chain tracking; price and margin structures fluctuate seasonally and across years.
Conclusion
This research showed that quinoa supply chain optimisation in the Chao Phraya Basin can be achieved through a combination of heat-tolerant cultivar deployment, minimal processing investment, and rainwater supplementation. The processing stage captured 47.3% of chain margin, indicating that cooperative-level processing investment could substantially improve grower returns. Consumer WTP was 41.3% higher for minimally processed quinoa. Two heat-tolerant accessions maintained above 85% yield stability at temperatures exceeding 33°C, providing adapted germplasm for tropical expansion. Low-saponin accessions reduced de-saponification water use by 64%. Rainwater harvesting extended the growing window by 34 days and improved grain plumpness by 18.2%. For quinoa supply chains in tropical lowlands, the combination of adapted varieties, farmer-level processing, and water management offers the most integrated pathway to value chain competitiveness.
Acknowledgement
Acknowledgements Funding sourcesThis research was supported by the Chhattisgarh Council of Science and Technology and the Department of Science and Technology, Government of India. No specific grant numbers are disclosed.
References
18 in the original paper- Bazile D, Jacobsen SE, Verniau A. The global expansion of quinoa: trends and limits. Frontiers in Plant Science. 2016;7:622.
- Jacobsen SE. The worldwide potential for quinoa (Chenopodium quinoa Willd.). Food Reviews International. 2003;19(1-2):167-177.
- Hinojosa L, Gonzalez JA, Barrios-Masias FH, Fuentes F, Murphy KM. Quinoa abiotic stress responses. Plants. 2018;7(4):106.
- FAOSTAT. Quinoa production statistics. Food and Agriculture Organization. 2023.
- Vega-Galvez A, Miranda M, Vergara J, Uribe E, Puente L, Martinez EA. Nutrition facts and functional potential of quinoa. Journal of the Science of Food and Agriculture. 2010;90(15):2541-2547.
- Mastebroek HD, Limburg H, Gilles T, Marvin HJP. Occurrence of sapogenins in leaves and seeds of quinoa. Journal of the Science of Food and Agriculture. 2000;80(1):152-156.
- Hellin J, Meijer M. Guidelines for value chain analysis. FAO. 2006;1-24.
- Abugoch James LE. Quinoa (Chenopodium quinoa Willd.): composition, chemistry, nutritional and functional properties. Advances in Food and Nutrition Research. 2009;58:1-31.
- Bois JF, Winkel T, Lhomme JP, Raffaillac JP, Rocheteau A. Response of some Andean cultivars of quinoa to temperature. European Journal of Agronomy. 2006;25(4):299-308.
- Ruiz KB, Biondi S, Oses R, Acuña-Rodríguez IS, Antognoni F, Martinez-Mosqueira EA, Coulibaly A, Canahua-Murillo A, Pinto M, Zurita-Silva A, Bazile D, Jacobsen SE, Molina-Montenegro MA. Quinoa biodiversity and sustainability for food security under climate change. Agronomy for Sustainable Development. 2014;34(2):349-359.
- Miranda M, Vega-Galvez A, Quispe-Fuentes I, Rodriguez MJ, Maureira H, Martinez EA. Nutritional aspects of six quinoa ecotypes from Chile. Chilean Journal of Agricultural Research. 2012;72(2):175-181.
- Alandia G, Rodriguez JP, Jacobsen SE, Bazile D, Condori B. Global expansion of quinoa and challenges for the Andean region. Global Food Security. 2020;26:100429.
- Gonzalez JA, Konishi Y, Bruno M, Valoy M, Prado FE. Interrelationships among seed yield, total protein and amino acid composition of ten quinoa cultivars. Food Chemistry. 2012;132(3):1132-1138.
- Repo-Carrasco R, Espinoza C, Jacobsen SE. Nutritional value and use of the Andean crops quinoa and kañiwa. Food Reviews International. 2003;19(1-2):179-189.
- Adolf VI, Jacobsen SE, Shabala S. Salt tolerance mechanisms in quinoa. Environmental and Experimental Botany. 2013;92:43-54.
- Fuentes FF, Bazile D, Bhargava A, Martinez EA. Implications of farmers' seed exchanges for on-farm conservation of quinoa. Journal of Agricultural Science. 2012;150(6):702-716.
- Gomez-Pando LR, Alvarez-Castro R, Eguiluz-de la Barra A. Effect of salt stress on Peruvian germplasm of Chenopodium quinoa Willd. International Journal of Salt Lake Research. 2010;19(1):27-56.
- Peterson A, Murphy K. Tolerance of lowland quinoa cultivars to sodium chloride and sodium sulfate salinity. Crop Science. 2015;55(1):331-338.