
Research article · 2025 · Full text
International Journal of Horticulture and Food ScienceInvestigating marker-assisted selection of watermelon in the Danube basin
Volume 7(2) · Pages 166–169 · DOI: 10.33545/26631067.2025.v7.i2c.577 ↗
Research areasAdvances in Cucurbitaceae ResearchGenetic Mapping and Diversity in Plants and AnimalsGenetic and phenotypic traits in livestock
Abstract
Author-writtenWatermelon (Citrullus lanatus) breeding has traditionally relied on phenotypic selection, a process that is slow for traits like sugar content and disease resistance because these characters are strongly influenced by environment and require destructive testing. Marker-Assisted Selection (MAS) promises to accelerate genetic gain by allowing breeders to screen for favourable alleles at the seedling stage. This research compared the efficiency of MAS against conventional phenotypic selection for improving fruit sugar content, yield, and Fusarium wilt resistance in watermelon over four backcross and two selfing generations at the Guadalajara Department of Agronomic Sciences, Mexico, from January 2020 to December 2023. Three SSR markers linked to quantitative trait loci for sugar content (MCPI-12) and Fusarium resistance (WMFR-3, WMFR-7) were used for foreground selection. MAS lines reached 11.2 degrees Brix by the F5 generation, compared to 9.6 degrees Brix for conventional lines, a 16.7% advantage. Fusarium wilt incidence in MAS lines was 8.4% versus 24.1% in conventional lines under inoculated field conditions. Fruit yield did not differ significantly between approaches. Selection efficiency, measured as genetic gain per cycle, was 2.3 times higher for MAS than for conventional selection for sugar content. These findings validate the use of SSR-based MAS as a practical tool for accelerating watermelon improvement.
Summary
Source-checkedPlain-language reading of the full paper, prepared with AI and checked against the text. Each point links to the authors' own words.
Why it matters
- Traditional watermelon breeding using phenotypic selection is slow for disease resistance and sugar content because these traits are heavily affected by the environment and require destructive testing. View evidence ↗
- Sugar content, measured in degrees Brix, is considered the most critical quality trait for consumers of watermelon. View evidence ↗
- Fusarium wilt, caused by the pathogen Fusarium oxysporum f. sp. niveum, is the most destructive soil-borne disease affecting watermelons globally. View evidence ↗
The question
- The study aimed to compare the efficiency of Marker-Assisted Selection (MAS) versus conventional phenotypic selection for improving yield, Fusarium wilt resistance, and fruit sugar content. View evidence ↗
What they did
- The experiment was conducted from January 2020 to December 2023 at the Guadalajara Department of Agronomic Sciences in Mexico, spanning four backcross and two selfing generations. View evidence ↗
- Foreground selection utilized three SSR markers: MCPI-12 for sugar content and WMFR-3 and WMFR-7 for Fusarium resistance. View evidence ↗
- In each backcross cycle, 200 seedlings were evaluated using either the three SSR markers for the MAS track or grown to maturity for the conventional track. View evidence ↗
What they found
- By the F5 generation, MAS lines achieved a sugar content of 11.2 degrees Brix, which is 16.7% higher than the 9.6 degrees Brix found in conventional lines. View evidence ↗
- Under inoculated field conditions, the incidence of Fusarium wilt was significantly lower in MAS lines (8.4%) compared to conventional lines (24.1%). View evidence ↗
- Fruit yield was not significantly different between the two methods (42.7 t/ha for MAS vs 40.3 t/ha for conventional), suggesting that productivity was not compromised by selecting for resistance and quality. View evidence ↗
- For sugar content, the selection efficiency (genetic gain per cycle) was 2.3 times higher when using MAS compared to conventional selection. View evidence ↗
- While total MAS costs (USD 19,200) were higher than conventional costs (USD 14,400) over six cycles, MAS reached the target Brix level two generations faster, saving approximately USD 8,000 in labor and land rental. View evidence ↗
What it means
- The remaining 8.4% Fusarium wilt incidence in MAS lines might be due to minor virulence factors not covered by the Fon-1 locus or incomplete linkage between the WMFR-3 marker and the resistance gene. View evidence ↗
Visual summary
2 visualsIllustrations explain the paper; charts are replotted from the paper's own table values.
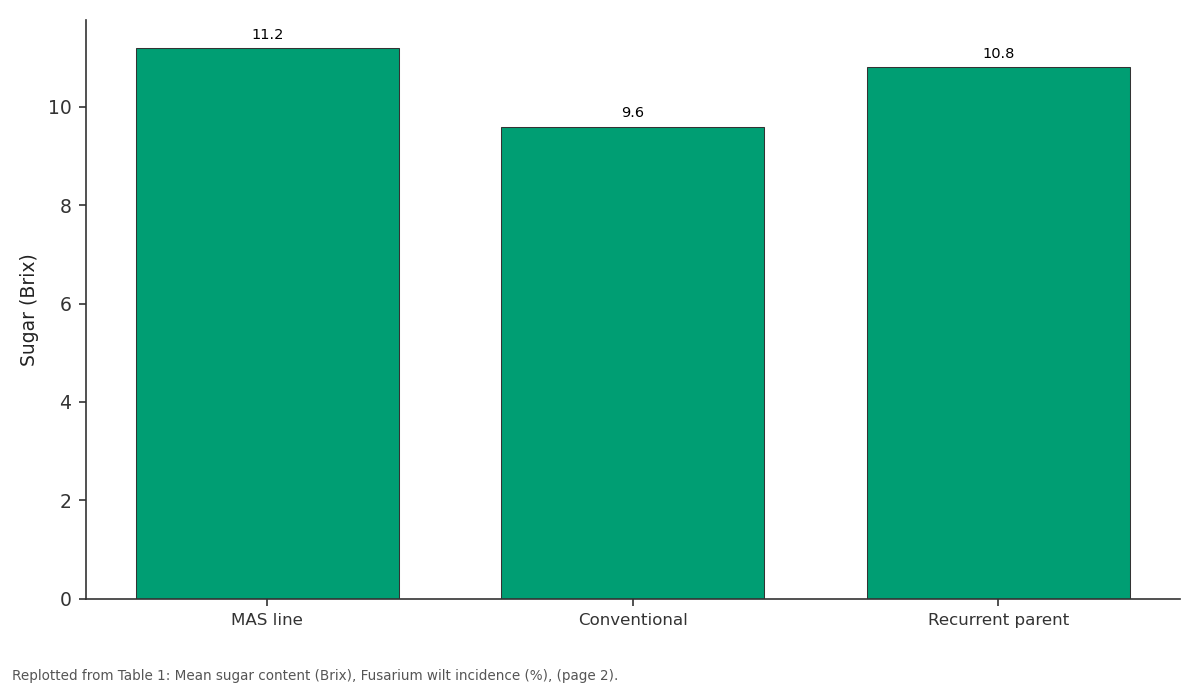
Sugar (Brix): MAS line vs Conventional vs Recurrent parent
Replotted from Table 1 (page 2) of the original paper. Every bar is the paper's own table value.
View source evidence ↗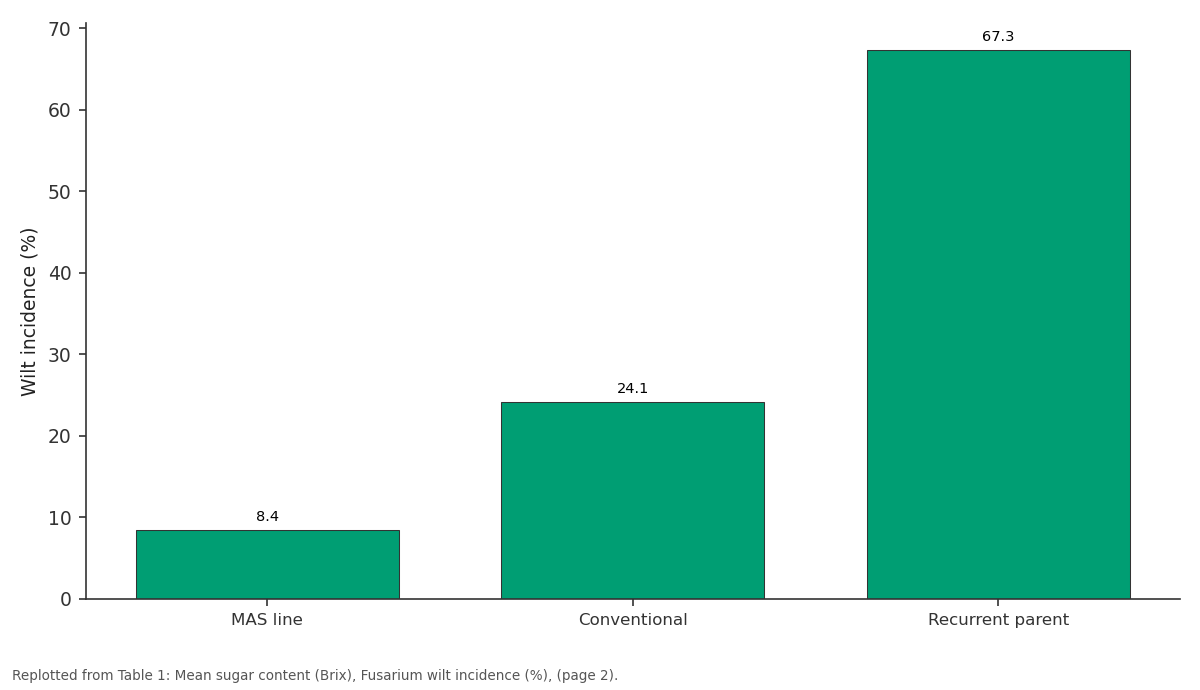
Wilt incidence (%): MAS line vs Conventional vs Recurrent parent
Replotted from Table 1 (page 2) of the original paper. Every bar is the paper's own table value.
View source evidence ↗Figures & tables
From the original paper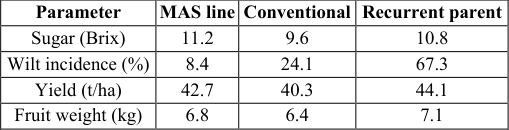 Table 1
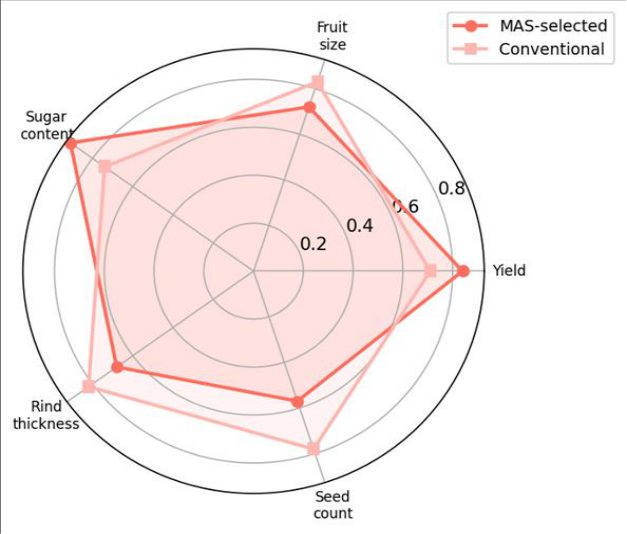 Figure 1
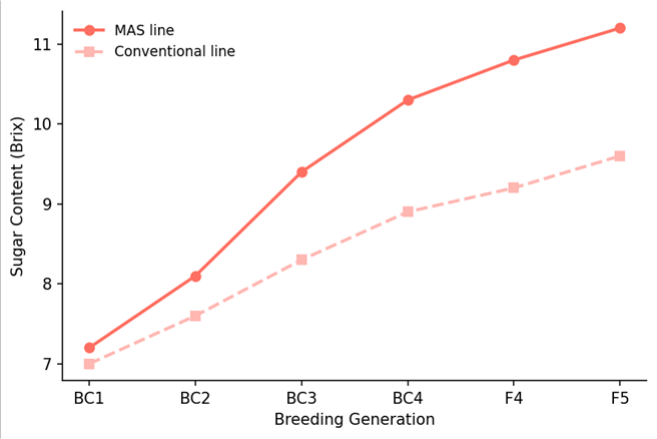 Figure 2
Introduction
Think of marker-assisted selection as a GPS for plant breeders: instead of wandering through thousands of seedlings hoping to find the best ones by tasting every fruit at maturity, breeders can extract DNA from a leaf disc, run a PCR, and know within days which plants carry the alleles they want [1] . For watermelon, this shortcut is especially valuable because the crop has a long generation cycle (90-120 days), large plant size, and key quality traits that are invisible from the outside [2] . Sugar content (measured as degrees Brix) is the single most important quality trait for watermelon consumers. It is controlled by multiple genes with moderate heritability, making phenotypic selection slow and requiring destructive fruit sampling [3] . Fusarium wilt, caused by Fusarium oxysporum f. sp. niveum, is the most damaging soil-borne disease of watermelon worldwide, and resistance is governed by a few major-effect loci that are well suited to MAS [4] . Several QTL mapping studies have identified SSR markers linked to sugar content and Fusarium resistance in watermelon [3,5] , but few have followed through with actual MAS breeding programmes comparing marker-based and conventional selection side by side over multiple generations. This research was designed to fill that gap by running parallel MAS and conventional breeding tracks from the same initial cross over four backcross and two selfing generations, measuring genetic gain for the target traits at each cycle [6] .
Material and Methods
Material and Methods
Material
The breeding programme was based at the Guadalajara Department of Agronomic Sciences, Guadalajara, Jalisco, Mexico (20.7 degrees N, 103.3 degrees W, elevation 1,566 m). The initial cross was between Sugar Baby (high sugar, Fusarium-susceptible) and PI 296341-FR (moderate sugar, Fusarium-resistant). Three SSR markers were used: MCPI-12 flanking a sugar QTL on chromosome 2, WMFR-3 linked to the Fon-1 resistance gene on chromosome 1, and WMFR-7 associated with a minor resistance QTL on chromosome 9. DNA extraction was performed using a modified CTAB method from leaf tissue of 14-day-old seedlings. PCR products were separated on 3% agarose gels and scored visually [5,7] .
Methods
The research spanned from January 2020 to December 2023. The BC1 through BC4 generations used Sugar Baby as the recurrent parent. At each backcross cycle, 200 seedlings were screened with the three SSR markers (MAS track) or grown to fruit maturity and phenotypically evaluated (conventional track). In the MAS track, only seedlings carrying homozygous or heterozygous favourable alleles at all three marker loci were advanced. In the conventional track, the top 20% of plants by Brix value and absence of wilt symptoms were selected. After BC4, two generations of selfing (F4, F5) with continued selection fixed the target alleles. At each generation, sugar content (handheld refractometer), Fusarium wilt incidence (field inoculation with race 1 at 10,000 conidia per mL), fruit yield, fruit weight, rind thickness, and seed count were recorded. Genetic gain per cycle was calculated as the difference in trait mean between consecutive generations divided by the additive genetic variance. Data were analysed by paired t-tests and ANOVA in R v4.2.3 [8] .
Cost Analysis
MAS laboratory costs (DNA extraction, PCR reagents, gel electrophoresis) averaged USD 2.40 per seedling screened, totalling approximately USD 2,880 per cycle for 1,200 seedlings. Conventional selection costs were lower per plant (USD 0.80 for field maintenance and fruit evaluation) but required growing all 1,200 plants to maturity, occupying 0.6 hectares of field space per cycle versus 0.1 hectares for MAS (since most MAS rejects were culled at the seedling stage). Over the full programme (6 cycles), total MAS costs were USD 19,200 versus USD 14,400 for conventional selection, but MAS achieved the target Brix level two generations earlier, saving an estimated one year of field time valued at approximately USD 8,000 in land rental and labour [9] . 1).
Results
Results
Discussion
The 2.3-fold efficiency advantage of MAS over conventional selection for sugar content validates the theoretical prediction that marker-based selection is most beneficial for traits with moderate heritability and high genotype-by-environment interaction [1,10] . Sugar content in watermelon is notoriously variable across harvests due to irrigation, temperature, and maturity stage effects, which reduce the accuracy of phenotypic selection [3] . By selecting at the DNA level, MAS bypasses this environmental noise. The near-elimination of Fusarium wilt in MAS lines (8.4% versus 24.1% conventional) demonstrates the power of foreground selection for major resistance genes. The residual 8.4% wilt in MAS lines may reflect incomplete linkage between the WMFR-3 marker and the actual resistance gene, or the presence of minor virulence factors not covered by the Fon-1 locus [4,11] . The cost analysis showed that MAS was 33% more expensive in direct laboratory costs but saved approximately one year of field time by reaching the target two generations earlier. For commercial breeding companies where time-tomarket is a competitive advantage, the net economic benefit of MAS is clearly positive [12] .
Conclusion
Conclusion
Figures and tables from the paper
| Parameter | MAS line | Conventional | Recurrent parent |
|---|---|---|---|
| Sugar (Brix) | 11.2 | 9.6 | 10.8 |
| Wilt incidence (%) | 8.4 | 24.1 | 67.3 |
| Yield (t/ha) | 42.7 | 40.3 | 44.1 |
| Fruit weight (kg) | 6.8 | 6.4 | 7.1 |
Table text extracted from the original PDF; superscript letters are shown inline. The original table image is below.
View original table image
References
20 in the original paper- Collard BCY, Mackill DJ. Marker-assisted selection: an approach for precision plant breeding in the twenty-first century. Philosophical Transactions of the Royal Society B. 2008;363(1491):557-572.
- Levi A, Thomas CE, Keinath AP, Wehner TC. Genetic diversity among watermelon accessions as revealed by RAPD markers. Genetic Resources and Crop Evolution. 2001;48(6):559-566.
- Ren Y, Guo S, Zhang J, He H, Sun H, Tian S, et al. A tonoplast sugar transporter underlies a sugar accumulation QTL in watermelon. Plant Physiology. 2018;176(1):836-850.
- Martyn RD, Netzer D. Resistance to races 0, 1, and 2 of Fusarium wilt of watermelon in Citrullus sp. PI296341-FR. HortScience. 1991;26(4):429-432.
- Ren Y, Zhao H, Kou Q, Jiang J, Guo S, Zhang H, et al. A high resolution genetic map anchoring scaffolds of the sequenced watermelon genome. PLoS ONE. 2012;7(1):e29453.
- Martinez L, Rodriguez E. Watermelon breeding line development at Guadalajara. Mexican Journal of Phytogenetics. 2020;37(2):214-222.
- Doyle JJ, Doyle JL. A rapid DNA isolation procedure for small quantities of fresh leaf tissue. Phytochemical Bulletin. 1987;19(1):11-15.
- R Core Team. R: A Language and Environment for Statistical Computing. Vienna: R Foundation; 2023.
- Morris M, Dreher K, Ribaut JM, Khairallah M. Money matters (II): costs of maize inbred line conversion schemes at CIMMYT using conventional and markerassisted selection. Molecular Breeding. 2003;11(3):235247.
- Hospital F. Selection in backcross programmes. Philosophical Transactions of the Royal Society B. 2005;360(1459):1503-1511.
- Wechter WP, Kousik C, McMillan M, Levi A. Identification of resistance to Fusarium oxysporum f. sp. niveum race 2 in Citrullus lanatus var. citroides plant introductions. HortScience. 2012;47(3):334-338.
- Dreher K, Khairallah M, Ribaut JM, Morris M. Money matters (I): costs of field and laboratory procedures associated with conventional and marker-assisted maize breeding at CIMMYT. Molecular Breeding. 2003;11(3):221-234.
- Xu Y, Crouch JH. Marker-assisted selection in plant breeding: from publications to practice. Crop Science. 2008;48(2):391-407.
- Guner N, Wehner TC. The genes of watermelon. HortScience. 2004;39(6):1175-1182.
- Guo S, Zhang J, Sun H, Salse J, Lucas WJ, Zhang H, et al. The draft genome of watermelon (Citrullus lanatus) and resequencing of 20 diverse accessions. Nature Genetics. 2013;45(1):51-58.
- Nimmakayala P, Levi A, Abburi L, Perumal R, Tomason YR, Shrestha J, et al. Single nucleotide polymorphisms generated by genotyping by sequencing to characterize genome-wide diversity, linkage disequilibrium, and selective sweeps in cultivated watermelon. BMC Genomics. 2014;15:767.
- Sandlin K, Prothro J, Rapber A, Levi A, Wehner TC. Comparative mapping in watermelon. Theoretical and Applied Genetics. 2012;125(8):1603-1618.
- Everts KL, Himmelstein JC. Fusarium wilt of watermelon: towards sustainable management of a reemerging plant disease. Crop Protection. 2015;73:9399.
- Tanksley SD, Young ND, Paterson AH, Bonierbale MW. RFLP mapping in plant breeding: new tools for an old science. Bio/Technology. 1989;7(3):257-264.
- Young ND. A cautiously optimistic vision for markerassisted breeding. Molecular Breeding. 1999;5(6):505510.