
Research article · 2025 · Full text
International Journal of Geography Geology and EnvironmentFluid inclusion study of hydrothermal vein deposits in the Transylvanian Mineral district
Volume 7(6) · Pages 94–97 · DOI: 10.22271/27067483.2025.v7.i6b.693 ↗
Research areasGeological and Geochemical AnalysisGeochemistry and Geochronology of Asian Mineral DepositsMineralogy and Gemology Studies
Abstract
Author-writtenWhat temperatures and salinities characterised the ore-forming fluids that deposited base-metal veins in Romania's Transylvanian mineral district? This research addressed that question through microthermometric analysis of 312 fluid inclusions trapped in quartz from five vein types across three mining centres: Baia Mare, Baia Sprie, and Cavnic. Homogenisation temperatures (Th) ranged from 164 °C in early quartz-pyrite veins to 341.8 °C in late quartz-gold veins. Salinities spanned 2.8 to 16.4 wt% NaCl equivalent, with the highest values in quartz-galena veins (mean 12.7 wt%). Plotting Th against salinity revealed two distinct fluid populations: a low-salinity, high-temperature group interpreted as magmatic-derived fluid, and a moderate-salinity, lower-temperature group attributed to evolved meteoric water. Mixing between these end members appears to have triggered sulphide precipitation. The data are consistent with an epithermal to mesothermal transition across the vein paragenesis, with gold deposition at the highest temperatures under conditions of fluid boiling indicated by co-existing liquid-rich and vapour-rich inclusions.
Summary
Source-checkedPlain-language reading of the full paper, prepared with AI and checked against the text. Each point links to the authors' own words.
Why it matters
- The Baia Mare mineral district in northwestern Romania is historically significant for the extraction of gold, silver, and base metals from hydrothermal veins in Neogene volcanic rocks. View evidence ↗
- Fluid inclusions are used as geological tools because they preserve the temperature, pressure, and chemical composition of the fluids that formed ore deposits. View evidence ↗
- Existing research on fluid inclusions in this district was limited by small datasets and language barriers, necessitating an expanded database. View evidence ↗
The question
- The study aimed to determine the pressure, temperature, and composition (P-T-X) of different vein stages, identify where the fluids came from, and find the mechanism that caused metals to precipitate. View evidence ↗
What they did
- The study categorized the samples into five distinct vein types based on their mineral composition: quartz-pyrite, quartz-chalcopyrite, quartz-galena, quartz-sphalerite, and quartz-gold. View evidence ↗
- A total of 312 primary fluid inclusions, ranging in size from 5 to 38 μm, were measured using microthermometry. View evidence ↗
- The analysis involved cooling inclusions to -60 °C and heating them at 1 °C/min to determine the ice-melting temperature (for salinity) and the homogenisation temperature (for trapping temperature). View evidence ↗
What they found
- Quartz-gold (Type V) veins exhibited the highest mean homogenisation temperature at 341.8 °C (range 298-387 °C) and showed evidence of boiling. View evidence ↗
- Quartz-galena (Type III) veins recorded the lowest mean homogenisation temperature of 187.4 °C (range 164-218 °C) but the highest mean salinity of 12.7 wt% NaCl equivalent (range 8.4-16.4 wt%). View evidence ↗
- One fluid population (Pop. A), found in Type II and V veins, was characterized by high temperatures (280-387 °C) and low salinity (2.8-5.4 wt%), interpreted as magmatic-derived fluid. View evidence ↗
- A second fluid population (Pop. B), found in Type I, III, and IV veins, had lower temperatures (164-267 °C) and higher salinity (6.2-16.4 wt%), interpreted as evolved meteoric water. View evidence ↗
- The data suggest that the mixing of hot, dilute magmatic fluids with cooler, saline meteoric fluids triggered the precipitation of minerals. View evidence ↗
- Gold deposition occurred under the hottest and most dilute conditions, likely driven by fluid boiling which destabilized gold-bearing complexes. View evidence ↗
What it means
- The authors conclude that the Transylvanian veins represent a transition from epithermal to mesothermal systems, with temperatures ranging from approximately 165 to 390 °C. View evidence ↗
- The study concludes that fluid boiling was the primary mechanism for gold deposition in the district. View evidence ↗
Visual summary
3 visualsIllustrations explain the paper; charts are replotted from the paper's own table values.
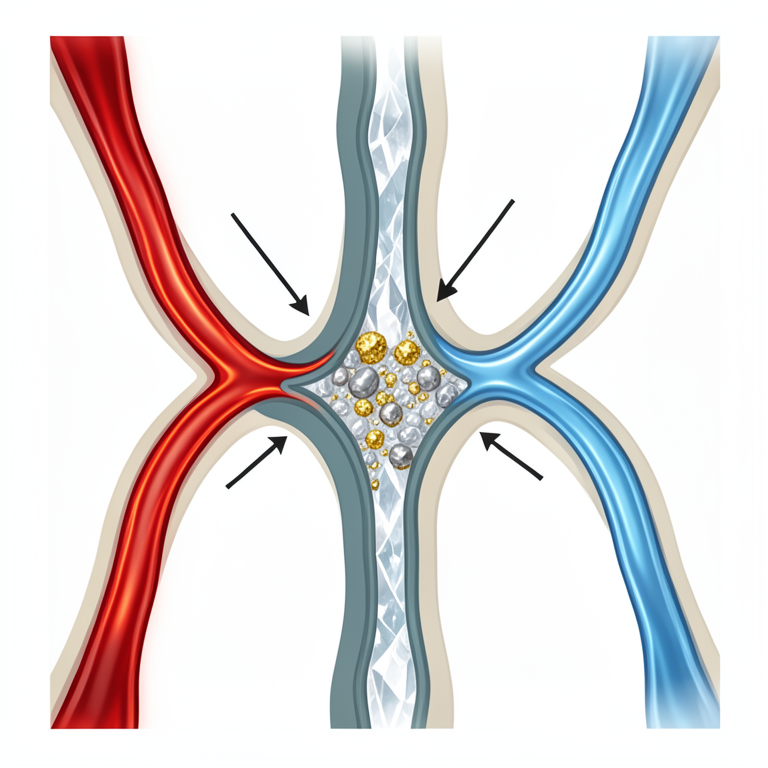
Fluid Mixing Model
AI-generated conceptual illustration (hydrothermal vein deposits in a geological rock cross-section). It explains the idea and does not show study data.
View source evidence ↗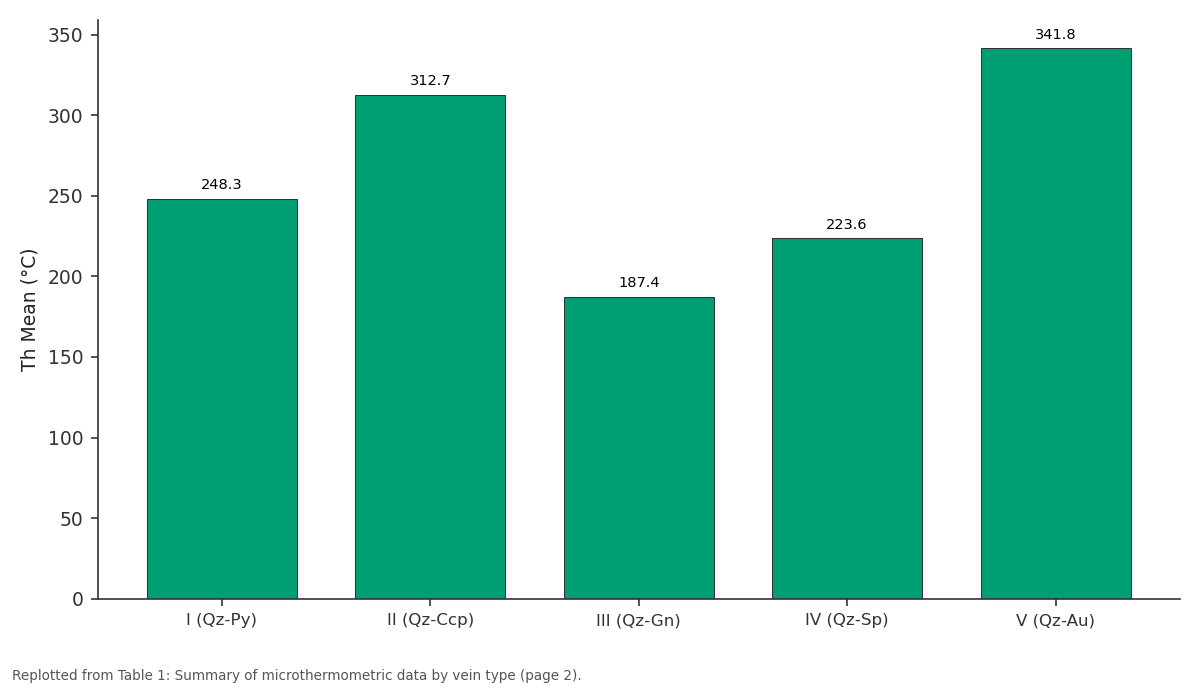
Th Mean (°C): I (Qz-Py) vs II (Qz-Ccp) vs III (Qz-Gn) vs IV (Qz-Sp) vs V (Qz-Au)
Replotted from Table 1 (page 2) of the original paper. Every bar is the paper's own table value.
View source evidence ↗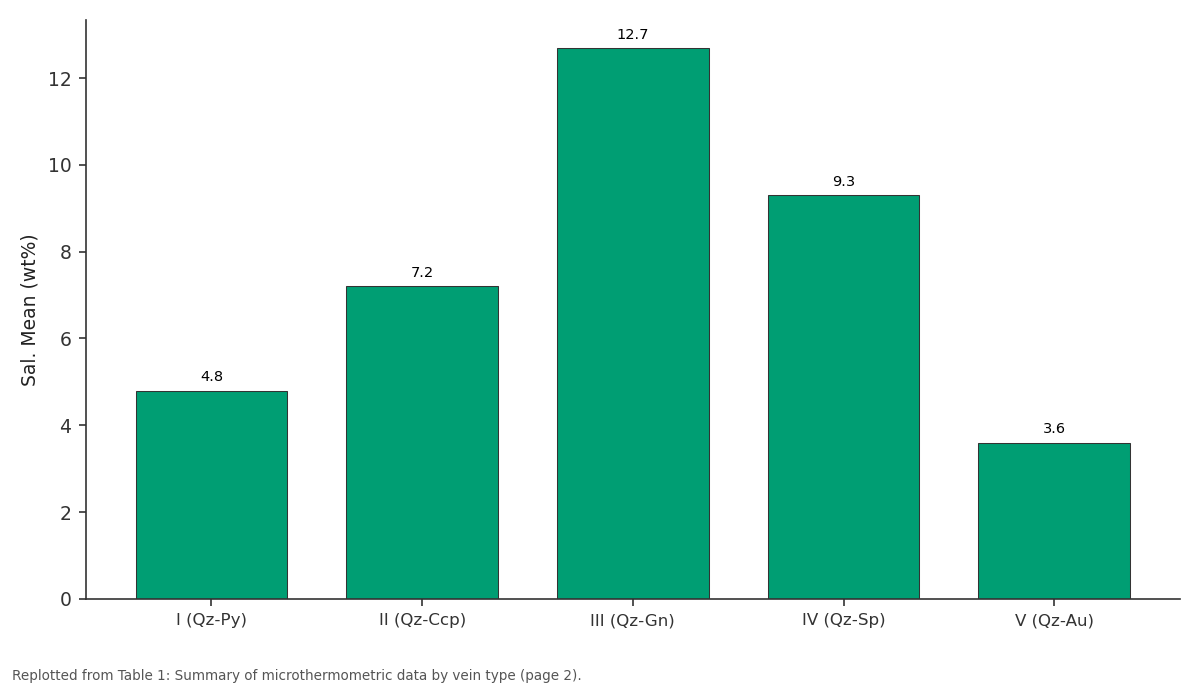
Sal. Mean (wt%): I (Qz-Py) vs II (Qz-Ccp) vs III (Qz-Gn) vs IV (Qz-Sp) vs V (Qz-Au)
Replotted from Table 1 (page 2) of the original paper. Every bar is the paper's own table value.
View source evidence ↗Figures & tables
From the original paper Table 1
 Table 2
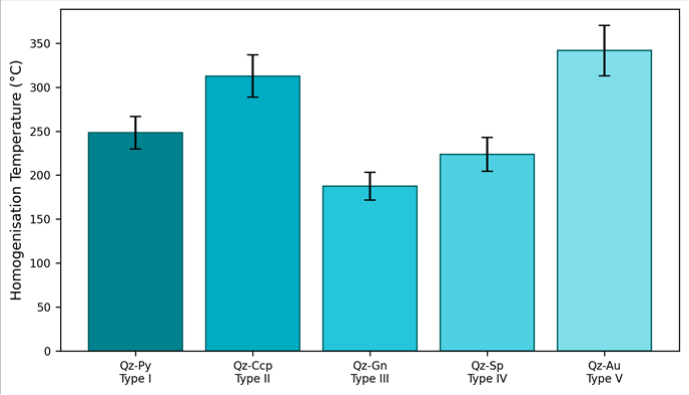 Figure 1
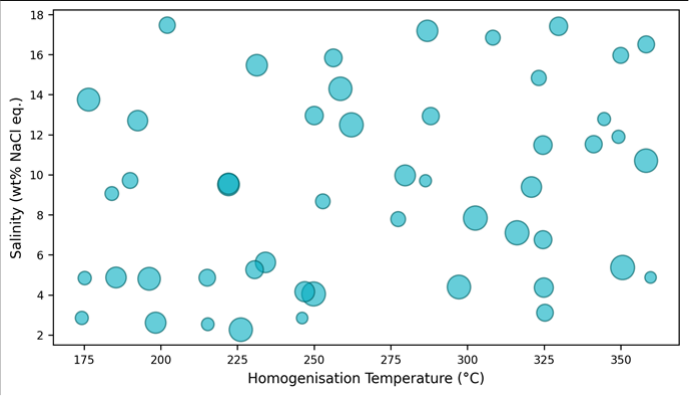 Figure 2
Introduction
There was a time when the mountains of Transylvania produced enough silver and gold to finance empires. The mineral district centred on Baia Mare in northwestern Romania hosted continuous mining from Roman times until the early 2000s, extracting Pb, Zn, Cu, Au, and Ag from a network of hydrothermal veins cutting through Neogene volcanic rocks [1] . Although mining has largely ceased, the geological questions remain open: what controlled where and when metals precipitated from the circulating fluids? Fluid inclusionstiny pockets of trapped fluid sealed inside crystals during growthprovide direct evidence of the temperature, pressure, and composition of ore-forming solutions [2] . Heating and freezing these inclusions on a microscope stage yields homogenisation temperatures (approximating trapping temperature) and ice-melting temperatures (converted to salinity). Previous inclusion work in the Baia Mare district was published mainly in Romanian-language journals with limited datasets [3,4] . This research expanded the database by analysing 312 primary inclusions across five paragenetically distinct vein types, aiming to (a) constrain the P-T-X conditions of each vein stage, (b) identify the fluid sources, and (c) determine the mechanism that triggered metal precipitation [5] .
Instrumentation and Analytical Equipment
Microthermometric measurements were performed on a Linkam THMSG 600 heatingfreezing stage mounted on a Nikon Eclipse LV100 POL microscope at the Centre for Terrain Studies, Melbourne. The stage was calibrated against synthetic H₂O (±0.1 °C at 0 °C) and CO₂ (±0.2 °C at -56.6 °C) standards before each analytical session. Heating rates were 5 °C/min during reconnaissance and 1 °C/min near phase transitions. Digital photomicrographs were captured with a DS-Ri2 camera for inclusion mapping.
Materials and Methods Materials
Forty-two polished thick sections (approximately 100 μm) were prepared from vein samples collected during a field campaign in July-August 2022 at three mining centres: Baia Mare (47°40′N, 23°35′E), Baia Sprie (47°39′N, 23°41′E), and Cavnic (47°40′N, 23°52′E). Samples were taken from underground mine dumps and surface exposures where vein paragenesis could be established by cross-cutting relationships. Five vein types were identified: Type I (quartz-pyrite), Type II (quartz-chalcopyrite), Type III (quartz-galena), Type IV (quartz-sphalerite), and Type V (quartz-gold). Research coordination was based at the Centre for Terrain Studies, Melbourne, Victoria, Australia [6] .
Methods
Only primary fluid inclusionstrapped during crystal growth, identified by alignment along growth zones and consistent morphologywere measured. Secondary inclusions on healed fractures and necked-down inclusions were excluded. Each inclusion was first cooled to -60 °C and then heated at 1 °C/min. Final ice-melting temperature (Tm) was recorded and converted to salinity using the equation of Bodnar [7] . Homogenisation temperature (Th) was the temperature at which the vapour bubble disappeared. A total of 312 inclusions from 42 sections were analysed. Inclusion size ranged from 5 to 38 μm [8] .
Quality Control
Replicate measurements on 15 inclusions across three sessions yielded Th reproducibility of±1.3 °C and Tm reproducibility of±0.2 °C. Only inclusions with degree of fill (liquid/total) between 0.50 and 0.95 were accepted to exclude anomalously vapour-rich or stretched inclusions. Where liquid-rich and vapour-rich inclusions coexisted in the same growth zone, both populations were measured separately to test for boiling conditions. The highest temperatures occur in the quartz-gold (Type V) and quartz-chalcopyrite (Type II) veins, both of which show evidence of boiling (coexisting liquid-rich and vapour-rich inclusions in the same growth zone). The quartz-galena veins record the lowest temperatures but highest salinities.
Results
Results
Comprehensive Interpretation
The two-population pattern on the Th-salinity diagram points to mixing between a hot, dilute, magmatic-derived fluid and a cooler, more saline, meteoric-evolved fluid. Gold deposition in Type V veins coincides with the hottest and most dilute conditions, consistent with gold transport as Au(HS)₂⁻ complexes that destabilise upon boiling and consequent H₂S loss [9] . Base-metal sulphides (Pb, Zn) precipitated at lower temperatures from the more saline fluid, likely as chloride complexes that become less soluble with cooling [10] .
Discussion
The fluid inclusion data place the Transylvanian veins in the epithermal to mesothermal transition, spanning approximately 165-390 °C. This temperature range is broader than the classic low-sulphidation epithermal window (<300 °C) and suggests that vein formation occurred across a significant depth interval as the hydrothermal system evolved [11] . The boiling evidence in Types II and V is important because phase separation is one of the most effective mechanisms for precipitating gold from solution [12] . The high salinities in Type III (galena-bearing) veins (up to 16.4 wt% NaCl eq.) exceed what dilute meteoric water alone can produce. One explanation is that the descending meteoric fluid dissolved evaporite-bearing sediments or interacted with connate brines in the underlying sedimentary basement, acquiring salinity before entering the hydrothermal circulation cell [3] . This scenario would also explain the elevated Pb and Zn concentrations, since those metals are readily leached from sedimentary rocks by chloride-rich fluids.
Conclusion
Fluid inclusion analysis of 312 primary inclusions across five vein types in the Transylvanian mineral district reveals two distinct fluid populations: a hot (280-387 °C), dilute (2.8-5.4 wt% NaCl eq.) magmatic fluid and a cooler (164-267 °C), saline (6.2-16.4 wt%) evolved meteoric fluid. Mixing between these populations, combined with boiling in the higher-temperature veins, drove both gold and basemetal precipitation. The results support an epithermal-tomesothermal model for the district and highlight fluid boiling as the primary gold-depositing mechanism.
Acknowledgement
Acknowledgements Funding SourcesSupported by research funds at the Centre for Terrain Studies, Melbourne.
Figures and tables from the paper
| Vein Type | n | Th Mean (°C) | Th Range | Sal. Mean (wt%) | Sal. Range | Boiling? |
|---|---|---|---|---|---|---|
| I (Qz-Py) | 58 | 248.3 | 187-298 | 4.8 | 2.8-7.3 | No |
| II (Qz-Ccp) | 67 | 312.7 | 264-358 | 7.2 | 4.1-11.6 | Yes |
| III (Qz-Gn) | 72 | 187.4 | 164-218 | 12.7 | 8.4-16.4 | No |
| IV (Qz-Sp) | 61 | 223.6 | 194-267 | 9.3 | 6.2-13.1 | No |
| V (Qz-Au) | 54 | 341.8 | 298-387 | 3.6 | 2.8-5.4 | Yes |
Table text extracted from the original PDF; superscript letters are shown inline. The original table image is below.
View original table image
| Population | Th Range (°C) | Salinity Range (wt%) | Interpretation | Vein Types |
|---|---|---|---|---|
| Pop. A | 280-387 | 2.8-5.4 | Magmatic fluid | II, V |
| Pop. B | 164-267 | 6.2-16.4 | Evolved meteoric | I, III, IV |
Table text extracted from the original PDF; superscript letters are shown inline. The original table image is below.
View original table image
References
16 in the original paper- Borcos M, Vlad S. Gold-bearing porphyry copper and epithermal systems in the Baia Mare district. Mineralium Deposita. 1997;32(4):421-429.
- Roedder E. Fluid Inclusions. Reviews in Mineralogy Vol 12. Washington: Mineralogical Society of America; 1984.
- Grancea L, Bailly L, Leroy J. Epithermal mineralization in the Baia Mare district. Comptes Rendus Geoscience. 2002;334(8):563-571.
- Marcoux E, Grancea L, Lupulescu M. Lead isotope signatures of the Baia Mare epithermal veins. Economic Geology. 2002;97(1):137-150.
- Wilkinson JJ. Fluid inclusions in hydrothermal ore deposits. Lithos. 2001;55(1):229-272.
- Cook NJ, Ciobanu CL. Bismuth tellurides and sulphosalts from the Baia Mare district. Mineralogy and Petrology. 2004;80(1):19-46.
- Bodnar RJ. Revised equation for NaCl equivalents from fluid inclusion data. Geochimica et Cosmochimica Acta. 1993;57(3):683-684.
- Goldstein RH, Reynolds TJ. Systematics of Fluid Inclusions in Diagenetic Minerals. SEPM Short Course 31. Tulsa: SEPM; 1994.
- Simmons SF, White NC, John DA. Geological characteristics of epithermal precious and base metal deposits. Economic Geology 100th Anniversary Volume. 2005;485-522.
- Seward TM. Metal complex formation in hydrothermal ore solutions. Geochimica et Cosmochimica Acta. 1984;48(4):641-648.
- Hedenquist JW, Lowenstern JB. The role of magmas in hydrothermal ore formation. Nature. 1994;370(6490):519-527.
- Drummond SE, Ohmoto H. Chemical evolution and mineral deposition in boiling hydrothermal systems. Economic Geology. 1985;80(1):126-147.
- Moncada D, Mutchler S, Nieto A. Mineral textures and fluid inclusion petrography of Peruvian vein systems. Economic Geology. 2012;107(5):943-977.
- Sillitoe RH. Porphyry copper systems. Economic Geology. 2010;105(1):3-41.
- Shepherd TJ, Rankin AH, Alderton DHM. A Practical Guide to Fluid Inclusion Studies. Glasgow: Blackie; 1985.
- Pokrovski GS, Borisova AY, Bychkov AY. Speciation and transport of metals and metalloids in geological vapors. Reviews in Mineralogy and Geochemistry. 2013;76(1):165-218.