
Research article · 2026 · Full text
International Journal of Geography Geology and EnvironmentSpatial analysis of radon gas concentration inside homes in Al-Huwaish neighborhood using geographic information systems (GIS), Najaf, Iraq
Volume 8(5) · Pages 28–34 · DOI: 10.22271/27067483.2026.v8.i5a.750 ↗
Research areasRadioactivity and Radon MeasurementsRadiation Dose and ImagingNuclear and radioactivity studies
Abstract
Author-writtenThe indoor radon level was assessed by field measurements and GIS based spatial analysis in Al-Huwaish neighborhood. Results Radon levels were in the interval of 22-100 Bq/m3 (median level 69.23 Bq/m3 which is less than WHO recommended limit: WHO recommends that indoor air radon < 100 Bq/ m3). This results in the area usually being within norms for radiation safety. The AED was determined to be in the range of 0.55-2.52 mSv/year with an average mean of 1.74 mSv/yr, and the lung cancer risk (CPPP) was from 10.0 to 45.4 cases per million with an average of 31•3 million cases per million. These values are also significantly smaller than the upper limits established by the International Commission on Radiological Protection (ICRP), so it is clearly seen that this example of low-energy gamma-ray emissions does not represent a public health problem as a whole.
Summary
Source-checkedPlain-language reading of the full paper, prepared with AI and checked against the text. Each point links to the authors' own words.
Why it matters
- Natural radioactive gases are a global public health concern because they are directly linked to an increased risk of lung cancer for people in indoor environments. View evidence ↗
- Radon is an undetectable noble gas that originates from the natural decay of uranium found in rocks, soil, and certain building materials. View evidence ↗
- Epidemiological evidence identifies radon exposure as the second leading cause of lung cancer, following tobacco smoking. View evidence ↗
The question
- The primary goal of the study was to examine the spatial distribution of indoor radon concentrations in the Al-Huwaish neighborhood using Geographic Information Systems (GIS). View evidence ↗
What they did
- The researchers conducted field measurements of indoor radon concentrations in 65 residential homes within the Al-Huwaish neighborhood of Najaf city. View evidence ↗
- Radon levels were measured using Airthings digital detectors over short-term testing periods of 7 days. View evidence ↗
- Detectors were placed 1-2 meters above the ground, primarily in bedrooms or living rooms, and kept away from vents, doors, and windows to ensure measurement accuracy. View evidence ↗
- Initial readings in picocuries per liter (pCi/L) were converted to becquerels per cubic meter (Bq/m³) by multiplying by a factor of 37. View evidence ↗
What they found
- Indoor radon concentrations in the neighborhood ranged from 22 to 100 Bq/m³, with a mean value of 69 Bq/m³. View evidence ↗
- The Annual Effective Dose (AED) ranged from 0.55 to 2.52 mSv/year, with an average of 1.74 mSv/year. View evidence ↗
- The lung cancer risk, measured as cases per million persons per year (CPPP), ranged from 10.0 to 45.4, with a mean of 31.3 cases per million. View evidence ↗
- The study found that homes with poor ventilation exhibited higher radon concentrations compared to those that were properly ventilated. View evidence ↗
What it means
- The authors conclude that because radon concentrations, AED, and CPPP are all below international safety thresholds, there is no immediate radiological risk in the Al-Huwaish neighborhood. View evidence ↗
- The authors recommend ongoing home-based monitoring and mitigation efforts, such as improving indoor ventilation, especially in areas with higher levels. View evidence ↗
Visual summary
2 visualsIllustrations explain the paper; charts are replotted from the paper's own table values.
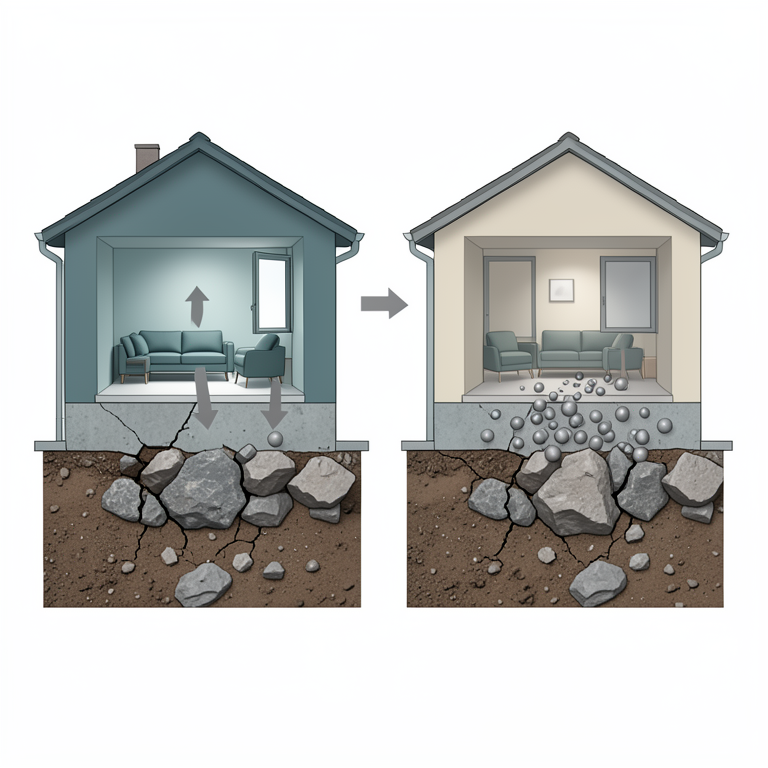
Radon Entry Mechanism
AI-generated conceptual illustration (a residential house with a concrete foundation and soil beneath). It explains the idea and does not show study data.
View source evidence ↗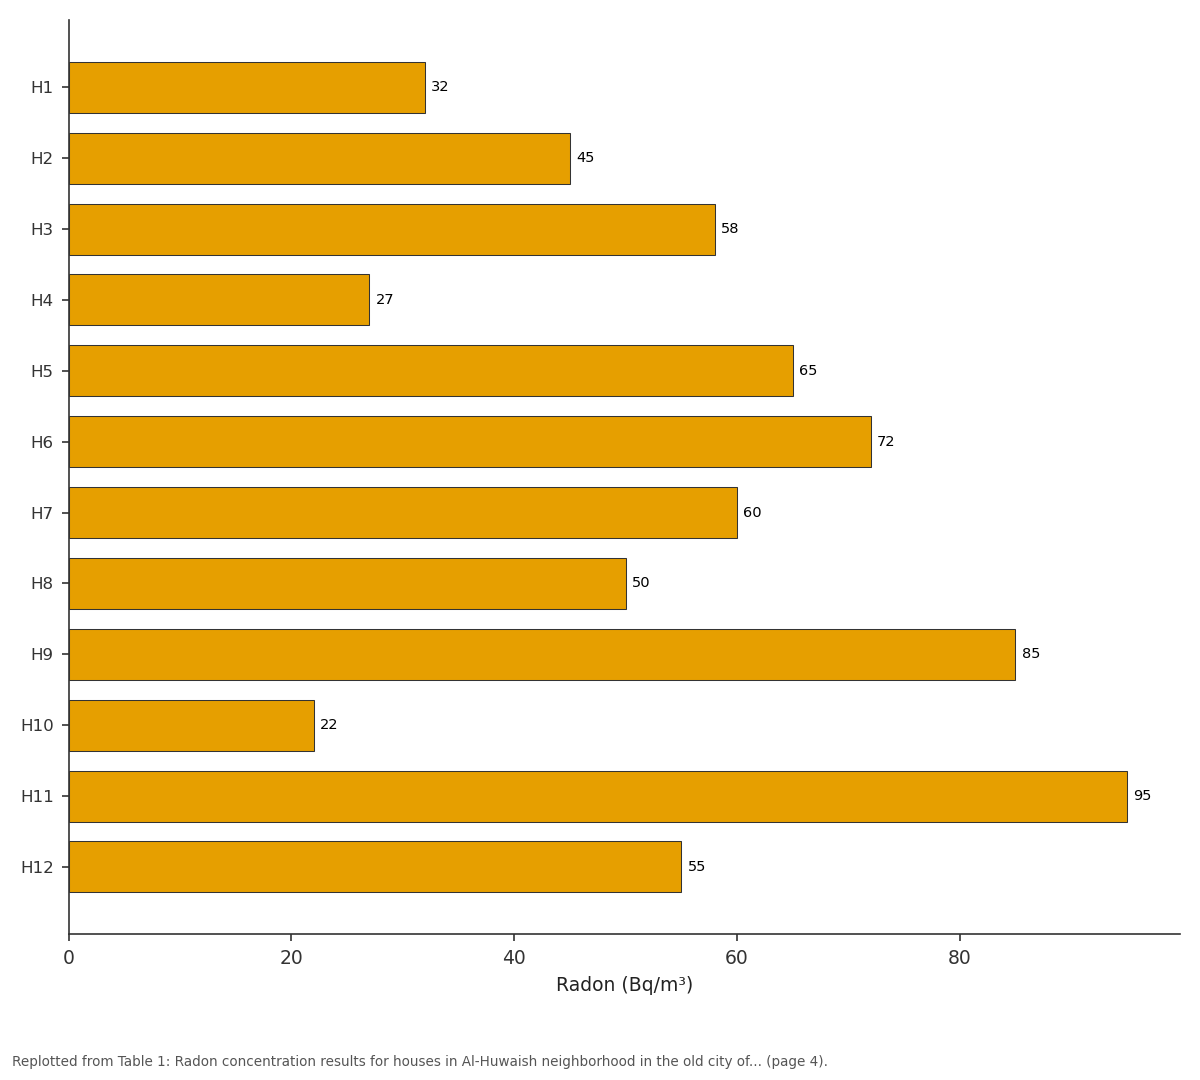
Radon (Bq/m³): H1 vs H2 vs H3 vs H4 vs H5
Replotted from Table 1 (page 4) of the original paper. Every bar is the paper's own table value.
View source evidence ↗Figures & tables
From the original paper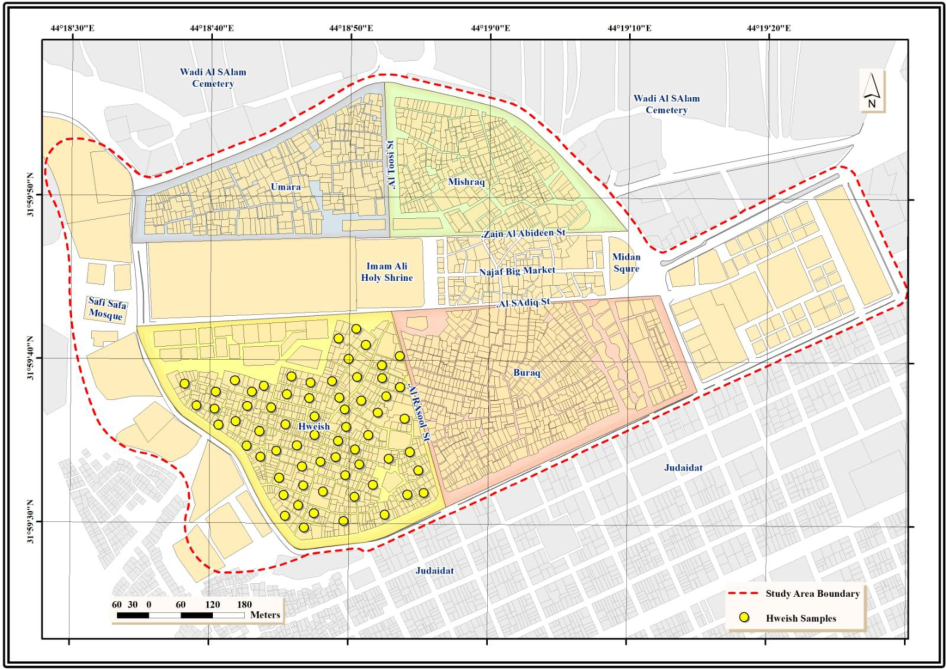 Figure 1
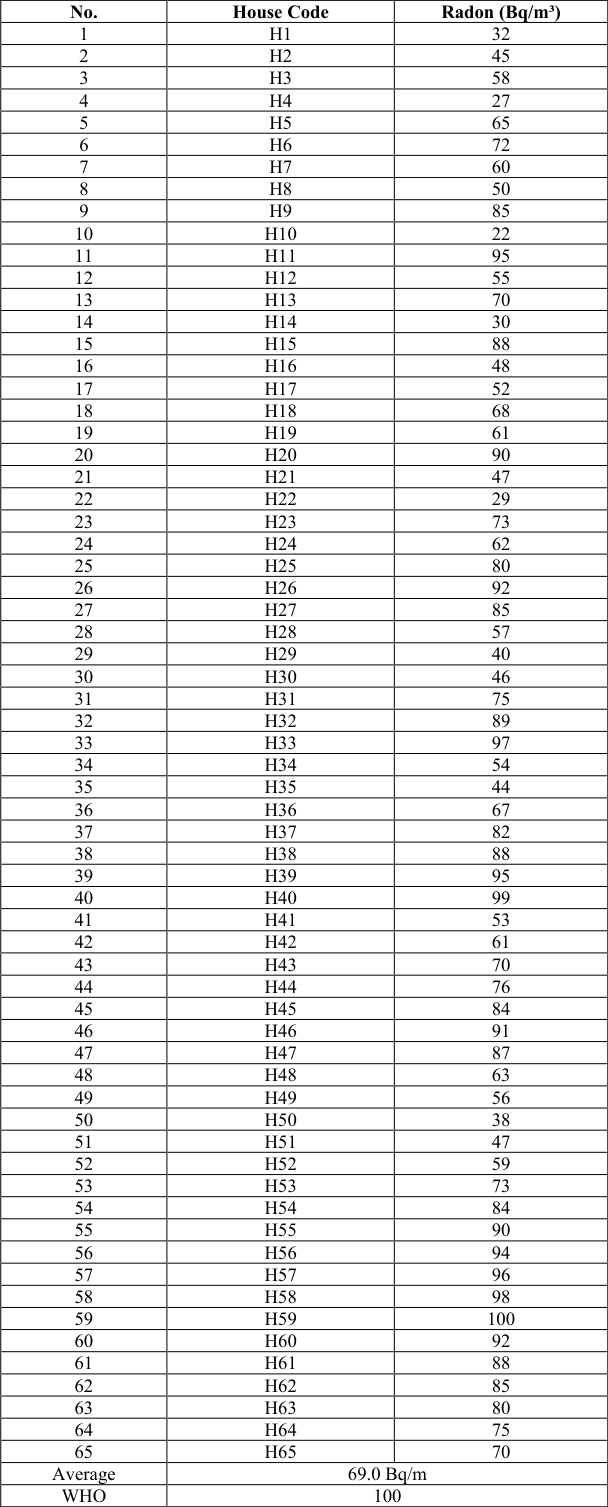 Table 1
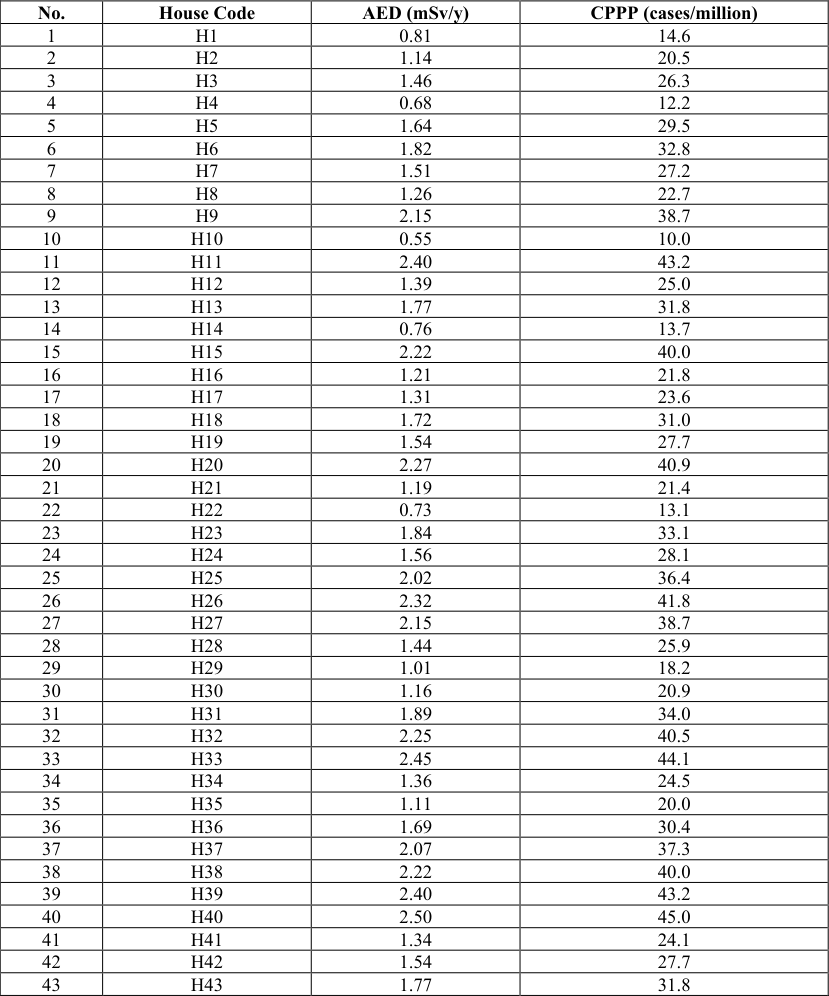 Table 2
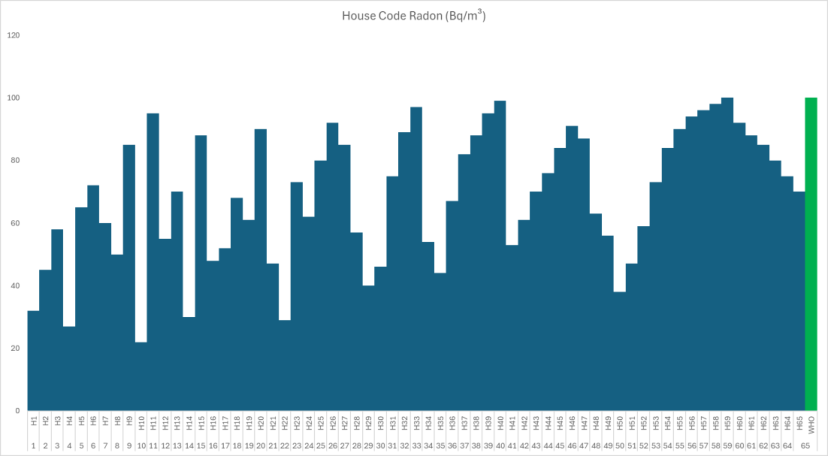 Figure 3
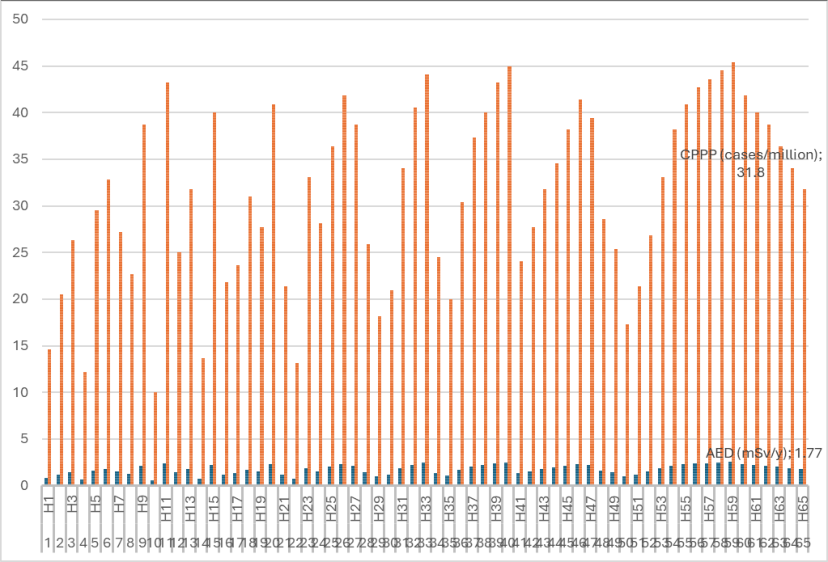 Figure 4
Introduction
Aside from high levels of indoor ionizing radiation emitted from human-made sources, natural radioactive gases are a worldwide environmental and public health problem because they correlate directly with the risk of lung cancer in humans, particularly indoors (in dwellings) [1] . Radon is a colorless, odorless and tasteless noble gas produced by the natural radioactive decay of uranium in soil, rocks and some construction materials. Radon is a gas that moves readily through porous media and becomes trapped in homes or other buildings when it enters through cracks in the floors, walls, foundations and gaps between pipes or cables. Radon can accumulate in confined spaces, and especially with low air flow indoor settings (i.e. homes), to concentrations that are expected to pose a significant chronic health risk for inhabitants of the space [2] . Radon exposure is well-documented as an environmental health risk, with a large body of epidemiological literature on radon exposure identifying it as the second-highest definitive cause of lung cancer after smoking. Together with additional environmental and behavioural hazards -for example tobacco consumption and protracted indoor publicity to biomass fuel this risk is worsened. As it is impossible for humans to introduce radon without measurements, this radio element often appears unnoticed as an invisible and high-risk environmental pollutant that must be systematically monitored and evaluated [1] . Owing to the human exposure to indoor radon during the last decades, scientists worldwide switched their research towards quantifying not only its concentrations and spatial distribution but also investigating displacement mechanisms and their controlling parameters. Because of the geological formations, soil permeability, uranium content and environmental variables radon values may differ a few meters apart. Similarly other factors such as building design, construction materials, age of buildings and ventilation rates are also important elements which found to be transformed [2][3] . Advanced analytical and spatial techniques can thus be utilized to evaluate radon distribution trend and identify risk areas. With GIS being a powerful and integrated platform for many environmental applications, it has documented the spatial variability (and consequent risk) of a wide variety of exposures. GIS: Type of geo-spital data research which integrate two dimensions of estate (e.g., location and attribute information (point measuring effective radon levels)). In general, GIS has been used in visualizing radon distribution and show by spatial interpolation (ie, surface or hot spot mapping thematic maps 4. GIS is also useful in providing inputs based on data, and it is precise to the point that mitigation-related decisions can be made within a certain time period and for environmental planning. Abstract. On one hand, Al-Huwaish district of Najaf city is a rural site that can be developed for such an important source in terms of its radon indoor radiogenic way This area has a very dense residency facts and figures so maybe the differences in geology and soil properties might interfere with indoor radon as well. The risk of inhalation due to radon is universal but national studies in Iraq are mostly vague and do not apply the latest methods such as spatial analysis using GIS. Lack of these data implies that understanding of radon behaviour in dwellings must be carried out so to understand those data which will serve as control data for other studies [4-5-6] . Science reaches into applied sciences in many areas such as spatial and environmental health. It can also determine areas where enforcement might be needed for building specifications or warnings to the public, on indoor-air quality. These efforts will be crucial to the ultimate goal of long-term persistence with disease burden reduction, notably in making urban areas safer (especially sub-Saharan Africa). Given this, the principal scientific objective of this research is examining in-house spatial calculation radon concentration for Al-Huwaish area using GIS. These experiments consist of systematic field measurements of radon, statistical inferences to estimate concentrations and geocartography to produce the continuous surface maps. These maps assist in identifying the risk zones, geographical area and its response with respect to various determining parameters like building type, soil characteristics and environmental behavior etc. as well defined Areal distribution of understood radar levels will be explained [7] .
Study area
The study area is Al-Huwaish neighborhood in Najaf city, Iraq: one of the most ancient and densely populated urban districts surrounding the Imam Ali Holy Shrine. The map is outlined in red tassel line clearly depicting the network of an extensive study area which consists of a small densely built residential area with irregular urban frameworks and compact housing units. Located near important landmarks such as Wadi Al-Salam Cemetery to the north, and major streets like Al-Toosi Street and Al-Sadiq Street, give shape not only to accessibility but to urban structure as well. Al-Huwaish is characterized by high population density, type of buildings and materials used in its construction, which may have led to variations in radon accumulation indoors. The neighborhood is mainly formed by residential apartments and it has limited open spaces and narrow streets that can influence the ventilation scenario resulting in pollutant accumulation inside buildings reducing indoor air quality. The locations of sampling points in yellow colors indicated a good coverage of the entire spatial pattern within this neighborhood well and high reliability for estimation on radon concentration in the study area.
The practical aspect
The actual part of this study was implemented by conducting a field measurements for radon concentrations indoor in 65 residential houses inside Al-Huwaish neighborhood, Najaf city. A systematic sampling process was followed to ensure spatial distribution of selected houses in the area of study (see Study map). This helps to increase the reliability of the spatial analysis and it makes sure that the neighborhood is well covered. Radon was measured using a digital radon detector device presented by Airthings, which is well-known and reliable for detecting indoor radon. The device generates near-continuous short and long-term averages in picocuries per liter (pCi/L) and records the data over extended periods of time. The device was placed approximately 1-2 m off the ground with adequate indoor placement (mostly in living rooms or bedroom) of individual household during installation. The device was placed at distance from windows, doors and vents which may interfere with the measurements of their performance exposed to direct sunlight. However, the militarised placement were done in high density populating regions to imitate blood exposure. They had made it through most of the testing period to be trusted. Values for radon were obtained from short-term tests (7 days) conducted in both partial and full/total duration, enabling immediate evaluation of respective radon concentrations that are more representative in actual importance than longer term averages which underwent analyses only for the quantification of sufficiently constant measures closest to actual environmental risk. House location in relationship to GPS (A totalization of a GPS is done when the device collects the radon expressed in picocuries per liter (pCi/L) and this quantity we have converted into becquerels per cubic meter (Bq/m³), which constitutes one internationally recognized SI unit). Consequently, all averaged readings were times by the factor 37 to put them into a Bq/m³ equivalent. This transformation conforms to international recommendations (WHO, IAEA) so that results can be compared with defined safety limits. [8][9][10][11] . 1) [12] where C represents the radon concentration, EF indicates the worldwide average of the EF for radon-222 and its progeny, which has a value of 0.4. H represents the occupancy factor, valued at 0.8, and T, which equals 8,760, denotes the number of hours per year, while D represents the dose conversion factor for adult age groups and is equal to 9×10⁻⁶ mSv/(Bq. hr/m 3 ) [13] .
The lung cancer cases per year per million person (CPPP) " have been determined by applying the formula 4. Results and discussion
The indoor radon concentrations that were obtained from Al-Huwaish neighborhood (Table (1) &Figure (3)) have clearly showed that there was an excellent variation in the suspended concentration of 222Rn. Values measured from 22 to 100 Bq/m 3 with a mean of 69 Bq/m 3 . This mean is less than the reference level of 100 Bq/m³ as recommended by World Health Organization (WHO) and proves that radiological safety limits would generally be safe for this area. It was observed that some houses like H59 (100 Bq/m³), H40 (99 Bq/m³) and H33(97 Bq/m³) were close to action level, suggesting localized areas of radon accumulation. Radon measurements in homes seem to be explained by the high content of uranium in the ground, a relatively high permeability of soil types near buildings (end or walls of buildings) and various building related characteristics such as insufficient air ventilation and openings that result from construction (floors / joints). Table (2) and Figure ( 4) present the AED and lung cancer risk (CPPP) due to radon exposure. AED values has been reported to ranges from 0.55 to 2.52 mSv/year with average AED equals 1.74 mSv/year which is lower than ICRP recommended range of the intervention level on human beeing which is in the 3-10 cGy/day This means the residents are at levels below drinking water standards. Likewise, CPPP frequencies (cases per million persons per year) exhibited a range of 10.0-45.4 cases/million (mean: 31.3 cases/million) and some worldwide reference values reported in PPB were130 -230 and >370-400 PPB respectively. This is another direct correlation relationship picture of the radon concentration and AED to CPPP which can easily explained by this post. The lung cancer risk also increases linearly with higher radon levels, over and beyond the annual effective dose. This relationship discovered is consistent with behaviour of the mathematical formulae in this study (compare Tables (1) and ( 2), and, trends in Figs. 3 and4. As well as tracks the concentration radon shown in Figure (3) The distribution of radon is inconsistent in the studied area. This difference is explained by the location and type of soil, which contains radium as well as building materials used for construction or age and other living conditions during their life.In contrast to properly ventilated homes, higher concentrations is seen in poorly ventilated residences. Overall, this indicates a safe level of radon exposure in Al-Huwaish neighbourhood. Those at most other localities, while fairly high should continue to advocate for ongoing home based monitoring and mitigation actions (e.g. enhancing indoor ventilation capacity). The consequence is crucial as the description of numerical enforceable shown in table (1)(2) with pictorial interpretation seen in Figure (3)(4) creates a complete iron radon distribution and support .
Conclusion
All computed indicators (radon concentration, AED and CPPP) are below the international safe thresholds verifying that indoor radon levels in Al-Huwaish neighborhood does not constitute an immediate radiological risk; nevertheless GIS-based analysis is also necessary for appropriate detection and identification of radon-prone areas consequently serves as a great tool for environmental risk assessment and local public health policy solution.
Figures and tables from the paper
| No. | House Code | Radon (Bq/m³) |
|---|---|---|
| 1 | H1 | 32 |
| 2 | H2 | 45 |
| 3 | H3 | 58 |
| 4 | H4 | 27 |
| 5 | H5 | 65 |
| 6 | H6 | 72 |
| 7 | H7 | 60 |
| 8 | H8 | 50 |
| 9 | H9 | 85 |
| 10 | H10 | 22 |
| 11 | H11 | 95 |
| 12 | H12 | 55 |
| 13 | H13 | 70 |
| 14 | H14 | 30 |
| 15 | H15 | 88 |
| 16 | H16 | 48 |
| 17 | H17 | 52 |
| 18 | H18 | 68 |
| 19 | H19 | 61 |
| 20 | H20 | 90 |
| 21 | H21 | 47 |
| 22 | H22 | 29 |
| 23 | H23 | 73 |
| 24 | H24 | 62 |
| 25 | H25 | 80 |
| 26 | H26 | 92 |
| 27 | H27 | 85 |
| 28 | H28 | 57 |
| 29 | H29 | 40 |
| 30 | H30 | 46 |
| 31 | H31 | 75 |
| 32 | H32 | 89 |
| 33 | H33 | 97 |
| 34 | H34 | 54 |
| 35 | H35 | 44 |
| 36 | H36 | 67 |
| 37 | H37 | 82 |
| 38 | H38 | 88 |
| 39 | H39 | 95 |
| 40 | H40 | 99 |
| 41 | H41 | 53 |
| 42 | H42 | 61 |
| 43 | H43 | 70 |
| 44 | H44 | 76 |
| 45 | H45 | 84 |
| 46 | H46 | 91 |
| 47 | H47 | 87 |
| 48 | H48 | 63 |
| 49 | H49 | 56 |
| 50 | H50 | 38 |
| 51 | H51 | 47 |
| 52 | H52 | 59 |
| 53 | H53 | 73 |
| 54 | H54 | 84 |
| 55 | H55 | 90 |
| 56 | H56 | 94 |
| 57 | H57 | 96 |
| 58 | H58 | 98 |
| 59 | H59 | 100 |
| 60 | H60 | 92 |
| 61 | H61 | 88 |
| 62 | H62 | 85 |
| 63 | H63 | 80 |
| 64 | H64 | 75 |
| 65 | H65 | 70 |
| Average | 69.0 Bq/m | |
| WHO | 100 |
Table text extracted from the original PDF; superscript letters are shown inline. The original table image is below.
View original table image
| No. | House Code | AED (mSv/y) | CPPP (cases/million) |
|---|---|---|---|
| 1 | H1 | 0.81 | 14.6 |
| 2 | H2 | 1.14 | 20.5 |
| 3 | H3 | 1.46 | 26.3 |
| 4 | H4 | 0.68 | 12.2 |
| 5 | H5 | 1.64 | 29.5 |
| 6 | H6 | 1.82 | 32.8 |
| 7 | H7 | 1.51 | 27.2 |
| 8 | H8 | 1.26 | 22.7 |
| 9 | H9 | 2.15 | 38.7 |
| 10 | H10 | 0.55 | 10.0 |
| 11 | H11 | 2.40 | 43.2 |
| 12 | H12 | 1.39 | 25.0 |
| 13 | H13 | 1.77 | 31.8 |
| 14 | H14 | 0.76 | 13.7 |
| 15 | H15 | 2.22 | 40.0 |
| 16 | H16 | 1.21 | 21.8 |
| 17 | H17 | 1.31 | 23.6 |
| 18 | H18 | 1.72 | 31.0 |
| 19 | H19 | 1.54 | 27.7 |
| 20 | H20 | 2.27 | 40.9 |
| 21 | H21 | 1.19 | 21.4 |
| 22 | H22 | 0.73 | 13.1 |
| 23 | H23 | 1.84 | 33.1 |
| 24 | H24 | 1.56 | 28.1 |
| 25 | H25 | 2.02 | 36.4 |
| 26 | H26 | 2.32 | 41.8 |
| 27 | H27 | 2.15 | 38.7 |
| 28 | H28 | 1.44 | 25.9 |
| 29 | H29 | 1.01 | 18.2 |
| 30 | H30 | 1.16 | 20.9 |
| 31 | H31 | 1.89 | 34.0 |
| 32 | H32 | 2.25 | 40.5 |
| 33 | H33 | 2.45 | 44.1 |
| 34 | H34 | 1.36 | 24.5 |
| 35 | H35 | 1.11 | 20.0 |
| 36 | H36 | 1.69 | 30.4 |
| 37 | H37 | 2.07 | 37.3 |
| 38 | H38 | 2.22 | 40.0 |
| 39 | H39 | 2.40 | 43.2 |
| 40 | H40 | 2.50 | 45.0 |
| 41 | H41 | 1.34 | 24.1 |
| 42 | H42 | 1.54 | 27.7 |
| 43 | H43 | 1.77 | 31.8 |
Table text extracted from the original PDF; superscript letters are shown inline. The original table image is below.
View original table image
References
20 in the original paper- Hassanvand H, Birjandi M, Amiri A, Hassanvand M, Kamarehie B. Investigation of indoor radon concentration in dwellings of Aleshtar (western part of Iran) and estimation of the annual effective dose from exposure to radon. International Journal of Radiation Research. 2019;17:659-666.
- Harb S. Measurements level of radon-222 in some houses by using SSNTDS in Qena City, Egypt. In: Proceeding of the 9th Conference on Nuclear Particle Physics. 2015. p. 11-15.
- Dosh RJ, Abojassim AA. Assessment of radiological risk associated with thoron gas at primary schools in Al-Najaf city, Iraq. Applied Radiation and Isotopes. 2024;205:111154.
- Wasikiewicz J, Daraktchieva Z, Howarth C. Passive etched track detectors application in outdoor radon monitoring. Perspectives in Science. 2019;12:100416.
- Al Zabadi H, Mallah K, Saffarini G. Indoor exposure assessment of radon in the elementary schools, Palestine. International Journal of Radiation. 2015;13:221-228.
- Al-Awadi L, Khan A. Indoor radon levels in schools and residential dwellings in Kuwait. International Journal of Environmental Science and Technology. 2019;16:2627-2636.
- Loffredo F, Opoku-Ntim I, Meo G, Quarto M. Indoor radon monitoring in kindergarten and primary schools in south Italy. Atmosphere. 2022;13:478-486.
- Dosh RJ, Muhamad QB, Abojassim AA. Dose assessment for radon and thoron concentrations in Iraqi thermostone bricks. In: E3S Web of Conferences. 2023. p. 06029.
- Hashim AK, Nayif SS. Assessment of internal exposure to radon in schools in Karbala, Iraq. J Rad Nucl Appl. 2019;4:25-34.
- Mohammed AK, Al_Salimi MSS, Ahmed M. Indoor Radon-222 concentration measurements at faculty of education, Yafea, Aden University, Yemen, using Cr39 nuclear track detector. Electronic Journal of University of Aden for Basic and Applied Sciences. 2021;2:161-168.
- El-Badry BA, Al-Naggar TI. Estimation of indoor radon levels using etched track detector. Journal of Radiation Research and Applied Sciences. 2018;11:355-360.
- United Nations Scientific Committee on the Effects of Atomic Radiation. Effects of ionizing radiation: UNSCEAR 2006 report, volume 1-report to the General Assembly, with scientific annexes A and B. Oxford: Oxford University Press; 2006.
- Fahiminia M, Fard RF, Ardani R, Naddafi K, Hassanvand M, Mohammadbeigi A. Indoor radon measurements in residential dwellings in Qom, Iran. International Journal of Radiation Research. 2016;14:331.
- Collignan B, Le Ponner E, Mandin C. Relationships between indoor radon concentrations, thermal retrofit and dwelling characteristics. Journal of Environmental Radioactivity. 2016;165:124-130.
- Quarto M, Pugliese M, Loffredo F, Roca V. Indoor radon concentration measurements in some dwellings of the Penisola Sorrentina, South Italy. Radiation Protection Dosimetry. 2013;156:207-212.
- Collignan B, Powaga E. Procedure for the characterization of radon potential in existing dwellings and to assess the annual average indoor radon concentration. Journal of Environmental Radioactivity. 2014;137:64-70.
- Finne IE, Kolstad T, Larsson M, Olsen B, Prendergast J, Rudjord AL. Significant reduction in indoor radon in newly built houses. Journal of Environmental Radioactivity. 2019;196:259-263.
- Yarmoshenko I, Vasilyev A, Malinovsky G, Bossew P, Žunić ZS, Onischenko A, et al. Variance of indoor radon concentration: major influencing factors. Science of the Total Environment. 2016;541:155-160.
- Elola WYA, Bambara TL, Doumounia A, Kohio N, Ouédraogo S, Zougmore F. Assessment of radon concentrations inside residential buildings and estimation of the dose in the city of Kaya, Burkina Faso. Open Journal of Applied Sciences. 2023;13:10661078.
- Ndubisi OA, Briggs-Kamara MA, Sigalo FB, Iyeneomie TA. Analysis of indoor radon level and its health risks parameters in three selected towns in Port Harcourt, Rivers State, Nigeria. Journal of the Nigerian Society of Physical Sciences. 2021:181-188.