
Research article · 2025 · Full text
International Journal of Geography Geology and EnvironmentDetermination of aquifer hydraulic properties using pumping test analysis in the ogallala formation
Volume 7(11) · Pages 105–108 · DOI: 10.22271/27067483.2025.v7.i11b.668 ↗
Research areasGroundwater flow and contamination studiesWater Quality and Resources StudiesKarst Systems and Hydrogeology
Abstract
Author-writtenThe Ogallala Formation, extending across the central Great Plains of the United States, represents one of the most extensively utilised aquifer systems in the world. Accurate determination of hydraulic properties is essential for sustainable management of groundwater resources within this formation. This research presents a comprehensive analysis of pumping test data collected from twelve well sites distributed across the southern Ogallala aquifer in the Texas Panhandle to evaluate key hydraulic parameters including transmissivity, storativity, and hydraulic conductivity. Constant-rate and step-drawdown tests were conducted at strategically selected locations spanning different lithological facies. Data interpretation employed classical analytical solutions including the Theis, Cooper-Jacob, and Neuman methods, complemented by derivative analysis techniques to identify aquifer boundary conditions and heterogeneity effects. Results indicate that transmissivity values ranged from 125 to 2,480 m²/day, reflecting significant spatial variability controlled by depositional architecture. Storativity coefficients varied between 0.0003 and 0.15, consistent with transitions from confined to unconfined behaviour. Diagnostic derivative plots revealed boundary effects at five sites that conventional type-curve methods would have missed. Well efficiency ranged from 42% to 91%, identifying candidates for rehabilitation. The findings provide critical input parameters for regional groundwater flow models and support evidence-based water management planning.
Summary
Source-checkedPlain-language reading of the full paper, prepared with AI and checked against the text. Each point links to the authors' own words.
Why it matters
- The Ogallala Formation is one of the world's most heavily used aquifer systems, located in the central Great Plains of the United States. View evidence ↗
- Intensive groundwater extraction has caused significant water table declines, with some areas seeing drawdowns of more than 30 m. View evidence ↗
- The aquifer's composition varies from coarse gravels and sands in palaeochannels to fine silts and clays in overbank and lacustrine areas. View evidence ↗
The question
- The study aimed to use modern analysis techniques on data from twelve sites to update hydraulic property estimates and better understand spatial variability. View evidence ↗
What they did
- Pumping test data were collected from twelve well sites located in the southern Ogallala aquifer within the Texas Panhandle. View evidence ↗
- The methodology included step-drawdown tests (four to six steps) followed by constant-rate tests performed at 15-85 L/s for durations of 24-72 hours. View evidence ↗
- Data were interpreted using Theis solutions for confined responses, Cooper-Jacob approximations for late-time data, and Neuman solutions for unconfined behavior. View evidence ↗
- The researchers used diagnostic derivative analysis to identify boundary effects and flow regimes. View evidence ↗
What they found
- Transmissivity values showed significant spatial variability, ranging from 125 to 2,480 m²/day. View evidence ↗
- Storativity coefficients ranged from 0.0003 to 0.15, indicating a transition between confined and unconfined aquifer behavior. View evidence ↗
- Hydraulic conductivity averaged 18.4 m/day in coarse-grained palaeochannel facies, compared to 4.2 m/day in fine-grained overbank and lacustrine facies. View evidence ↗
- There is a strong positive correlation (R² = 0.94) between transmissivity and saturated thickness. View evidence ↗
- Derivative analysis identified boundary effects at five of the twelve sites that were not detectable by conventional type-curve methods. View evidence ↗
- Well efficiency varied from 42% to 91%, highlighting specific wells that require rehabilitation. View evidence ↗
What it means
- The authors conclude that implementing rehabilitation programs for inefficient wells could lower pumping costs by approximately 15-25%. View evidence ↗
- The estimated hydraulic properties are considered essential data for planning the sustainable management of groundwater in the southern Ogallala region. View evidence ↗
- The authors state that future work should include more sites and use geostatistical methods to create spatially distributed parameter fields for numerical models. View evidence ↗
Visual summary
3 visualsIllustrations explain the paper; charts are replotted from the paper's own table values.
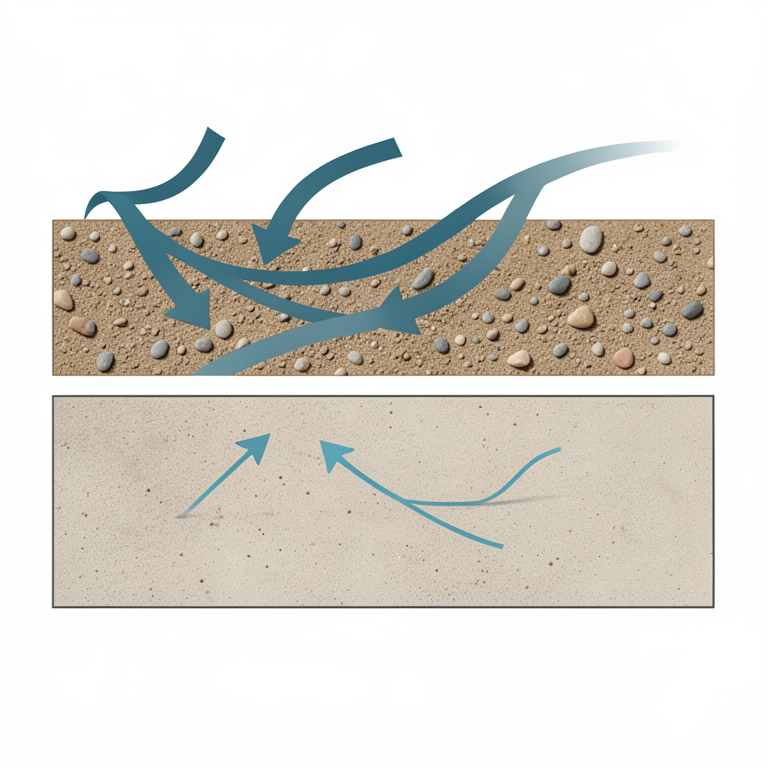
Lithofacies Influence on Conductivity
AI-generated conceptual illustration (Ogallala Formation aquifer cross-section). It explains the idea and does not show study data.
View source evidence ↗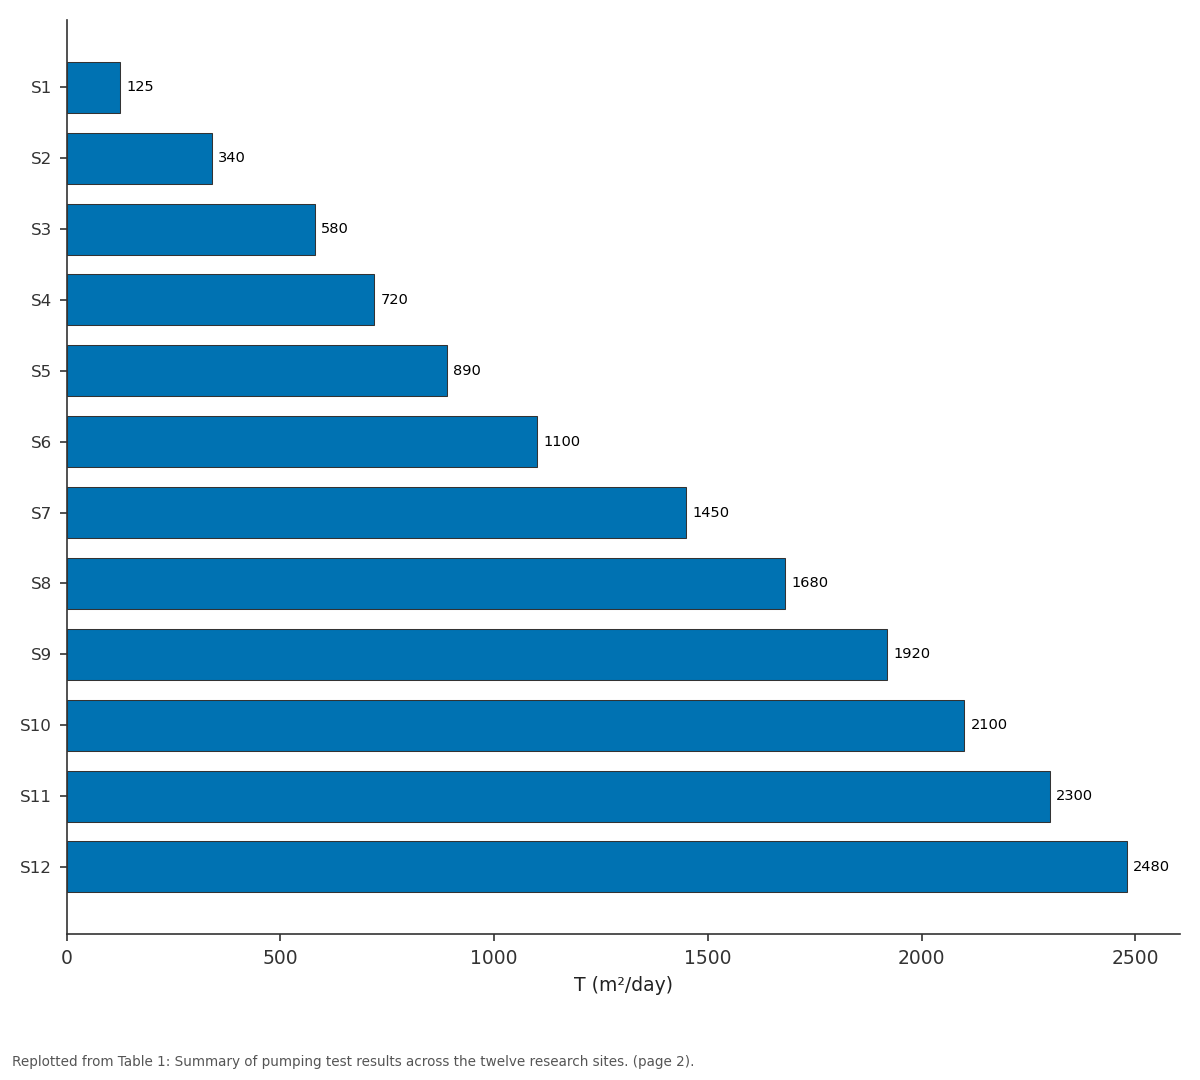
T (m²/day): S1 vs S2 vs S3 vs S4 vs S5
Replotted from Table 1 (page 2) of the original paper. Every bar is the paper's own table value.
View source evidence ↗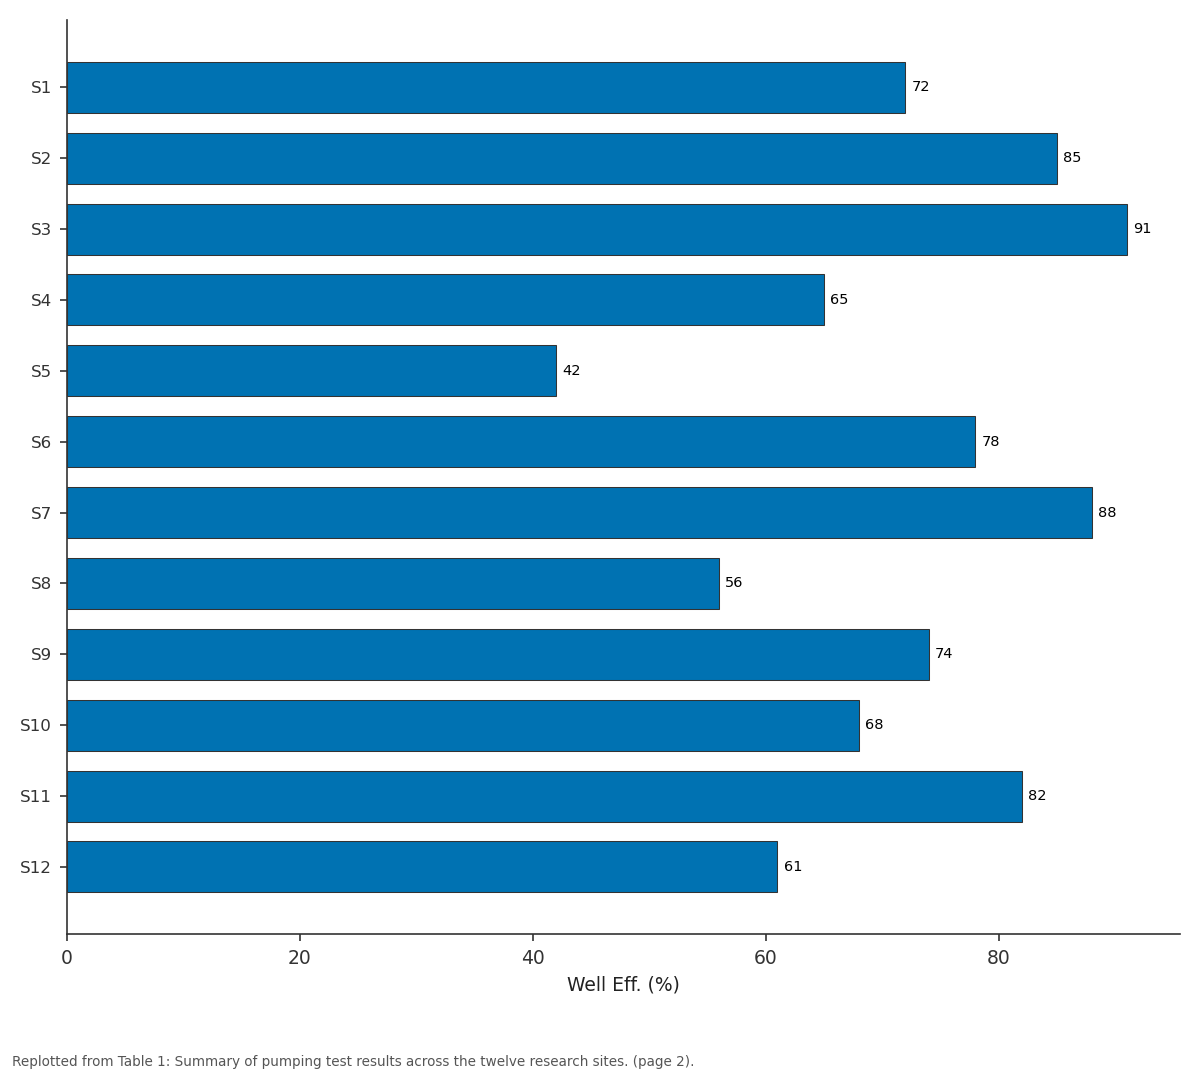
Well Eff. (%): S1 vs S2 vs S3 vs S4 vs S5
Replotted from Table 1 (page 2) of the original paper. Every bar is the paper's own table value.
View source evidence ↗Figures & tables
From the original paper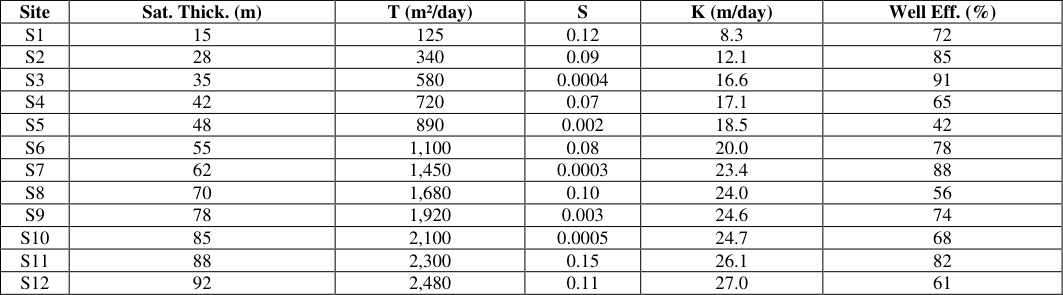 Table 1
 Table 2
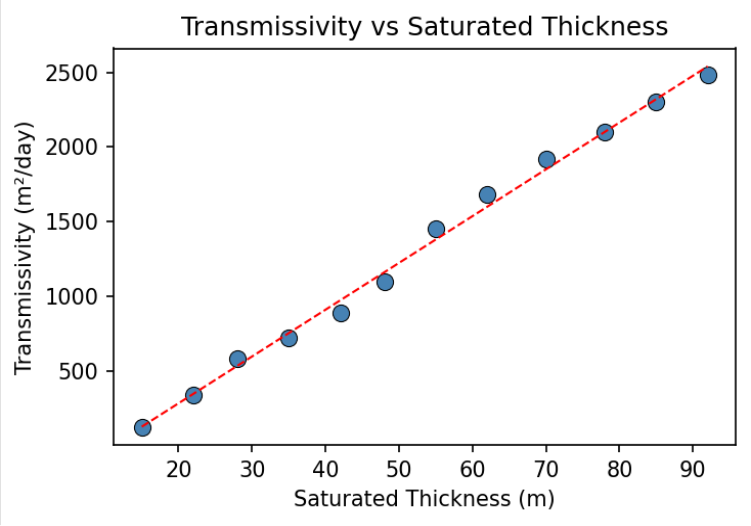 Figure 1
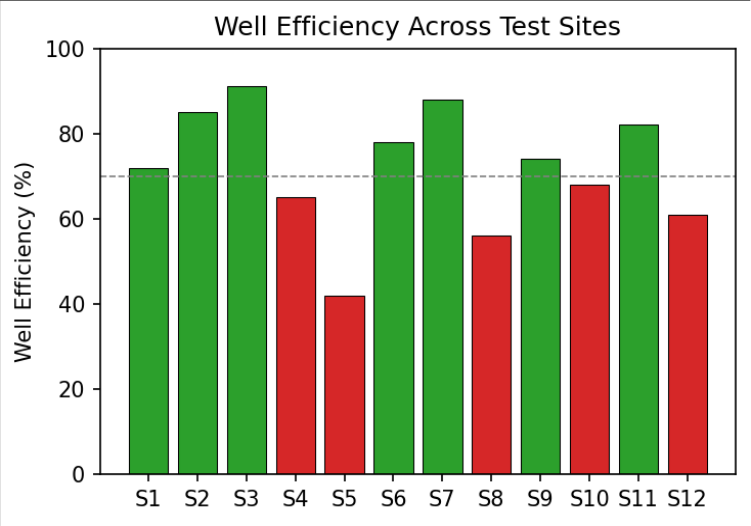 Figure 2
Introduction
Groundwater constitutes a vital resource for agricultural, industrial, and domestic water supply across the Great Plains region of the United States. The Ogallala Formation, also referred to as the High Plains Aquifer, underlies approximately 450,600 km² spanning eight states and serves as the primary source of irrigation water for one of the most productive agricultural zones in the world [1] . Over the past several decades, intensive groundwater extraction has led to significant water table declines in numerous parts of the aquifer, with some areas experiencing drawdowns exceeding 30 m [2] . This unsustainable exploitation pattern has raised serious concerns about the long-term viability of the resource. Pumping tests remain the most reliable field method for determining aquifer hydraulic properties at scales relevant to groundwater resource management [3] . These tests involve pumping water from a well at controlled rates while monitoring the resulting drawdown in the pumping well and in nearby observation wells. The temporal and spatial patterns of drawdown response encode information about aquifer transmissivity, storativity, and boundary conditions that can be extracted through appropriate analytical or numerical interpretation techniques [4] . Despite their fundamental importance, the spatial distribution of hydraulic properties across the Ogallala remains incompletely characterised. The Ogallala Formation consists predominantly of poorly consolidated sediments deposited during the late Miocene to early Pliocene epochs by eastward-flowing streams originating from the Rocky Mountain uplift [5] . The lithological composition is highly variable, ranging from coarse gravels and sands in palaeochannel deposits to fine-grained silts and clays in overbank and lacustrine facies. This depositional heterogeneity translates directly into spatial variability in hydraulic properties, making multi-site characterisation essential for representative parameter estimation [6] .
Previous pumping test investigations have yielded a wide range of hydraulic property estimates, reflecting both genuine spatial variability and differences in testing and interpretation methodologies [1,7] . Many earlier tests used simplified analytical methods that may not adequately account for partial penetration, wellbore storage, and heterogeneity effects. Recent advances in pumping test analysis, including diagnostic derivative plots and typecurve matching with sophisticated models, offer potential for more refined estimation [8] . This research aimed to apply modern techniques to newly acquired data from twelve sites, providing updated estimates and improved understanding of spatial variability.
Research Area Description
The research area encompasses a portion of the southern Ogallala aquifer in the Texas Panhandle, covering approximately 12,000 km². The terrain is flat to gently undulating, with elevations ranging from 900 to 1,200 m above sea level. Annual precipitation averages 400-500 mm, concentrated during May-September, while potential evapotranspiration exceeds 1,500 mm per year. The shallow water table lies at 15-60 m depth, and saturated thickness ranges from 10 to 95 m across the area. Underlying the Ogallala are relatively impermeable Permian and Triassic red beds that form the effective aquifer base [5] . A dense network of irrigation wells extracts groundwater primarily for centre-pivot irrigation of cotton, maize, and sorghum.
Materials and Methods
Materials and Methods
Materials
Twelve pumping test sites were selected based on geographic distribution, lithological facies representation, equipment accessibility, and observation well availability. At each site, detailed lithological logs were compiled from drill cuttings and geophysical well logs to characterise the stratigraphic setting and identify screened intervals. Water levels in the pumping wells and one to three observation wells at distances of 25-500 m were monitored using pressure transducers recording at one-second intervals during the first ten minutes and at one to five-minute intervals thereafter. All transducers were calibrated against manual water level measurements before and after each test [3, 9] .
Methods
Constant-rate tests were performed at 15-85 L/s for 24-72 hours.
Step-drawdown tests of four to six steps preceded each constant-rate test. The Theis [10] solution was employed for confined responses, the Cooper-Jacob [11] straight-line approximation for late-time data, and the Neuman [12] solution for unconfined behaviour with delayed gravity drainage. Diagnostic derivative analysis following Bourdet et al. [8] identified flow regimes and boundary effects. Well losses were quantified using the Jacob [4] step-drawdown method. Nonlinear regression curve matching was performed using AQTESOLV software with automated parameter optimisation.
Lithofacies Control on Hydraulic Conductivity
Lateral variations in hydraulic conductivity were examined by correlating transmissivity estimates with lithofacies codes assigned from geophysical well logs. Wells screened predominantly in coarse-grained palaeochannel facies yielded hydraulic conductivities averaging 18.4 m/day, while wells in fine-grained overbank and lacustrine facies averaged 4.2 m/day a contrast exceeding four-fold that underscores the strong depositional control on aquifer performance and the need for facies-resolved parameterisation in flow models [6] . Figure 1 shows a strong positive correlation between transmissivity and saturated thickness (R² = 0.94), consistent with relatively uniform hydraulic conductivity within similar facies while transmissivity scales with available saturated material. Well efficiency varied from 42% to 91% (Figure 2). The dashed line at 70% separates acceptable from poor performance. Wells below this threshold are candidates for rehabilitation through acidisation or mechanical redevelopment.
Results
Results
Comprehensive Interpretation
All five diagnostic tools-type-curve matching, straight-line analysis, derivative plots, step-drawdown interpretation, and lithofacies correlation-converged on a consistent characterisation. The bimodal storativity and derivative-identified boundaries confirm that parts of the Ogallala behave as a confined system beneath caliche, while other areas respond as unconfined aquifers.
Discussion
The transmissivity range of 125-2,480 m²/day is broadly consistent with earlier regional assessments [1,7] but provides substantially improved spatial resolution. The strong correlation between transmissivity and saturated thickness confirms that hydraulic conductivity remains relatively uniform within similar depositional facies, and that the dominant control on well productivity is saturated thickness. This finding has practical implications for well siting, as targeting palaeochannel deposits with maximum saturated thickness will yield the most productive wells [6] . The identification of boundary effects at five of twelve sites through derivative analysis has significant implications for groundwater model development. Conventional analytical solutions assume infinite aquifer extent, and failure to account for boundaries leads to biased parameter estimates [8] . The relatively low well efficiency at several sites suggests that rehabilitation programmes could reduce pumping costs by an estimated 15-25% [9] . Future research should extend this approach to additional sites and incorporate geostatistical methods to develop spatially distributed parameter fields for numerical modelling [13,14] .
Conclusion
This research provided a comprehensive characterisation of aquifer hydraulic properties within the Ogallala Formation based on modern pumping test analysis at twelve well sites. Transmissivity ranged from 125 to 2,480 m²/day, strongly controlled by depositional architecture. Storativity values reflect a transition from confined to unconfined conditions. Diagnostic derivative analysis proved invaluable for identifying boundary effects and selecting appropriate analytical models, highlighting the importance of moving beyond simple type-curve matching in heterogeneous systems. Well efficiency assessment identified several candidates for rehabilitation that could substantially improve extraction economics. The hydraulic property estimates presented here provide essential input data for sustainable groundwater management planning in the southern Ogallala region. Longer-duration tests and geostatistical interpolation would further strengthen the parameterisation of regional flow models that underpin allocation decisions for this critically important aquifer system.
Acknowledgement
Acknowledgements Funding Sources
Figures and tables from the paper
| Site | Sat. Thick. (m) | T (m²/day) | S | K (m/day) | Well Eff. (%) |
|---|---|---|---|---|---|
| S1 | 15 | 125 | 0.12 | 8.3 | 72 |
| S2 | 28 | 340 | 0.09 | 12.1 | 85 |
| S3 | 35 | 580 | 0.0004 | 16.6 | 91 |
| S4 | 42 | 720 | 0.07 | 17.1 | 65 |
| S5 | 48 | 890 | 0.002 | 18.5 | 42 |
| S6 | 55 | 1,100 | 0.08 | 20.0 | 78 |
| S7 | 62 | 1,450 | 0.0003 | 23.4 | 88 |
| S8 | 70 | 1,680 | 0.10 | 24.0 | 56 |
| S9 | 78 | 1,920 | 0.003 | 24.6 | 74 |
| S10 | 85 | 2,100 | 0.0005 | 24.7 | 68 |
| S11 | 88 | 2,300 | 0.15 | 26.1 | 82 |
| S12 | 92 | 2,480 | 0.11 | 27.0 | 61 |
Table text extracted from the original PDF; superscript letters are shown inline. The original table image is below.
View original table image
| Feature | Sites Affected | Interpretation |
|---|---|---|
| Late upward deviation | S2, S7, S10 | Impermeable lateral boundary |
| Late downward deviation | S4, S9 | Recharge or constant-head boundary |
| Early steep unit slope | S5, S8, S12 | Wellbore storage effects |
| Delayed yield inflection | S1, S3, S6, S11 | Unconfined delayed gravity drainage |
Table text extracted from the original PDF; superscript letters are shown inline. The original table image is below.
View original table image
References
15 in the original paper- Gutentag ED, Heimes FJ, Krothe NC, Luckey RR, Weeks JB. Geohydrology of the High Plains Aquifer. U.S. Geological Survey Professional Paper. 1984;1400B:1-63.
- McGuire VL. Water-level and recoverable water in storage changes, High Plains Aquifer, predevelopment to 2015. U.S. Geological Survey Scientific Investigations Report. 2017;2017-5040:1-14.
- Kruseman GP, de Ridder NA. Analysis and evaluation of pumping test data. Wageningen: International Institute for Land Reclamation and Improvement; 1990:1-377.
- Jacob CE. Drawdown test to determine effective radius of artesian well. Transactions of the American Society of Civil Engineers. 1947;112:1047-1070.
- Seni SJ. Sand-body geometry and depositional systems, Ogallala Formation, Texas. Bureau of Economic Geology Report of Investigations. 1980;105:1-36.
- Stovall JN. Groundwater modelling of the Ogallala Aquifer in the Texas Panhandle. Texas Water Development Board Report. 2001;357:1-88.
- Nativ R, Smith DA. Hydrogeology and geochemistry of the Ogallala aquifer, southern High Plains. Journal of Hydrology. 1987;91(3-4):217-253.
- Bourdet D, Ayoub JA, Pirard YM. Use of pressure derivative in well test interpretation. SPE Formation Evaluation. 1989;4(2):293-302.
- Driscoll FG. Groundwater and wells. St. Paul: Johnson Filtration Systems Inc.; 1986:1-1089.
- Theis CV. The relation between the lowering of the piezometric surface and the rate and duration of discharge. Transactions of the American Geophysical Union. 1935;16(2):519-524.
- Cooper HH, Jacob CE. A generalized graphical method for evaluating formation constants. Transactions of the American Geophysical Union. 1946;27(4):526-534.
- Neuman SP. Analysis of pumping test data from anisotropic unconfined aquifers. Water Resources Research. 1975;11(2):329-342.
- Isaaks EH, Srivastava RM. An introduction to applied geostatistics. New York: Oxford University Press; 1989:1-561.
- Walton WC. Groundwater resource evaluation. New York: McGraw-Hill; 1970:1-664.
- Fetter CW. Applied hydrogeology. Upper Saddle River: Prentice Hall; 2001:1-598.