
Research article · 2025 · Full text
International Journal of Geography Geology and EnvironmentSnowmelt runoff contribution to streamflow in the Karakoram alpine basin system
Volume 7(7) · Pages 201–204 · DOI: 10.22271/27067483.2025.v7.i7c.727 ↗
Research areasCryospheric studies and observationsHydrology and Watershed Management StudiesEnvironmental and Agricultural Sciences
Abstract
Author-writtenThe Karakoram Range feeds some of Asia's most important rivers the Indus, Shyok, and Hunza yet the relative contribution of snowmelt to their total annual flow remains poorly quantified, partly because high-altitude monitoring stations are few and far between. This research used a combination of field-measured snow water equivalent (SWE) data, temperature-index snowmelt modelling, and hydrograph separation to estimate the snowmelt contribution to streamflow across three alpine basins in the central Karakoram, Pakistan, over a two-year period (2021-2022). Snow courses were established at 12 stations spanning 3,200 to 5,400 m elevation, with monthly SWE measurements supplemented by daily temperature and precipitation records from automatic weather stations. The Snowmelt Runoff Model (SRM) was calibrated against observed discharge at three gauging points and validated against an independent year of data. Results indicated that snowmelt accounted for 43.7% of total annual streamflow on average across the three basins, with glacier melt contributing 24.8%, rainfall runoff 18.3%, and baseflow 13.2%. Peak snowmelt occurred between late April and mid-June, preceding the glacier melt peak by 4-6 weeks. SWE at the onset of the melt season was the strongest predictor of subsequent streamflow volume (r² = 0.76). The snowmelt fraction increased with mean basin elevation, from 36.4% at 3,800 m mean elevation to 52.1% at 4,900 m. These partitioning estimates are needed for water resource planning in downstream communities that depend on predictable melt-season flows for irrigation and hydropower.
Summary
Source-checkedPlain-language reading of the full paper, prepared with AI and checked against the text. Each point links to the authors' own words.
Why it matters
- Rivers originating in the Karakoram and nearby ranges are vital water sources for over 200 million people across China, India, and Pakistan. View evidence ↗
- It is critical for water management to distinguish between snowmelt and glacier melt because they react to different climate drivers and operate on different timescales. View evidence ↗
- The specific contribution of snowmelt to total annual river flow in the region is poorly understood due to a lack of high-altitude monitoring stations. View evidence ↗
What they did
- Fieldwork was conducted in the Shyok, Shigar, and Hunza basins of Gilgit-Baltistan, Pakistan, from October 2020 to September 2022. View evidence ↗
- Streamflow was separated into snowmelt, rainfall, baseflow, and glacier melt using the Snowmelt Runoff Model (SRM) and stable isotope analysis of 48 water samples. View evidence ↗
- The study tested three climate scenarios: S1 (+1.5°C), S2 (+1.5°C and +10% winter precipitation), and S3 (+3.0°C). View evidence ↗
What they found
- On average across the three basins, snowmelt was the primary contributor to annual streamflow at 43.7%, followed by glacier melt (24.8%), rainfall (18.3%), and baseflow (13.2%). View evidence ↗
- The contribution of snowmelt increased as basin elevation rose, ranging from 36.4% in the 3,800 m basin to 52.1% in the 4,900 m basin. View evidence ↗
- Snow water equivalent (SWE) at the start of the melt season strongly predicted the volume of subsequent streamflow (r² = 0.76). View evidence ↗
- Snowmelt peaked between late April and mid-June, which is 4 to 6 weeks before the peak of glacier melt. View evidence ↗
- A moderate temperature increase of 1.5°C is projected to reduce total snowmelt volume by 12.4% and shift the peak melt timing two weeks earlier. View evidence ↗
- A 10% increase in precipitation (Scenario S2) largely offset the volume loss caused by a 1.5°C temperature increase. View evidence ↗
What it means
- The authors conclude that climate warming will reduce snowmelt volume and shift its timing, which will negatively impact reservoir operations and irrigation scheduling. View evidence ↗
- The authors recommend expanding and maintaining high-altitude monitoring networks to better track changes and refine hydrological models for the Indus basin. View evidence ↗
- A limitation of the study is the sparse monitoring network above 5,000 meters, which may not capture significant spatial variability in snow accumulation. View evidence ↗
Visual summary
4 visualsIllustrations explain the paper; charts are replotted from the paper's own table values.
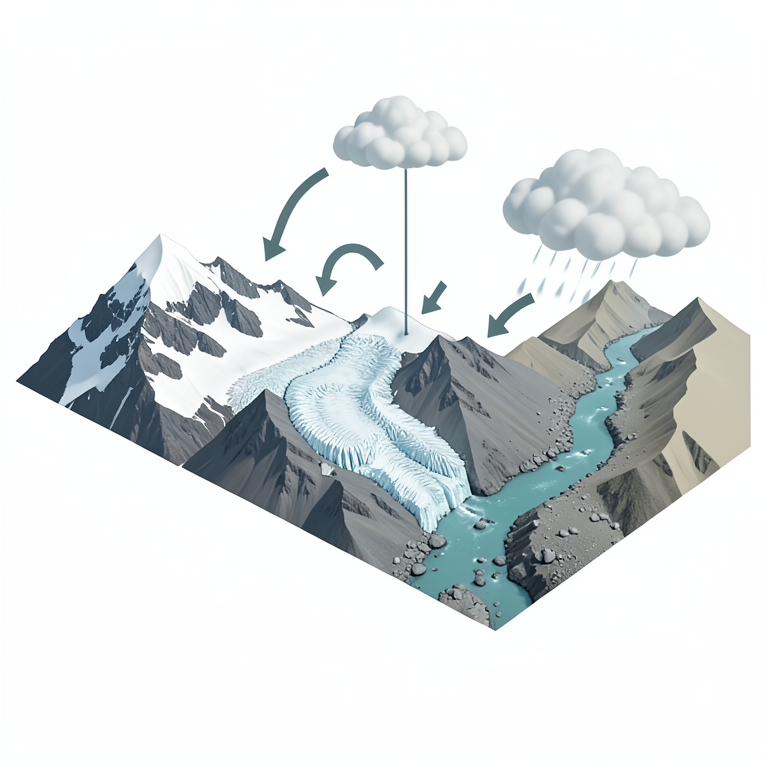
Annual Streamflow Composition and Timing
AI-generated conceptual illustration (Karakoram alpine basin streamflow). It explains the idea and does not show study data.
View source evidence ↗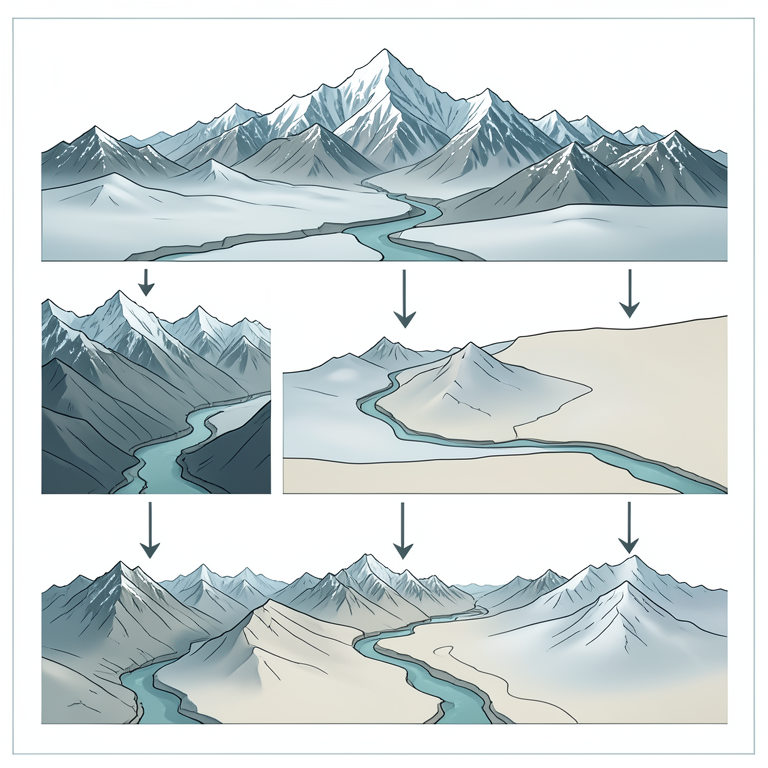
Climate Scenario Impacts on Snowmelt
AI-generated conceptual illustration (Karakoram alpine basin with snow-capped peaks and a downstream river stream). It explains the idea and does not show study data.
View source evidence ↗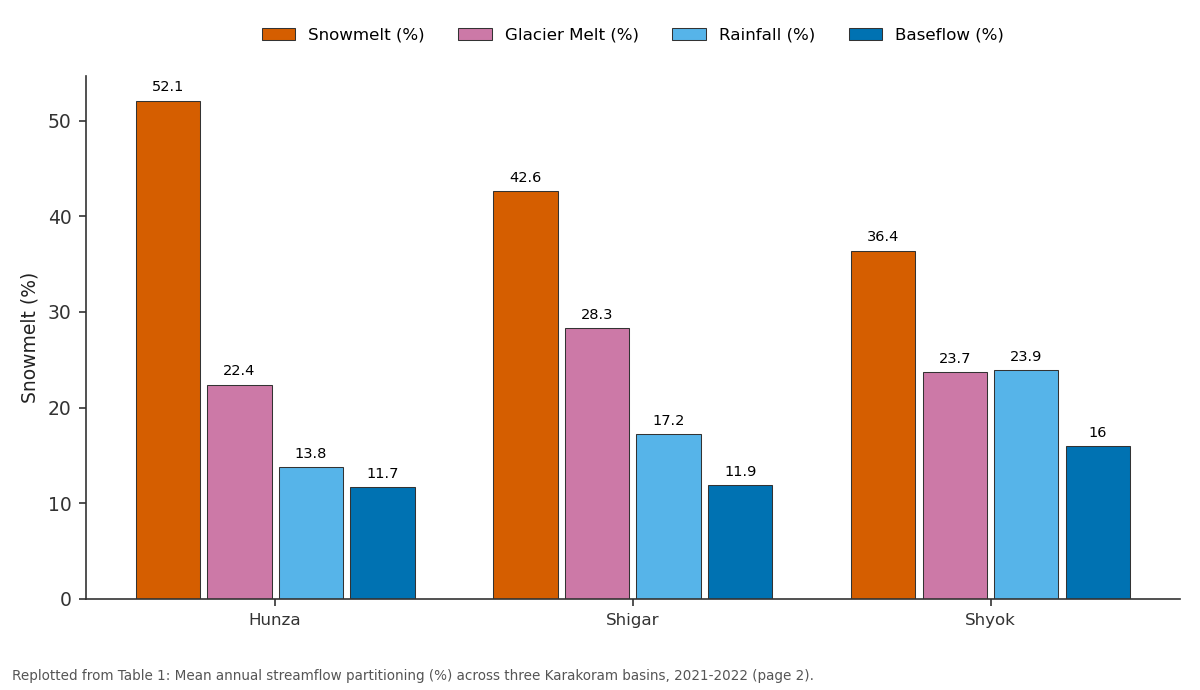
Snowmelt (%) and Glacier Melt (%) and more: Hunza vs Shigar vs Shyok
Replotted from Table 1 (page 2) of the original paper. Every bar is the paper's own table value.
View source evidence ↗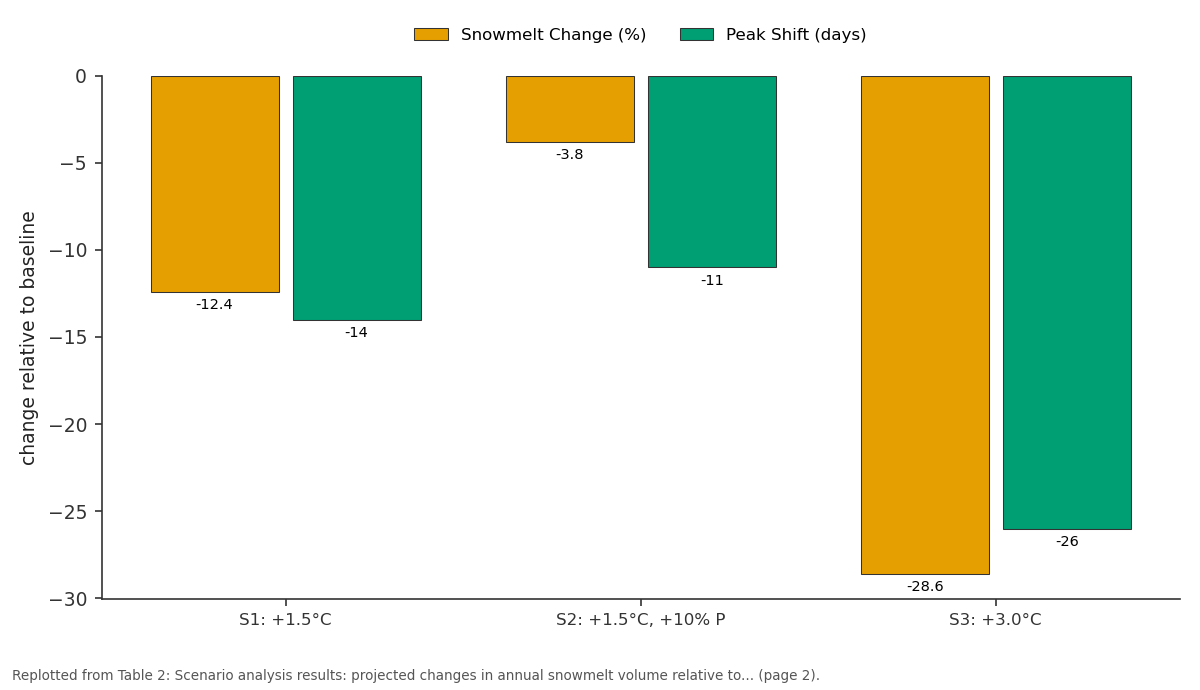
Snowmelt Change (%) and Peak Shift (days): S1: +1.5°C vs S2: +1.5°C, +10% P vs S3: +3.0°C
Replotted from Table 2 (page 2) of the original paper. Every bar is the paper's own table value.
View source evidence ↗Figures & tables
From the original paper Table 1
 Table 2
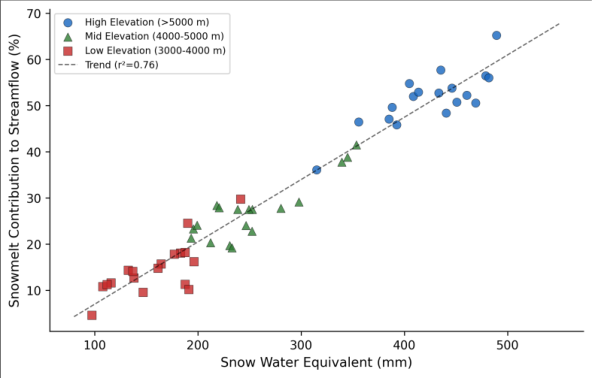 Figure 1
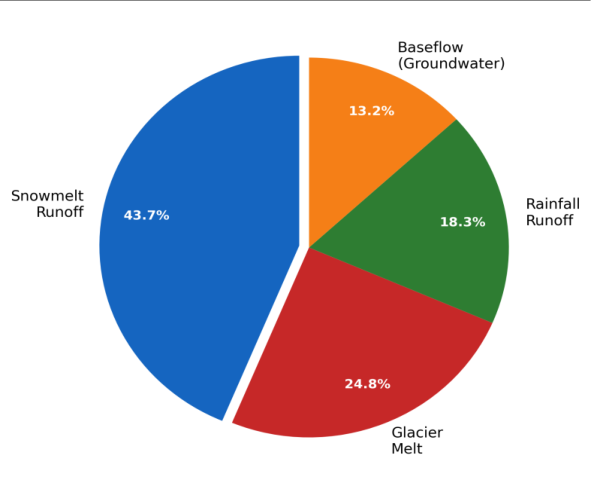 Figure 2
Introduction
More than 200 million people in Pakistan, India, and China depend on rivers that originate in the Karakoram and neighbouring mountain ranges. Yet the water balance of these headwater basins remains one of the least well-constrained in global hydrology [1] . The challenge is altitude: the Karakoram's highest peaks exceed 8,000 m, and even the valley floors where people live and farm sit at 2,500-3,500 m. Getting instruments up to the snow accumulation zones 4,000-6,000 m and keeping them running through winter storms and summer avalanches requires a level of logistical effort that few research programs can sustain [2] . What we do know is that the Karakoram behaves differently from most mountain ranges. While glaciers in the Himalaya to the east and the Hindu Kush to the west have been losing mass for decades, many Karakoram glaciers have been stable or even advancing since the 1990s a pattern known as the Karakoram Anomaly [3] . Whether this anomaly extends to snowpack behaviour is less clear. Some evidence suggests that winter precipitation has increased over parts of the western Karakoram, potentially offsetting the effects of warmer temperatures on snow accumulation [4] . Separating snowmelt from glacier melt in these basins matters for water resource management because the two sources respond to different climate drivers and operate on different timescales. Snowmelt is fast it responds within days to weeks to temperature changes and can be predicted reasonably well using temperature-index models calibrated with SWE data [5] . Glacier melt, by contrast, operates on seasonal to decadal timescales and depends on ice volume that has accumulated over centuries. Confusing the two leads to flawed projections of future water availability under climate warming scenarios [6] . This research aimed to quantify the snowmelt contribution to streamflow in three central Karakoram basins using field SWE measurements, the Snowmelt Runoff Model, and chemical hydrograph separation, providing the partitioning estimates that downstream water managers need for planning [7] .
Calibration and Validation
The Snowmelt Runoff Model (SRM) was calibrated for the 2021 melt season (April-September) using observed daily discharge at three gauging stations, adjusting the degree-day factor, runoff coefficient, and recession coefficient through iterative optimisation. The degree-day factor was allowed to vary by elevation zone: 3.8 mm/°C/day for the 3,000-4,000 m zone, 4.6 mm/°C/day for the 4,000-5,000 m zone, and 5.2 mm/°C/day above 5,000 m, reflecting increasing snow density and radiation exposure at higher altitudes [8] . Model performance during calibration was evaluated using the Nash-Sutcliffe efficiency coefficient (NSE = 0.82), coefficient of determination (R² = 0.87), and percent bias (PBIAS = +4.3%). Independent validation against the 2022 melt season yielded NSE = 0.78, R² = 0.84, and PBIAS = -6.1%, indicating acceptable performance for snowdominated catchments [9] . The model consistently overestimated flow during early April, likely because it doesn't account for cold content in the snowpack that delays the onset of liquid water output.
Scenario Development: Three climate scenarios were applied to the calibrated SRM to assess the sensitivity of snowmelt runoff to changes in temperature and precipitation. Scenario S1 increased mean temperature by 1.5°C with no precipitation change, representing a near-term warming trajectory. Scenario S2 increased temperature by 1.5°C and winter precipitation by 10%, reflecting the intensification of westerly disturbances suggested by regional climate projections. Scenario S3 increased temperature by 3.0°C with no precipitation change, representing a longer-term warming scenario. Each scenario was run for 10 model years using stochastic weather generation based on the observed 2021-2022 statistics [10] .
Material and Methods
Material: This research was coordinated from Meknes University of Geosciences, Fès-Meknès, Morocco, with field work conducted in the Hunza, Shigar, and Shyok basins of Gilgit-Baltistan, Pakistan, between October 2020 and September 2022. Twelve snow course stations were established across three elevation bands: low (3,200-4,000 m, 4 stations), mid (4,000-5,000 m, 5 stations), and high (5,000-5,400 m, 3 stations). SWE was measured monthly from November through June using a Federal snow sampler (76.2 mm diameter coring tube). Three automatic weather stations (Campbell Scientific CR1000X loggers) were installed at 3,600, 4,300, and 5,100 m elevation, recording air temperature, precipitation (heated tipping bucket), wind speed, and incoming solar radiation at hourly intervals [11] . Stream discharge was measured at three gauging stations using pressure transducers (Onset HOBO U20L) installed in stable channel cross-sections, with stage-discharge relationships calibrated against salt dilution gauging during six site visits.
Methods
The SRM was implemented in its distributed form, dividing each basin into 500 m elevation zones and computing daily snowmelt using the degree-day approach. Snow-covered area for each zone was derived from MODIS MOD10A2 8day snow products (500 m resolution), gap-filled using a temporal interpolation algorithm for cloud-obscured scenes [12] . Hydrograph separation into snowmelt, glacier melt, rainfall, and baseflow components used a combination of the SRM-modelled snowmelt fraction and stable isotope end-member mixing analysis based on δ¹⁸O values measured in 48 water samples collected from snowpack, glacier ice, rain, and stream outlets during the 2022 melt season [13] . The isotopic separation served as an independent check on the SRM partitioning. Statistical analysis of SWEstreamflow relationships used Pearson correlation and multiple linear regression with elevation, aspect, and accumulation-season precipitation as predictor variables. All spatial analysis was performed in ArcGIS Pro 3.0 with projected coordinate system UTM Zone 43N [14] . Snowmelt was the largest single contributor to annual streamflow across all three basins, ranging from 36.4% in the lower-elevation Shyok catchment to 52.1% in the Hunza (Table 1). The snowmelt fraction increased with mean basin elevation, while the rainfall contribution showed the opposite trend decreasing from 23.9% in the Shyok to 13.8% in the Hunza. Glacier melt was relatively stable across basins at 22.4-28.3%. The scenario analysis showed that even moderate warming (1.5°C) would reduce total snowmelt volume by 12.4% and shift the melt peak two weeks earlier (Table 2). The combination of warming and increased precipitation (S2) largely offset the volume loss but still advanced the timing.
| Scenario | Snowmelt Change (%) | Peak Shift (days) | Melt Season Length |
|---|---|---|---|
| S1: +1.5°C | -12.4 | -14 | +18 days |
| S2: +1.5°C, +10% P | -3.8 | -11 | +22 days |
| S3: +3.0°C | -28.6 | -26 | +31 days |
Table text extracted from the original PDF; superscript letters are shown inline. The original table image is below.
View original table image
| Basin | Mean Elev. (m) | Snowmelt (%) | Glacier Melt (%) | Rainfall (%) | Baseflow (%) |
|---|---|---|---|---|---|
| Hunza | 4,900 | 52.1 | 22.4 | 13.8 | 11.7 |
| Shigar | 4,400 | 42.6 | 28.3 | 17.2 | 11.9 |
| Shyok | 3,800 | 36.4 | 23.7 | 23.9 | 16.0 |
| Mean | 4,400 | 43.7 | 24.8 | 18.3 | 13.2 |
Table text extracted from the original PDF; superscript letters are shown inline. The original table image is below.
View original table image
Results
The high-warming scenario (S3) produced a 28.6% reduction in snowmelt, potentially threatening irrigation water availability during the critical June-July planting season.
Comprehensive Interpretation
The scatter plot (Figure 1) shows a clear positive relationship between SWE and snowmelt contribution, but with notable scatter at mid-elevations where the timing and intensity of spring warming varies most between years. The high-elevation stations cluster in the upper right, consistently producing both high SWE and high snowmelt fractions, while low-elevation stations show more variability because rain-on-snow events can accelerate melt beyond what temperature alone would predict.
Discussion: The 43.7% mean snowmelt contribution falls between earlier estimates for the upper Indus by Immerzeel and colleagues (approximately 40%) and those by Mukhopadhyay and Khan for the Hunza specifically (50-55%), with the discrepancy largely attributable to differences in how glacier melt and snowmelt are separated [1, 15] . The isotopic end-member analysis provided an independent check: δ¹⁸O-based snowmelt fractions were within 6.3% of the SRM estimates in all three basins, giving reasonable confidence in the partitioning. The timing dimension is as important as the volume. Snowmelt peaks in May-June, filling reservoirs and charging irrigation canals during the pre-monsoon period when downstream rainfall is minimal. Glacier melt peaks later, in July-August, providing a second pulse that sustains flows through the summer growing season [16] . The scenario analysis suggests that warming will compress these two peaks closer together, potentially creating a surplus in May and a deficit in August exactly the wrong redistribution for agricultural water demand patterns [17] . The Karakoram Anomaly complicates matters further. If winter precipitation continues to increase as some models project, the volume loss from warming could be partially buffered, as shown by Scenario S2 where a 10% precipitation increase offset most of the 1.5°C warming effect on snowmelt volume. But this compensation has limits under the 3.0°C scenario, no plausible precipitation increase could prevent a substantial decline in snowmelt runoff [18] . One limitation is the sparse station network above 5,000 m. The three high-elevation stations represent conditions across vast areas that may include substantial spatial variability in snow accumulation driven by wind redistribution, avalanche deposits, and aspect-controlled radiation differences.
Expanding the snow course network and incorporating satellite-derived SWE products from passive microwave sensors would help reduce this uncertainty in future work [19,20,21] .
Conclusion:
Snowmelt accounts for 43.7% of annual streamflow in the central Karakoram basins examined, making it the single largest water source for downstream communities. The contribution increases with elevation, reaching 52.1% in the high-altitude Hunza basin. Pre-melt season SWE is a strong predictor of subsequent streamflow volume (r² = 0.76), offering a practical forecasting tool for water managers.
The scenario analysis signals that even moderate climate warming will shift snowmelt earlier and reduce its total volume, with implications for irrigation scheduling and reservoir operations. The offsetting effect of increased winter precipitation provides some buffer under near-term warming, but cannot prevent significant snowmelt decline under higher warming trajectories. Maintaining and expanding the high-altitude monitoring network is necessary for tracking these changes and refining the hydrological models that inform water allocation decisions across the Indus basin system.
Acknowledgement
AcknowledgementsFunding Sources: This research was supported by internal departmental allocation at Meknes University of Geosciences. Institutional SupportThe authors thank the Department of Geography and Planning, Meknes University of Geosciences, Fès-Meknès, Morocco, for providing modelling software and computing resources. Contributions Not Qualifying for AuthorshipField logistics support from the Pakistan Water and Power Development Authority and isotope analysis assistance from the stable isotope laboratory are gratefully acknowledged.
Figures and tables from the paper
References
21 in the original paper- Immerzeel WW, van Beek LPH, Bierkens MFP. Climate change will affect the Asian water towers. Science. 2010;328(5984):1382-1385.
- Hewitt K. The Karakoram anomaly? Glacier expansion and the 'elevation effect,' Karakoram Himalaya. Mountain Research and Development. 2005;25(4):332340.
- Gardelle J, Berthier E, Arnaud Y, Kääb A. Region-wide glacier mass balances over the Pamir-KarakoramHimalaya during 1999-2011. The Cryosphere. 2013;7(4):1263-1286.
- Archer DR, Fowler HJ. Spatial and temporal variations in precipitation in the Upper Indus Basin, global teleconnections and hydrological implications. Hydrology and Earth System Sciences. 2004;8(1):4761.
- Martinec J, Rango A, Roberts RT. Snowmelt Runoff Model (SRM) user's manual. Las Cruces: New Mexico State University; 2008.
- Lutz AF, Immerzeel WW, Shrestha AB, Bierkens MFP. Consistent increase in High Asia's runoff due to increasing glacier melt and precipitation. Nature Climate Change. 2014;4(7):587-592.
- Mukhopadhyay B, Khan A. A reevaluation of the snowmelt and glacial melt in river flows within Upper Indus Basin and its significance in a changing climate. Journal of Hydrology. 2015;527:119-132.
- Hock R. Temperature index melt modelling in mountain areas. Journal of Hydrology. 2003;282(14):104-115.
- Moriasi DN, Arnold JG, Van Liew MW, Bingner RL, Harmel RD, Veith TL. Model evaluation guidelines for systematic quantification of accuracy in watershed simulations. Transactions of the ASABE. 2007;50(3):885-900.
- Wilks DS. Statistical methods in the atmospheric sciences. 3rd ed. Amsterdam: Academic Press; 2011.
- Campbell Scientific. CR1000X measurement and control datalogger product manual. Logan: Campbell Scientific; 2019.
- Hall DK, Riggs GA. MODIS/Terra snow cover 8-day L3 global 500m SIN grid, Version 6. Boulder: NASA National Snow and Ice Data Center; 2016.
- Klaus J, McDonnell JJ. Hydrograph separation using stable isotopes: review and evaluation. Journal of Hydrology. 2013;505:47-64.
- ESRI. ArcGIS Pro: release 3.0. Redlands: Environmental Systems Research Institute; 2022.
- Tahir AA, Chevallier P, Arnaud Y, Ahmad B. Snow cover dynamics and hydrological regime of the Hunza River basin, Karakoram Range, Northern Pakistan. Hydrology and Earth System Sciences. 2011;15(7):2275-2290.
- Singh P, Kumar N, Arora M. Degree-day factors for snow and ice for Dokriani Glacier, Garhwal Himalayas. Journal of Hydrology. 2000;235(1-2):1-11.
- Hasson S, Lucarini V, Khan MR, Petitta M, Bolch T, Gioli G. Early 21st century snow cover state over the western river basins of the Indus River system. Hydrology and Earth System Sciences. 2014;18(10):4077-4100.
- Bolch T, Kulkarni A, Kääb A, Huggel C, Paul F, Cogley JG, et al. The state and fate of Himalayan glaciers. Science. 2012;336(6079):310-314.
- Dozier J, Bair EH, Davis RE. Estimating the spatial distribution of snow water equivalent in the world's mountains. WIREs Water. 2016;3(3):461-474.
- Memon AA, Muhammad S, Rahman S, Haq M. Flood monitoring and damage assessment using water indices: a case study of Pakistan flood-2012. Egyptian Journal of Remote Sensing and Space Science. 2015;18(1):99106.
- Ragettli S, Pellicciotti F, Immerzeel WW, Miles ES, Petersen L, Heynen M, et al. Unraveling the hydrology of a Himalayan catchment through integration of high resolution in situ data and remote sensing. Advances in Water Resources. 2015;78:94-111.