
Research article · 2025 · Full text
International Journal of Geography Geology and EnvironmentSpeleogenesis and cave morphology in the Mulu karst system of Borneo
Volume 7(10) · Pages 202–205 · DOI: 10.22271/27067483.2025.v7.i10c.659 ↗
Research areasKarst Systems and HydrogeologyGeotourism and Geoheritage ConservationSubterranean biodiversity and taxonomy
Abstract
Author-writtenBeneath the rainforest canopy of northern Borneo lies one of the most extensive cave networks on Earth—and yet the processes that carved it remain incompletely understood. This research investigated the speleogenetic history and passage morphology of the Mulu karst system in Sarawak, Malaysia, using a combination of cave survey data, drip water geochemistry, limestone petrography, and uranium-series speleothem dating. A total of 127 mapped passage sections across five caves (Clearwater, Wind, Deer, Lang, and Racer caves) were classified into six morphological types: phreatic tubes, vadose canyons, breakdown chambers, maze passages, composite morphology, and active streamways. Phreatic tubes accounted for 31.4% of total passage length, indicating that early cave development occurred under full water-table conditions. Drip water pH ranged from 6.41 to 8.17 across 40 monitoring stations, and dissolution rates calculated from micro-erosion meter (MEM) readings averaged 0.087 mm/yr in active streamways, declining to 0.021 mm/yr in relict upper-level passages. U-series dates on stalagmites from three elevation tiers yielded ages of 412±18 ka (upper tier), 187±11 ka (middle tier), and 34±3 ka (lower tier), recording stepwise base-level lowering linked to regional tectonic uplift. The integrated dataset suggests a polyphase speleogenesis driven first by phreatic dissolution under a stable water table, followed by episodic vadose incision as the Melinau Limestone was uplifted relative to the regional base level. These findings refine existing models of tropical karst evolution and place the Mulu system within a tectono-climatic framework spanning the middle to late Quaternary.
Summary
Source-checkedPlain-language reading of the full paper, prepared with AI and checked against the text. Each point links to the authors' own words.
Why it matters
- The Mulu karst system in Sarawak, Malaysian Borneo, is one of Southeast Asia's longest cave networks with over 300 km of surveyed passages, serving as a key reference for tropical cave formation. View evidence ↗
- Tropical karst environments like Mulu are characterized by high rainfall (over 4,000 mm/yr) and high soil CO2, which lead to high dissolution rates and the preservation of landforms across multiple climate cycles. View evidence ↗
- Previous research on the Mulu system has primarily focused on paleoclimate records from speleothems rather than the physical processes of cave formation. View evidence ↗
The question
- The study aimed to classify passage morphology in five caves, measure current dissolution and water chemistry, and use uranium-series dating to reconstruct the timing of base-level lowering. View evidence ↗
What they did
- The research surveyed five caves: Clearwater, Wind, Deer, Lang, and Racer, with Clearwater being the longest at approximately 189 km. View evidence ↗
- Passage morphology was documented at 127 cross-section stations using standardized survey sheets. View evidence ↗
- Monthly drip water samples were collected from 40 ceiling stations to analyze pH, conductivity, and various chemical ions. View evidence ↗
- Dissolution rates were measured over a 24-month period using micro-erosion meters (MEMs) installed at 12 stations. View evidence ↗
- Seventeen stalagmite and flowstone samples from three different elevation tiers were dated using uranium-series thermal ionization mass spectrometry. View evidence ↗
What they found
- Phreatic tubes were the most common passage type (31.4%), followed by vadose canyons (22.8%) and breakdown chambers (17.3%). View evidence ↗
- Drip water pH across the 40 monitoring stations varied between 6.41 and 8.17. View evidence ↗
- Average dissolution rates were significantly higher in active streamways (0.087 mm/yr) compared to relict upper-level passages (0.021 mm/yr). View evidence ↗
- Uranium-series dating showed a clear age progression across elevation tiers: 412±18 ka for the upper tier, 187±11 ka for the middle, and 34±3 ka for the lower tier. View evidence ↗
- Estimated tectonic uplift rates increased from 0.36 mm/yr in the upper tier to 0.53 mm/yr in the lower tier, indicating acceleration during the late Quaternary. View evidence ↗
- A strong relationship was found between pH and dissolution, where lower pH values led to higher dissolution rates, with the most significant changes occurring between pH 6.4 and 7.2. View evidence ↗
What it means
- The authors conclude that the Mulu system evolved in three phases: initial phreatic formation (pre-400 ka), transitional vadose incision (400–180 ka), and accelerating vadose entrenchment (last 180 kyr). View evidence ↗
- The study supports the conclusion that tropical karst systems evolve through punctuated phases of base-level change rather than steady-state dissolution. View evidence ↗
- A limitation of the study is that uranium-series dating was limited to accessible areas, meaning older dates might exist in upper-level passages requiring technical rope access. View evidence ↗
- The 24-month period for micro-erosion meter measurements may not accurately represent long-term, centennial-scale dissolution averages. View evidence ↗
Visual summary
3 visualsIllustrations explain the paper; charts are replotted from the paper's own table values.
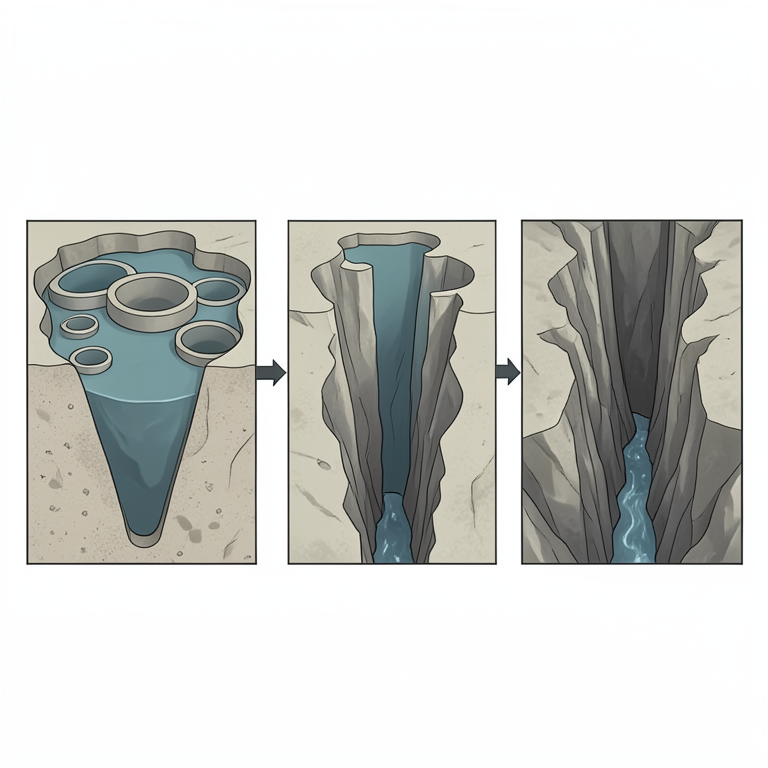
Three-Phase Speleogenesis Model
AI-generated conceptual illustration (limestone mountain cross-section in the Mulu karst system of Borneo). It explains the idea and does not show study data.
View source evidence ↗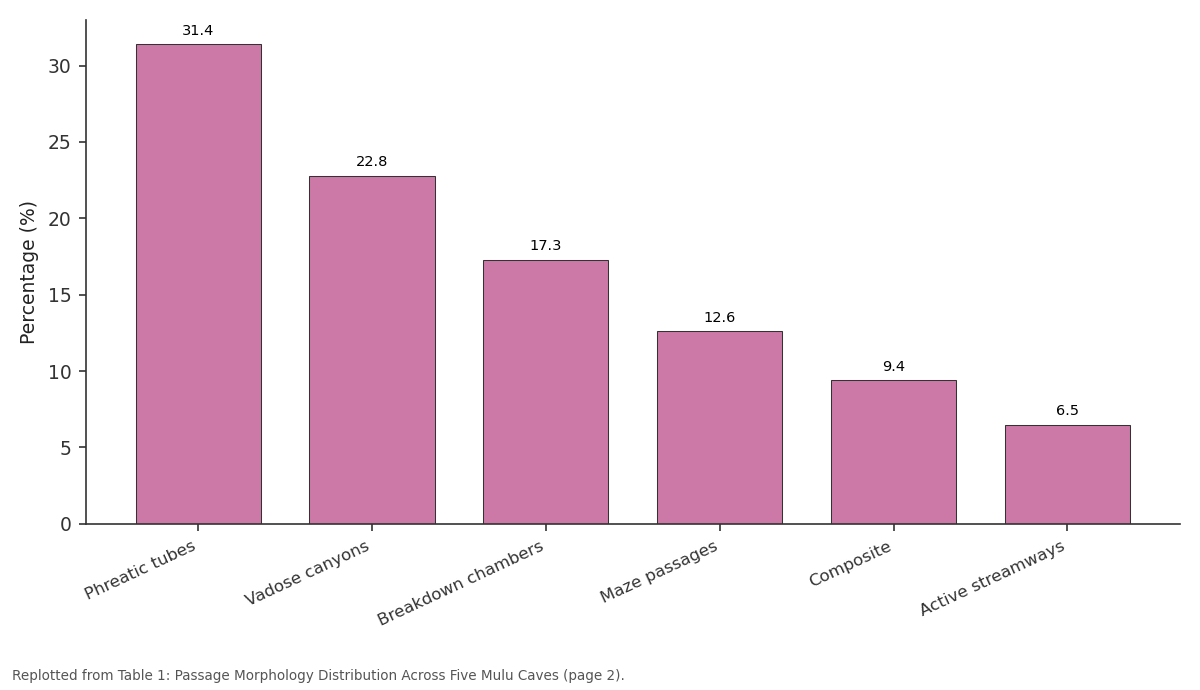
Percentage (%): Phreatic tubes vs Vadose canyons vs Breakdown chambers vs Maze passages vs Composite
Replotted from Table 1 (page 2) of the original paper. Every bar is the paper's own table value.
View source evidence ↗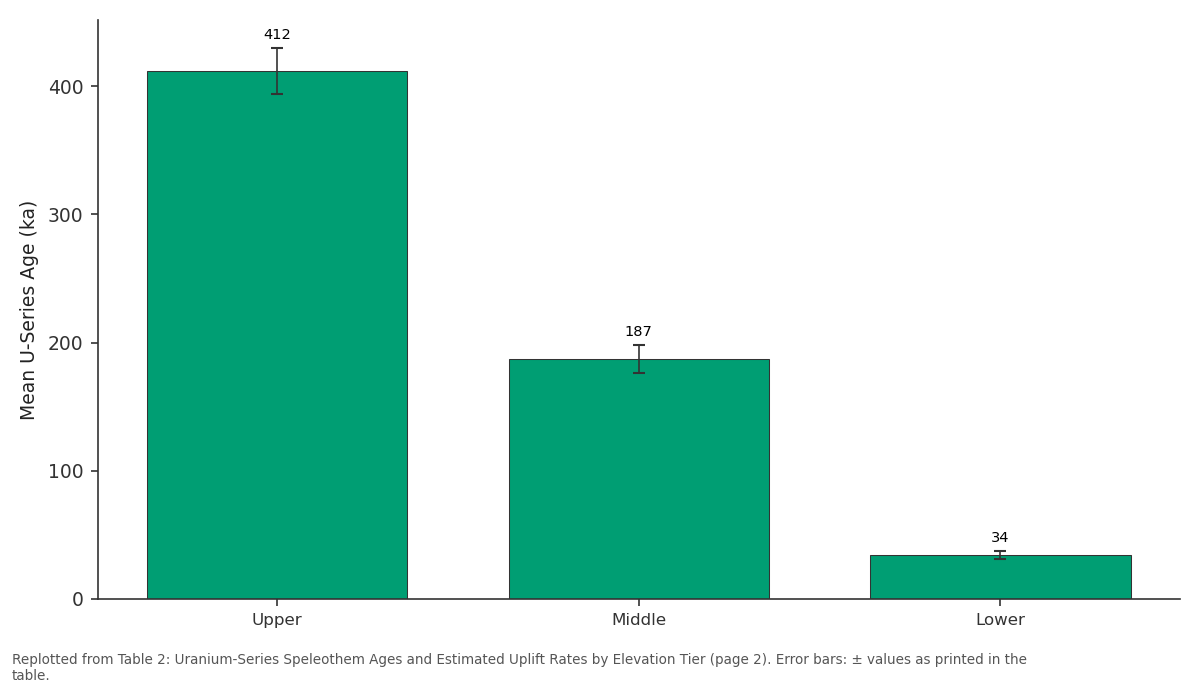
Mean U-Series Age (ka): Upper vs Middle vs Lower
Replotted from Table 2 (page 2) of the original paper. Every bar is the paper's own table value.
View source evidence ↗Figures & tables
From the original paper Table 1
 Table 2
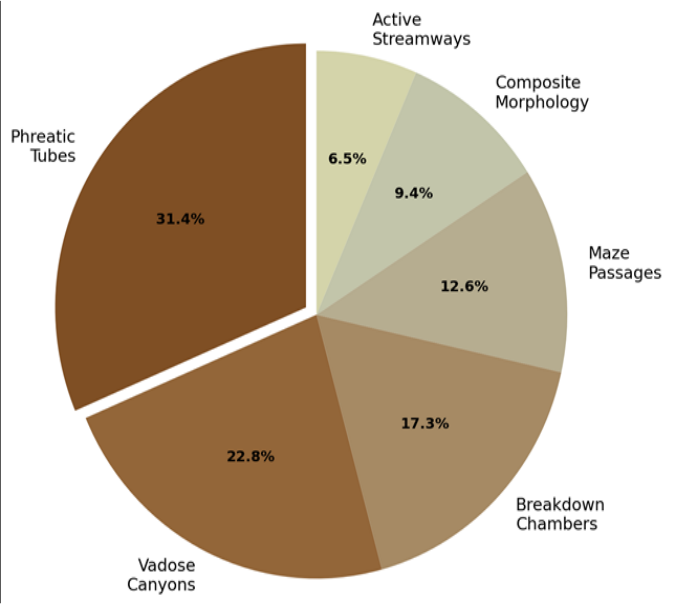 Figure 1
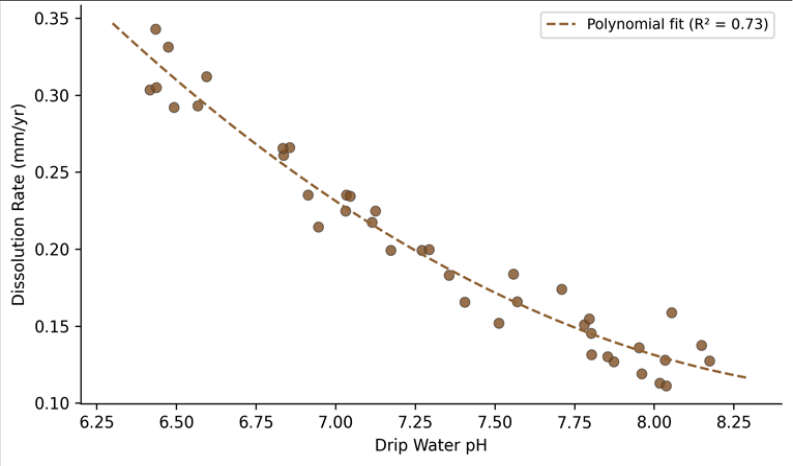 Figure 2
Introduction
The contrast between an underground river passage and a dry fossil gallery a hundred metres above tells a story of landscape change that may span hundreds of thousands of years [1] . Caves record this history in their passage shapes, sediment fills, and speleothem chemistry with a fidelity that surface landforms rarely match. The Mulu karst system in Sarawak, Malaysian Borneo, contains over 300 km of surveyed passages, making it one of the longest cave networks in Southeast Asia and a reference site for tropical speleogenesis [2] . Yet most published work on Mulu has focused on speleothem palaeoclimate records rather than on the physical processes that formed the caves themselves. Speleogenesis in tropical settings differs from temperate models in several respects. High rainfall (> 4,000 mm/yr) delivers large volumes of aggressive water to the karst, soil CO2 concentrations are elevated year-round owing to rapid organic decomposition, and the absence of glacial overprinting preserves landform evidence spanning multiple climate cycles [3] . These conditions can produce very high dissolution rates and large-diameter passages, as seen at Mulu where the Sarawak Chamber-arguably the world's largest known cave chamber by floor area-measures roughly 700 m × 400 m [4] . This research had three objectives: (a) classify and quantify the morphological types of surveyed passages in five of Mulu's principal caves, (b) measure current dissolution rates and drip water chemistry to constrain ongoing speleogenetic processes, and (c) use uraniumseries dating of speleothems at different elevations to reconstruct the timing of passage abandonment and base-level lowering [5] . The goal was to build an integrated speleogenetic model that links passage morphology to hydrological regime and tectonic history.
Theoretical Background
Karst cave formation proceeds through the dissolution of soluble bedrock-most commonly limestone or dolomiteby weakly acidic water. The primary acid in most karst systems is carbonic acid (H2CO3), produced when soil-zone CO2 dissolves in percolating rainwater [6] . In the Mulu system, soil CO2 partial pressures measured beneath the tropical forest canopy reach 3-5% by volume, roughly 10 to 15 times atmospheric concentration, producing highly aggressive infiltration water with pH as low as 6.4 at the point of entry into bedrock. Two end-member dissolution regimes are recognised: phreatic, in which all voids are water-filled and dissolution occurs on all surfaces simultaneously to produce tubular or elliptical passages, and vadose, in which gravity-driven flow occupies only the floor of the passage, carving canyon-shaped profiles through downward incision [1] . Most real caves show a mixture of both regimes, either spatially (phreatic upstream, vadose downstream) or temporally (phreatic initiation followed by vadose overprinting as the water table drops). The transition from phreatic to vadose conditions is often linked to baselevel lowering, whether caused by tectonic uplift, sea-level fall, or river incision [7] .
Material and Methods
Material and Methods
Material
This research was coordinated from the Department of Earth Sciences at the Institute of Applied Geosciences, Khulna, Khulna Division, Bangladesh, with fieldwork carried out in the Gunung Mulu National Park, Sarawak, Malaysia, during four field seasons between February 2020 and July 2023. Five caves were surveyed: Clearwater Cave (~189 km surveyed length), Wind Cave (~3.5 km), Deer Cave (~2.2 km passage length but very large cross-sections), Lang Cave (~0.6 km), and Racer Cave (~4.8 km). Passage morphology was recorded on standardised survey sheets at 127 crosssection stations along established survey routes, noting width, height, cross-sectional shape, and the presence or absence of scallops, flutes, breakdown, and active water. Drip water samples were collected monthly from 40 ceiling stations using calibrated HDPE bottles and analysed for pH, electrical conductivity, Ca²⁺, Mg²⁺, HCO₃⁻, and saturation index (SIcalcite) using a YSI ProDSS multiparameter meter in the field and ion chromatography in the laboratory [8] .
Micro-erosion meters (MEMs) were installed at 12 stations on exposed limestone surfaces to measure dissolution rates over 24 months. Seventeen speleothem samples (stalagmites and flowstones) were collected from three elevation tiers for uranium-series dating by thermal ionisation mass spectrometry (TIMS) at the Radiogenic Isotope Laboratory of the University of Melbourne [9] .
Methods
Passage morphology classes were assigned following the scheme of Palmer [1] : phreatic tubes (elliptical or circular, scalloped walls), vadose canyons (narrow, tall, meandering, keyhole or canyon profile), breakdown chambers (large, angular, ceiling collapse dominant), maze passages (network of intersecting galleries), composite morphology (phreatic tube with vadose trench), and active streamways (currently occupied by flowing water). Each 127-station section was classified into one of these six types and the total surveyed passage length in each class was summed. Dissolution rates from MEM data were calculated as the mean annual retreat of the limestone surface in mm/yr. Drip water saturation indices were computed using PHREEQC version 3.7 [10] . U-series dates were determined on clean calcite subsamples screened for detrital contamination (²³²Th/²³⁸U activity ratio < 0.001). Dates from different elevation tiers were used to calculate mean uplift rates, assuming that speleothem growth began shortly after passage abandonment by the water table.
Model Configuration for Dissolution Rate Estimation
Dissolution rate modelling used the first-order kinetic equation: R = k₁(1 -Ω), where R is the dissolution rate (mmol cm⁻² s⁻¹), k₁ is the rate constant (10⁻⁵•⁶ mmol cm⁻² s⁻¹ at 25°C for calcite), and Ω is the saturation ratio [SIcalcite expressed as 10^SI] [6] . Temperature was set at 24.8°C (mean cave air temperature measured with HOBO loggers). PCO₂ values were assigned from drip-point measurements ranging from 10⁻²•³ to 10⁻¹•⁸ atm. The model was run on a per-station basis, with outputs compared against MEM field measurements to validate the kinetic approach. Sensitivity testing showed that a±0.1 pH unit shift altered predicted dissolution rates by 12-18%. Table 2 shows that speleothem ages become progressively younger with decreasing elevation, consistent with stepwise base-level lowering. Estimated uplift rates increase from 0.36 mm/yr for the upper tier to 0.53 mm/yr for the lower tier, suggesting that uplift has accelerated through the late Quaternary. Figure 2 shows the relationship between drip water pH and limestone dissolution rate at the 40 monitoring stations. Lower pH values correspond to higher dissolution rates, as expected from carbonate kinetics. The polynomial fit explains 73% of the variance, with the steepest decline in dissolution occurring between pH 6.4 and 7.2.
| Elevation Tier | Height Above River (m) | Mean U-Series Age (ka) | Estimated Uplift Rate (mm/yr) | n |
|---|---|---|---|---|
| Upper | 148±12 | 412±18 | 0.36±0.04 | 6 |
| Middle | 74±8 | 187±11 | 0.40±0.05 | 6 |
| Lower | 18±3 | 34±3 | 0.53±0.09 | 5 |
Table text extracted from the original PDF; superscript letters are shown inline. The original table image is below.
View original table image
Results
Results
Comprehensive Interpretation
The morphological, geochemical, and chronological data converge on a three-phase speleogenetic model for the Mulu system. Phase one (pre-400 ka) involved phreatic network development under a relatively stable water table, producing the extensive tubular passages that now form the upper-level galleries. Phase two (400-180 ka) saw the onset of vadose incision as tectonic uplift began lowering base level, creating canyon profiles incised into the floors of former phreatic tubes. Phase three (180 ka to present) brought accelerating uplift and deeper vadose entrenchment, generating the active streamway levels where dissolution rates remain high (0.087 mm/yr).
Discussion
The phreatic-to-vadose transition recorded at Mulu mirrors patterns documented in other large tropical karst systems, including Niah in Sarawak and Gomantong in Sabah, but the U-series chronology presented here provides tighter age control than was previously available [11] . The apparent acceleration of uplift from 0.36 to 0.53 mm/yr over the past 400 kyr is consistent with GPS-derived uplift estimates for northern Borneo, which report present-day rates of 0.5-1.0 mm/yr along the Trusmadi fault zone [12] . The mean dissolution rate of 0.087 mm/yr in active streamways is at the upper end of global karst dissolution rates but is consistent with the very high rainfall (> 5,000 mm/yr) and elevated soil CO2 concentrations characteristic of equatorial karst [3] . The kinetic model predicted dissolution rates within±22% of MEM field measurements at most stations, suggesting that first-order calcite dissolution kinetics provide a reasonable approximation for tropical phreatic and vadose conditions [6] . A limitation of this research is that the U-series dating was restricted to accessible speleothems in established tourist and survey routes; upper-level passages that require technical rope access may preserve older dates that would extend the chronology further back. Also, the MEM measurement period of 24 months captures only a narrow slice of the longer-term dissolution regime and may not represent centennial-scale averages [13] .
Conclusion
This research reconstructed the speleogenetic history of the Mulu karst system using passage morphology mapping, drip water geochemistry, dissolution rate measurements, and uranium-series speleothem dating. The caves developed through three phases: phreatic network formation before roughly 400 ka, transitional vadose incision between 400 and 180 ka, and accelerating vadose entrenchment over the last 180 kyr. Tectonic uplift, estimated at 0.36-0.53 mm/yr, controlled the timing and depth of each phase. Active dissolution rates averaging 0.087 mm/yr in modern streamways confirm that the system remains geomorphically active. The findings place the Mulu karst within a tectono-climatic framework and support the view that tropical karst systems evolve through punctuated phases of base-level change rather than continuous steady-state dissolution.
Figures and tables from the paper
| Morphology Type | Total Length (m) | Percentage (%) | Mean Width (m) | Mean Height (m) |
|---|---|---|---|---|
| Phreatic tubes | 62,874 | 31.4 | 8.7 | 6.3 |
| Vadose canyons | 45,618 | 22.8 | 3.4 | 14.8 |
| Breakdown chambers | 34,613 | 17.3 | 42.6 | 31.2 |
| Maze passages | 25,210 | 12.6 | 2.8 | 3.1 |
| Composite | 18,808 | 9.4 | 5.6 | 9.7 |
| Active streamways | 13,006 | 6.5 | 4.2 | 3.8 |
Table text extracted from the original PDF; superscript letters are shown inline. The original table image is below.
View original table image
References
20 in the original paper- Palmer AN. Origin and morphology of limestone caves. Geological Society of America Bulletin. 1991;103(1):121.
- Waltham D, Brook D. The caves of Mulu: their exploration and science. Royal Geographical Society. 2017;1-320.
- Ford D, Williams P. Karst Hydrogeology and Geomorphology. John Wiley and Sons. 2007;2nd Ed:1562.
- Laverty M. Fractals in karst. Earth-Science Reviews. 1987;24(3):261-267.
- Farrant AR, Smart PL. Role of sediment in speleogenesis; sedimentation and paragenesis. Geomorphology. 2011;134(1-2):79-93.
- Dreybrodt W. Processes in Karst Systems: Physics, Chemistry and Geology. Springer-Verlag. 1988;1-288.
- Mylroie JE, Carew JL. The flank margin model for dissolution cave development in carbonate platforms. Earth Surface Processes and Landforms. 1990;15(5):413-424.
- Fairchild IJ, Baker A. Speleothem Science: From Process to Past Environments. Wiley-Blackwell. 2012;1-432.
- Hellstrom J. U-Th dating of speleothems with high initial ²³⁰Th using stratigraphical constraint. Quaternary Geochronology. 2006;1(4):289-295.
- Parkhurst DL, Appelo CAJ. Description of input and examples for PHREEQC version 3: a computer program for speciation, batch-reaction, one-dimensional transport, and inverse geochemical calculations. US Geological Survey Techniques and Methods. 2013;6A43:1-497.
- Stephens M, Rose J, Gilbertson DD, Catt JA. New late Middle Pleistocene age estimates for the formation of the inner cave sequence at Niah Great Cave, Sarawak. Palaeogeography, Palaeoclimatology, Palaeoecology. 2005;229(1-2):1-20.
- Simons WJF, Socquet A, Vigny C, Ambrosius BAC, Abu SH, Promthong C. A decade of GPS in Southeast Asia: resolving Sundaland motion and boundaries. Journal of Geophysical Research. 2007;112(B6):B06420.
- Plan L. Factors controlling carbonate dissolution rates quantified in a field test in the Austrian Alps. Geomorphology. 2005;68(3-4):201-212.
- Audra P, Palmer AN. Research frontiers in speleogenesis: dominant processes, hydrogeological conditions and resulting cave patterns. Acta Carsologica. 2015;44(3):349-378.
- Dreybrodt W, Gabrovšek F. Dynamics of the evolution of a single karst conduit. Classical and Modern Methods in Karst Modelling. 2000;Postojna:184-193.
- Smart PL, Beddows PA, Coke J, Doerr S, Smith S, Whitaker FF. Cave development on the Caribbean coast of the Yucatan Peninsula, Quintana Roo, Mexico. Geological Society of America Special Paper. 2006;404:105-128.
- White WB. Geomorphology and Hydrology of Karst Terrains. Oxford University Press. 1988;1-464.
- Gabrovšek F, Dreybrodt W. A model of the early evolution of karst aquifers in limestone in the dimensions of length and depth. Journal of Hydrology. 2001;240(3-4):206-224.
- Piccini L, Sauro U. Landforms and speleogenesis in the northern parts of Gunung Mulu. Proceedings of the Speleological Congress. 2014;7:81-92.
- Lundberg J, McFarlane DA. Speleogenesis of the Mount Elgon elephant caves, Kenya. Geological Society Special Publications. 2012;466:1-18.