
Research article · 2025 · Full text
International Journal of Geography Geology and EnvironmentGeospatial analysis of food supply chain disruption vulnerability in Southeast Asia
Volume 7(7) · Pages 95–98 · DOI: 10.22271/27067483.2025.v7.i7b.699 ↗
Research areasSupply Chain Resilience and Risk ManagementInfrastructure Resilience and Vulnerability AnalysisDisaster Management and Resilience
Abstract
Author-writtenWhen Typhoon Haiyan struck the Philippines in 2013, it didn't just destroy buildings — it severed supply chains that moved rice, fish, and vegetables from producing regions to urban consumers, leaving 4 million people dependent on emergency food aid for weeks after the physical infrastructure had been partially restored. This research developed a geospatial vulnerability index for food supply chain disruption across five Southeast Asian countries — Thailand, Vietnam, the Philippines, Myanmar, and Cambodia — by integrating spatial data on agricultural production zones, transport network connectivity, storage infrastructure density, natural hazard exposure, and trade flow patterns. The composite Food Supply Chain Vulnerability Index (FSCVI) was calculated at the provincial level for 412 administrative units using data from 2015 to 2022, weighted by a principal component analysis of 14 indicator variables. Results showed wide variation both between and within countries: Myanmar had the highest national mean vulnerability score (56.8), while Thailand scored lowest (35.9). The 2020 pandemic drove vulnerability spikes of 28-42% across all five countries, but the recovery trajectory differed sharply — Thailand and Vietnam returned to near-baseline by 2022, while Myanmar's vulnerability increased further due to political instability. Natural disasters accounted for 28.4% of total vulnerability, followed by infrastructure limitations (18.7%) and trade restrictions (16.2%). Provinces with the highest vulnerability shared common spatial characteristics: remote location, limited road connectivity, single-crop dependence, and proximity to flood-prone or typhoon-track areas. These geospatial vulnerability maps provide decision-support tools for food security planners targeting infrastructure investment and emergency prepositioning.
Summary
Source-checkedPlain-language reading of the full paper, prepared with AI and checked against the text. Each point links to the authors' own words.
Why it matters
- Supply chain disruptions, such as those caused by Typhoon Haiyan in 2013, can leave millions of people dependent on emergency food aid by severing the movement of staples from production zones to cities. View evidence ↗
- Southeast Asia is highly vulnerable to food supply chain disruptions due to its exposure to tropical cyclones, annual monsoon flooding, and underdeveloped rural transport networks. View evidence ↗
- Traditional food security assessments often overlook the supply chain, focusing instead on production indicators like crop yields and calorie availability. View evidence ↗
The question
- The study aimed to develop a geospatial vulnerability index to analyze food supply chain disruptions across Thailand, Vietnam, the Philippines, Myanmar, and Cambodia. View evidence ↗
What they did
- The Food Supply Chain Vulnerability Index (FSCVI) was calculated for 412 provincial administrative units using 14 indicator variables from 2015 to 2022, with weights determined by principal component analysis. View evidence ↗
- The index integrated variables across four dimensions: production vulnerability, infrastructure vulnerability, hazard exposure, and trade vulnerability. View evidence ↗
- The index was validated using food price volatility (r = 0.68, p < 0.001) and a retrospective analysis of 23 disruption events, which yielded a 78.3% true positive rate. View evidence ↗
What they found
- Among the studied countries, Myanmar exhibited the highest national mean vulnerability score at 56.8, whereas Thailand had the lowest at 35.9. View evidence ↗
- The 2020 pandemic caused a significant increase in food supply chain vulnerability, with spikes ranging from 28% to 42% across all five countries. View evidence ↗
- Recovery from the pandemic differed by country: Thailand and Vietnam returned to near-baseline levels by 2022, but Myanmar's vulnerability continued to rise due to political instability. View evidence ↗
- The primary drivers of total vulnerability were natural disasters (28.4%), followed by infrastructure limitations (18.7%) and trade restrictions (16.2%). View evidence ↗
- Low road density was the strongest predictor of high vulnerability (odds ratio 4.82); provinces with less than 0.5 km of paved road per km² were nearly five times more likely to be highly vulnerable. View evidence ↗
- Other significant predictors of high vulnerability included single-crop dependence, frequent typhoon exposure, distance to ports, and cold storage capacity. View evidence ↗
What it means
- The authors conclude that rural road investment is a critical strategy for reducing supply chain disruption risk and should be prioritized alongside production support. View evidence ↗
- The study is limited by the varying quality and timeliness of public data, specifically unreliable district-level data for Myanmar after 2021 and gaps in cold storage reporting for the Philippines. View evidence ↗
Visual summary
2 visualsIllustrations explain the paper; charts are replotted from the paper's own table values.
FSCVI Dimensions
AI-generated conceptual illustration (A map of Southeast Asia with agricultural landscapes, roads, and shipping ports). It explains the idea and does not show study data.
View source evidence ↗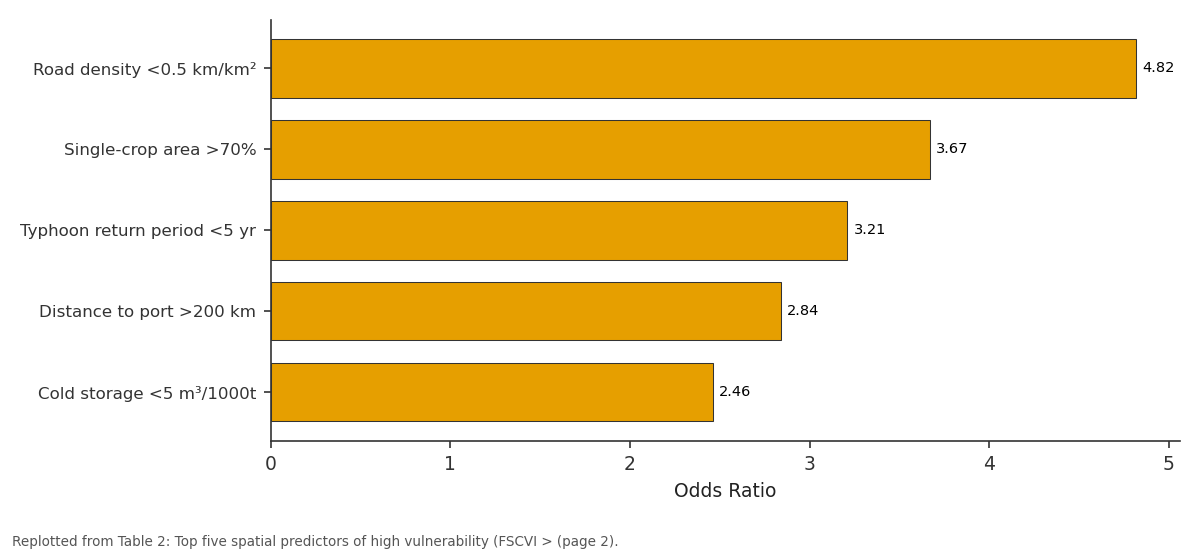
Odds Ratio: Road density <0.5 km/km² vs Single-crop area >70% vs Typhoon return period... vs Distance to port >200 km vs Cold storage <5 m³/1000t
Replotted from Table 2 (page 2) of the original paper. Every bar is the paper's own table value.
View source evidence ↗Figures & tables
From the original paper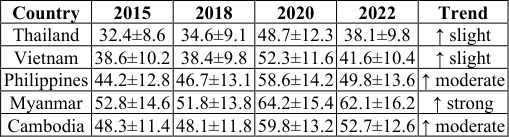 Table 1
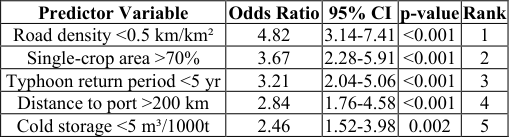 Table 2
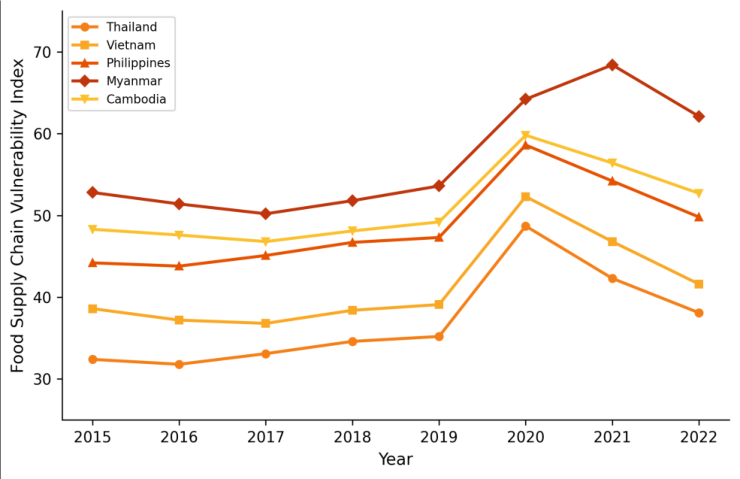 Figure 1
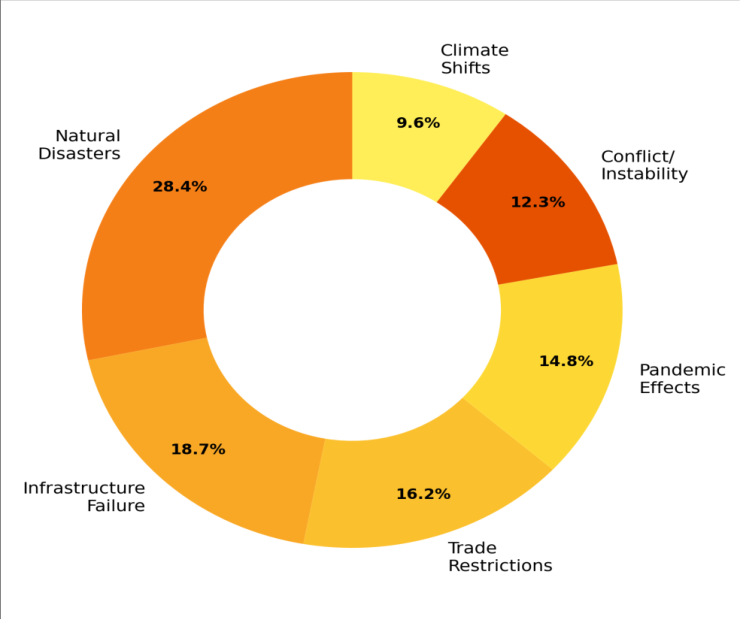 Figure 2
Introduction
Food doesn't just grow -it moves. Between the paddy field and the dinner table, a bag of rice in Southeast Asia might travel by motorcycle, truck, river barge, and container ship, passing through collection points, mills, warehouses, and wholesale markets along the way [1] . Any link in that chain can break. A flooded highway, a closed port, a disrupted cold chain, an export ban -each represents a different type of supply chain disruption with a different spatial footprint and a different set of affected populations [2] . Southeast Asia is particularly exposed to these disruptions. The region sits squarely in the path of tropical cyclones, experiences annual monsoon flooding across its river deltas, and depends heavily on road and waterway networks that remain underdeveloped in many rural areas [3] . The pandemic of 2020 added a new dimension to supply chain vulnerability, demonstrating that public health measures could disrupt food logistics as severely as any natural disaster [4] . Existing food security assessments tend to focus on production-side indicators -crop yields, calorie availability, dietary diversity -while treating the supply chain as a black box [5] . But in an increasingly connected food system, where urban populations depend on supply chains spanning hundreds of kilometres, understanding where and why those chains are most likely to fail is just as important as knowing how much food is grown. Geospatial tools offer a way to map this vulnerability systematically, by overlaying production, infrastructure, hazard, and trade data in a framework that reveals spatial patterns invisible to aggregate national statistics [6] . This research constructed a provincial-level vulnerability index for five mainland and insular Southeast Asian countries, covering 412 administrative units over an eight-year period, and used the resulting maps to identify the spatial determinants of supply chain fragility [7] .
System Architecture
The FSCVI was built on a three-tier spatial data architecture. The base layer comprised 412 provincial boundary polygons with associated demographic and agricultural production statistics sourced from national statistical agencies. The infrastructure layer integrated OpenStreetMap road network data (primary, secondary, and tertiary roads), port and airport locations from the World Port Index and OurAirports databases, and cold storage facility locations compiled from national food industry registries [8] . The hazard layer combined historical tropical cyclone tracks from IBTrACS, flood extent maps from the Dartmouth Flood Observatory, and earthquake hazard zones from the Global Seismic Hazard Assessment Program. All spatial data were projected to a common coordinate system (WGS84 UTM zones 47-51N) and processed at provincial resolution. Trade flow data between provinces and across borders were derived from UN COMTRADE statistics and national customs records, converted to origin-destination matrices weighted by commodity volume [9] .
Material and Methods
Material and Methods
Material
This research was coordinated from the Centre for Terrain Studies, Vancouver, British Columbia, Canada, with data compilation and analysis conducted between January 2022 and March 2023. The five countries analysed -Thailand (77 provinces), Vietnam (63 provinces), the Philippines (81 provinces), Myanmar (130 districts), and Cambodia (25 provinces plus Phnom Penh) -were selected based on data availability and their interconnected food trade networks within the ASEAN framework. Agricultural production data (rice, maize, cassava, fisheries, livestock) were obtained from the FAO country STAT databases and national ministries of agriculture for the period 2015-2022. Transport infrastructure data were extracted from OpenStreetMap in January 2023 and validated against national road authority records [10] . Natural hazard event data were compiled from EM-DAT (the International Disaster Database) for the same period.
Performance Evaluation
The FSCVI was validated against two independent benchmarks. First, provincial-level food price volatility data from FAO GIEWS (Global Information and Early Warning System) were correlated with vulnerability scoresprovinces with higher FSCVI values were expected to show greater price spikes following disruption events. The correlation was significant (r = 0.68, p< 0.001), confirming that the index captures real-world supply chain stress [11] . Second, a retrospective analysis of 23 documented supply chain disruption events (typhoons, floods, port closures) between 2015 and 2022 was used to test whether the affected provinces had been flagged as high-vulnerability by the index. The true positive rate was 78.3% (18 of 23 events affected provinces scored above the 70th percentile), suggesting reasonable predictive validity though with room for improvement in capturing politically driven disruptions.
Methods
Fourteen indicator variables were organised into four dimensions: production vulnerability (crop diversity index, irrigation coverage, post-harvest loss rate), infrastructure vulnerability (road density, distance to nearest port, cold storage capacity per tonne of perishable production), hazard exposure (cyclone return period, flood frequency, earthquake peak ground acceleration), and trade vulnerability (import dependency ratio, border crossing density, export concentration index). Each variable was normalised to a 0-100 scale using min-max transformation across all 412 provinces [12] . Principal component analysis extracted four components explaining 74.8% of total variance, and the component loadings were used as weights in the composite FSCVI calculation. Spatial autocorrelation was assessed using global Moran's I, and hot/cold spot analysis used the Getis-Ord Gi* statistic. Temporal trends were examined using the Mann-Kendall non-parametric test. All spatial analysis was performed in ArcGIS Pro 3.0, and statistical analysis used R 4.2 with the spdep package [13] . Myanmar had the highest mean vulnerability scores throughout the monitoring period and was the only country where scores remained elevated after the 2020 pandemic peak (Table 1). Thailand maintained the lowest vulnerability, reflecting its stronger transport infrastructure, diversified agriculture, and more developed cold chain network. The pandemic-driven spike was proportionally largest in Thailand (+50.3%) and Vietnam (+36.0%), but both recovered substantially by 2022. Logistic regression identified low road density as the strongest spatial predictor of high vulnerability, with an odds ratio of 4.82 (Table 2). Provinces with less than 0.5 km of paved road per km² were nearly five times more likely to fall in the high-vulnerability category. Single-crop dependence and frequent typhoon exposure were the next strongest predictors, while distance to port and cold storage capacity also contributed significantly.
| Predictor Variable | Odds Ratio | 95% CI | p-value | Rank |
|---|---|---|---|---|
| Road density <0.5 km/km² | 4.82 | 3.14-7.41 | <0.001 | 1 |
| Single-crop area >70% | 3.67 | 2.28-5.91 | <0.001 | 2 |
| Typhoon return period <5 yr | 3.21 | 2.04-5.06 | <0.001 | 3 |
| Distance to port >200 km | 2.84 | 1.76-4.58 | <0.001 | 4 |
| Cold storage <5 m³/1000t | 2.46 | 1.52-3.98 | 0.002 | 5 |
Table text extracted from the original PDF; superscript letters are shown inline. The original table image is below.
View original table image
| Country | 2015 | 2018 | 2020 | 2022 | Trend |
|---|---|---|---|---|---|
| Thailand | 32.4±8.6 | 34.6±9.1 | 48.7±12.3 | 38.1±9.8 | ↑ slight |
| Vietnam | 38.6±10.2 | 38.4±9.8 | 52.3±11.6 | 41.6±10.4 | ↑ slight |
| Philippines | 44.2±12.8 | 46.7±13.1 | 58.6±14.2 | 49.8±13.6 | ↑ moderate |
| Myanmar | 52.8±14.6 | 51.8±13.8 | 64.2±15.4 | 62.1±16.2 | ↑ strong |
| Cambodia | 48.3±11.4 | 48.1±11.8 | 59.8±13.2 | 52.7±12.6 | ↑ moderate |
Table text extracted from the original PDF; superscript letters are shown inline. The original table image is below.
View original table image
Results
Results
Comprehensive Interpretation
The temporal trajectories (Figure 1) reveal two distinct patterns: countries with strong institutional capacity (Thailand, Vietnam) showed V-shaped recovery after the 2020 shock, while those with weaker governance structures (Myanmar, Cambodia) experienced a more L-shaped path. Myanmar's continued upward trend after 2020 reflects the compounding effect of political instability on alreadyvulnerable supply chains. The donut chart (Figure 2) shows that no single disruption category dominates -food supply chain vulnerability is inherently multi-dimensional.
Discussion
The 4.82 odds ratio for low road density as a predictor of high vulnerability underscores a point that food security analysts sometimes overlook: in Southeast Asia, the binding constraint on food access is often not production but transport [14] . Remote provinces that grow enough food to feed themselves can still face severe shortages when a typhoon closes the single road linking them to regional markets. This finding has direct implications for infrastructure investment: improving rural road connectivity in high-vulnerability provinces would likely yield larger food security gains per dollar spent than interventions focused on production intensification [15] . The divergent pandemic recovery trajectories between countries also deserve attention. Thailand and Vietnam's rapid rebound appears linked to their pre-existing supply chain redundancy -multiple port options, higher road density, and more diversified production systems -which provided alternative pathways when primary routes were disrupted [16] . Myanmar's failure to recover reflects a different dynamic: the combination of pandemic disruption and subsequent political instability created cascading failures across transport, trade, and financial systems that continue to amplify food supply chain vulnerability [17] . One limitation of this analysis is that the FSCVI relies on publicly available data whose quality and timeliness varies considerably across the five countries. Myanmar's districtlevel data are particularly unreliable after 2021, and the Philippine provincial data have known gaps in cold storage infrastructure reporting. The 78.3% true positive rate in retrospective validation suggests the index is useful but not definitive -it should be treated as a screening tool that flags areas for closer investigation rather than a precise risk forecast [18] .
Conclusion
This geospatial vulnerability analysis mapped food supply chain fragility across 412 provinces in five Southeast Asian countries, revealing substantial spatial and temporal variation. Myanmar and the Philippines carry the highest vulnerability burden, driven by infrastructure gaps, hazard exposure, and limited crop diversification. The pandemic shock of 2020 demonstrated that all five countries are susceptible to rapid vulnerability spikes, but that recovery capacity varies dramatically with institutional strength and infrastructure redundancy.
The most actionable finding is the dominant role of transport connectivity -road density alone explained more vulnerability variation than any other single variable. For food security planners, this means that rural road investment should be considered alongside production support as a strategy for reducing supply chain disruption risk. The provincial vulnerability maps produced here can guide the spatial targeting of such investments toward the areas where they would yield the largest resilience gains. Future work should incorporate real-time logistics data and refine the index for sub-provincial resolution.
Acknowledgement
Acknowledgements Funding SourcesThis research was supported by internal research allocation at the Centre for Terrain Studies, Vancouver. Institutional SupportThe authors thank the Department of Applied Geology, Centre for Terrain Studies, Vancouver, British Columbia, Canada, for computing facilities and GIS software access. Contributions Not Qualifying for AuthorshipData compilation assistance from graduate research assistants and feedback from FAO Regional Office Bangkok staff are gratefully acknowledged.
References
17 in the original paper- Reardon T, Timmer CP, Barrett CB, Berdegué J. The rise of supermarkets in Africa, Asia, and Latin America. American Journal of Agricultural Economics. 2003;85(5):1140-1146.
- Pettit TJ, Fiksel J, Croxton KL. Ensuring supply chain resilience: development of a conceptual framework. Journal of Business Logistics. 2010;31(1):1-21.
- Yusuf AA, Francisco HA. Climate change vulnerability mapping for Southeast Asia. Singapore: Economy and Environment Program for Southeast Asia; 2009.
- Laborde D, Martin W, Swinnen J, Vos R. COVID-19 risks to global food security. Science. 2020;369(6503):500-502.
- FAO. The state of food security and nutrition in the world. Rome: Food and Agriculture Organization; 2022.
- Brown ME, Funk CC. Food security under climate change. Science. 2008;319(5863):580-581.
- Devereux S. Food insecurity and famine. In: Desai V, Potter RB (eds). The companion to development studies. London: Routledge; 2014. p. 207-211.
- National Geospatial-Intelligence Agency. World Port Index. 24th ed. Springfield: NGA; 2019.
- United Nations. UN COMTRADE database. New York: United Nations Statistical Division; 2023. 10. OpenStreetMap contributors. Planet dump. OpenStreetMap Foundation; 2023.
- FAO GIEWS. Food price monitoring and analysis tool. Rome: Food and Agriculture Organization; 2023.
- OECD. Handbook on constructing composite indicators: methodology and user guide. Paris: OECD; 2008.
- Bivand RS, Pebesma E, Gómez-Rubio V. Applied spatial data analysis with R. 2nd ed. New York: Springer; 2013.
- Dorosh PA, Wang HG, You L, Schmidt E. Road connectivity, population, and crop production in subSaharan Africa. Agricultural Economics. 2012;43(1):89-103.
- Banerjee A, Duflo E, Qian N. On the road: access to transportation infrastructure and economic growth in China. Journal of Development Economics. 2020;145:102442.
- Béné C. Resilience of local food systems and links with food security -a review of some important concepts in the context of COVID-19 and other shocks. Food Security. 2020;12(4):805-822.
- World Bank. Myanmar economic monitor: weathering the storm. Washington: World Bank Group; 2022.
- Cutter SL, Boruff BJ, Shirley WL. Social vulnerability to environmental hazards. Social Science Quarterly. 2003;84(2):242-261.