
Research article · 2025 · Full text
International Journal of Geography Geology and EnvironmentDetermination of recharge zones and groundwater flow paths using tracers in the Kalahari
Volume 7(7) · Pages 173–176 · DOI: 10.22271/27067483.2025.v7.i7c.716 ↗
Research areasGroundwater and Isotope GeochemistryGroundwater flow and contamination studiesKarst Systems and Hydrogeology
Abstract
Author-writtenGroundwater recharge in semi-arid environments like the Kalahari Basin remains one of the least well-constrained components of the regional water balance. This research used stable isotope tracers (δ¹⁸O and δ²H) alongside hydrochemical parameters to delineate recharge zones and map groundwater flow paths across a 4,200 km² section of the central Kalahari in Botswana. Samples were collected from 38 boreholes, 12 shallow hand-dug wells, and 24 rainfall events between February 2021 and January 2023. Four distinct recharge zones were identified based on isotopic signatures and electrical conductivity (EC) values. Zone A, covering 18.3% of the mapped area, showed active recharge with low EC (mean 387 μS/cm) and isotopic signatures close to the local meteoric water line. Zone D, a discharge area in the southeastern lowlands, exhibited high EC (mean 1,243 μS/cm) and enriched isotopic values. Tritium dating indicated mean residence times ranging from 8 to 47 years across the four zones. Flow path analysis revealed two dominant recharge corridors linked to ephemeral pan systems that funnel infiltration during episodic rainfall events. These findings offer a framework for sustainable groundwater extraction planning in the central Kalahari region.
Summary
Source-checkedPlain-language reading of the full paper, prepared with AI and checked against the text. Each point links to the authors' own words.
Why it matters
- Understanding groundwater recharge in semi-arid regions like the Kalahari Basin is critical but remains one of the most uncertain parts of the regional water balance. View evidence ↗
- Recharge is difficult to estimate because high potential evapotranspiration (over 2,000 mm) far exceeds the limited annual rainfall (under 450 mm). View evidence ↗
- Standard water balance methods are often inaccurate in these areas because they cannot differentiate between general soil infiltration and focused recharge through specific pathways like riverbeds or pans. View evidence ↗
The question
- The study aimed to map groundwater flow directions and identify recharge zones across a 4,200 km² area of central Botswana using isotopes, hydrochemistry, and tritium dating. View evidence ↗
What they did
- The researchers sampled 38 production boreholes (40-180 m deep), 12 shallow hand-dug wells (3-8 m deep), and 24 rainfall events. View evidence ↗
- Stable isotopes of oxygen and hydrogen were measured using wavelength-scanned cavity ring-down spectroscopy with high analytical precision. View evidence ↗
- Tritium activity, used for dating the water, was measured via electrolytic enrichment and liquid scintillation counting. View evidence ↗
- Recharge zones were classified using hierarchical cluster analysis based on electrical conductivity (EC), oxygen isotope deviation, and tritium content. View evidence ↗
What they found
- Deep boreholes showed minimal seasonal EC variation (less than 5%) compared to shallow wells (up to 28%), meaning the deep aquifer is buffered against short-term weather changes. View evidence ↗
- The study determined that groundwater generally flows from the northwest to the southeast, with some flow directed toward the Makgadikgadi depression. View evidence ↗
What it means
- The authors conclude that protecting identified recharge corridors from degradation is a priority for sustainable water management in central Botswana. View evidence ↗
- The authors recommend using the recharge zone map to guide borehole placement to prevent over-extraction in areas that rely on slow lateral water movement. View evidence ↗
- The authors state that future work should expand the tracer network across the wider basin and use noble gas tracers to improve residence time estimates. View evidence ↗
Visual summary
2 visualsIllustrations explain the paper; charts are replotted from the paper's own table values.
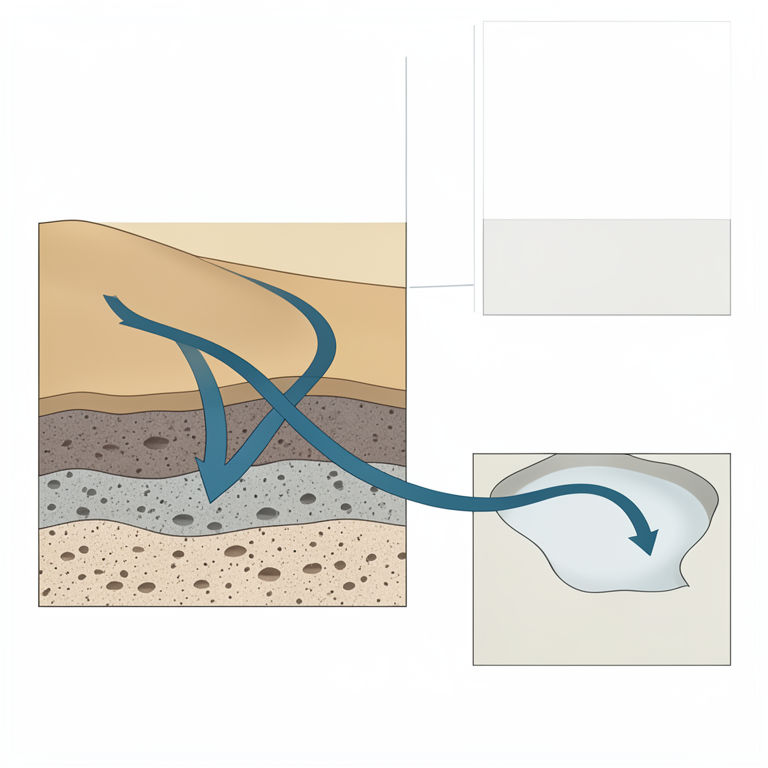
Groundwater Flow Path
AI-generated conceptual illustration (Kalahari desert sedimentary basin and groundwater aquifers). It explains the idea and does not show study data.
View source evidence ↗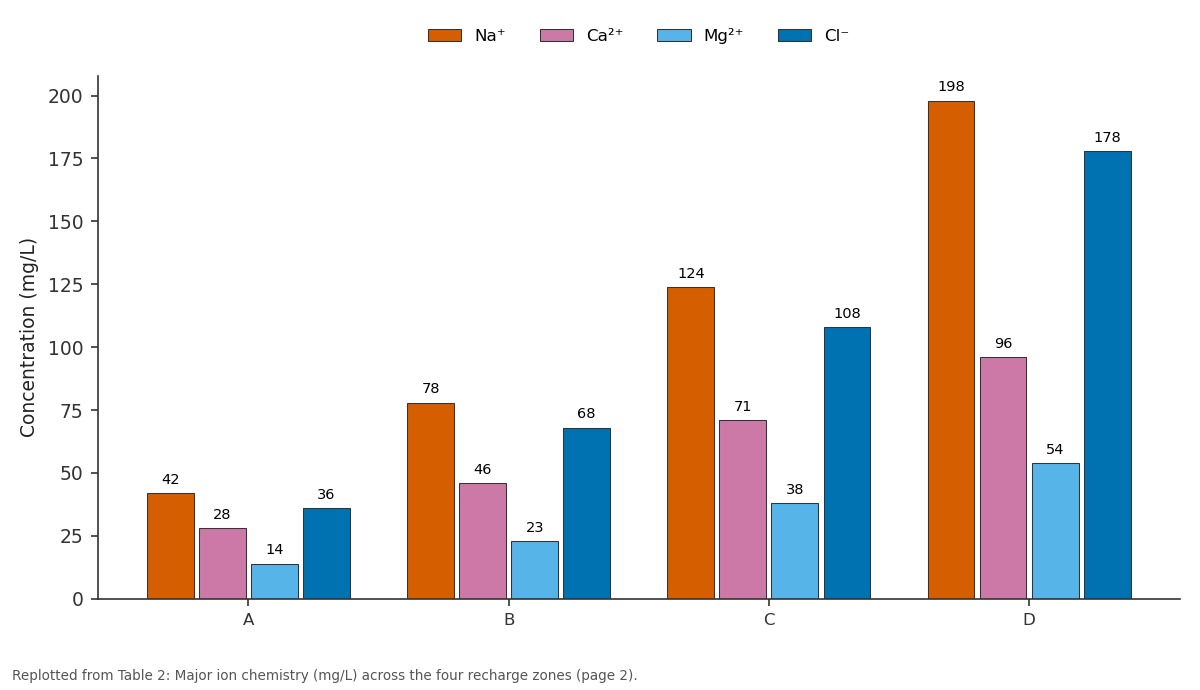
Na⁺ and Ca²⁺ and more: A vs B vs C vs D
Replotted from Table 2 (page 2) of the original paper. Every bar is the paper's own table value.
View source evidence ↗Figures & tables
From the original paper Table 1
 Table 2
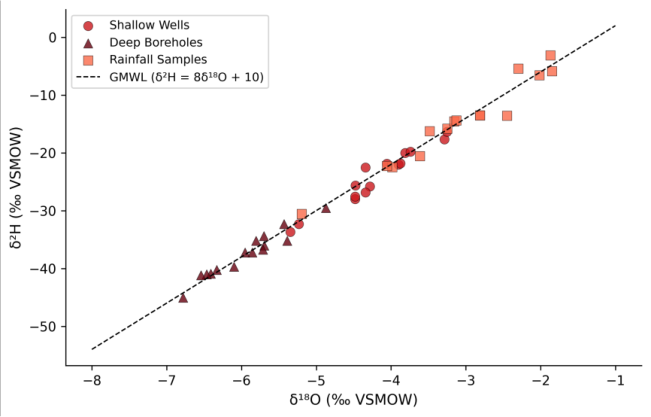 Figure 1
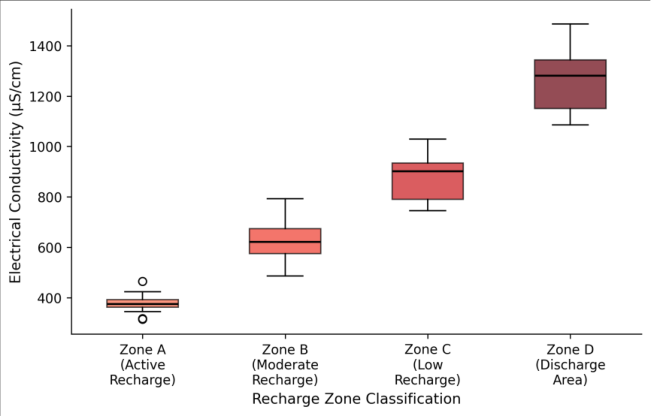 Figure 2
Introduction
The Kalahari is not a desert in the conventional sense it receives enough rainfall to support scattered tree cover and seasonal wetlands but its deep sandy soils and high evapotranspiration rates make recharge estimation extraordinarily difficult [1] . Across much of the basin, annual potential evapotranspiration exceeds 2,000 mm while rainfall struggles to reach 450 mm, leaving a slim margin for water to reach the water table [2] . And yet boreholes drilled into Kalahari sandstones and underlying formations do yield water, sometimes in surprising quantities, which means recharge is happening somewhere. Identifying where and how that recharge occurs has been a persistent challenge. Traditional water balance methods tend to produce wide uncertainty ranges when applied to semi-arid environments, partly because they cannot distinguish between diffuse recharge through the soil matrix and focused recharge through preferential pathways such as pans, riverbeds, and fracture systems [3] . Isotopic tracers offer a way around this problem. The stable isotopes of oxygen and hydrogen in water molecules act as natural tags, recording the conditions under which precipitation formed and the degree to which it was modified by evaporation before reaching the aquifer [4] . Previous isotopic work in the Kalahari has been concentrated in Namibia and the western portions of Botswana, leaving the central basin relatively under-sampled [5] . This research aimed to fill that gap by collecting groundwater and rainfall isotope data across a 4,200 km² area in central Botswana, combining isotopic evidence with hydrochemical parameters and tritium age estimates to delineate recharge zones and trace flow directions [6] .
Research Area Description
The mapped area is located in the Central District of Botswana, centred on coordinates 22°15'S, 24°30'E, and spans elevations from 940 to 1,080 m above sea level. The landscape is characterised by flat to gently undulating terrain covered with Kalahari sand deposits of variable thickness (5-80 m), underlain by Karoo-age sedimentary rocks and, at greater depth, Precambrian basement [7] . Annual rainfall averages 420 mm, concentrated between November and March, with high interannual variability (coefficient of variation 35%). Mean annual temperature is 22.6°C, and potential evapotranspiration exceeds 2,100 mm per year. The drainage network is ephemeral, with water flowing only after heavy rainfall events, feeding into a series of clay-floored pans that serve as local depressions where surface water collects temporarily [8] .
Material and Methods
Material and Methods
Material
This research was coordinated from the National Geological Institute of Warsaw, Poland, with field campaigns conducted in the Central District of Botswana between February 2021 and January 2023. Groundwater samples were collected from 38 production boreholes (depths 40-180 m) and 12 hand-dug wells (depths 3-8 m) distributed across the mapped area. Rainfall samples (n = 24) were collected using a modified IAEA-type collector at three stations positioned along a north-south transect. All water samples were filtered through 0.45 μm membranes in the field and stored in HDPE bottles with zero headspace. Temperature, pH, EC, and dissolved oxygen were measured in situ using a YSI Professional Plus multiparameter meter [9] . Tritium samples were collected in 1-litre glass bottles from 20 selected boreholes representing different aquifer depths and positions.
Seasonal Variations: Sampling was timed to capture both wet and dry season conditions. Wet season campaigns (February-March 2021 and 2022) coincided with peak rainfall, when episodic recharge events were most likely. Dry season campaigns (August 2021 and 2022) provided baseline conditions when water table levels had stabilised after the cessation of rainfall. EC values in shallow wells showed seasonal fluctuations of up to 28%, while deep boreholes varied by less than 5%, confirming that the deeper aquifer is hydraulically buffered against short-term climatic inputs [10] .
Methods: Stable isotope ratios (δ¹⁸O and δ²H) were measured by wavelength-scanned cavity ring-down spectroscopy (Picarro L2130-i) at the Warsaw Isotope Laboratory, with analytical precision of ±0.1‰ for δ¹⁸O and ±0.8‰ for δ²H. Tritium activity was determined by electrolytic enrichment followed by liquid scintillation counting at the same facility, with a detection limit of 0.3 TU. Hydrochemical analysis included major ions (Na⁺, K⁺, Ca²⁺, Mg²⁺, Cl⁻, SO₄²⁻, HCO₃⁻) measured by ion chromatography [11] . Recharge zone classification was based on a composite index incorporating EC, δ¹⁸O deviation from the local meteoric water line, and tritium content, using hierarchical cluster analysis in R 4.2. Groundwater flow directions were inferred from potentiometric surface maps interpolated from static water level measurements using ordinary kriging in ArcGIS Pro 3.0 [12] . Cluster analysis separated the 50 sampling points into four recharge zones with distinct hydrochemical and isotopic fingerprints (Table 1). Zone A, identified as the active recharge area, was concentrated around ephemeral pan systems in the northern portion of the mapped area, where sandy substrates and topographic depressions facilitate focused infiltration during heavy rainfall. Major ion concentrations increased progressively from Zone A to Zone D, consistent with longer water-rock interaction times along the flow path (Table 2). The Na⁺/Cl⁻ ratio shifted from 1.17 in Zone A to 1.11 in Zone D, suggesting a slight increase in halite dissolution contribution with distance from recharge areas.
| Zone | Na⁺ | Ca²⁺ | Mg²⁺ | Cl⁻ | SO₄²⁻ | HCO₃⁻ | TDS |
|---|---|---|---|---|---|---|---|
| A | 42 | 28 | 14 | 36 | 18 | 156 | 248 |
| B | 78 | 46 | 23 | 68 | 34 | 214 | 412 |
| C | 124 | 71 | 38 | 108 | 56 | 276 | 589 |
| D | 198 | 96 | 54 | 178 | 89 | 318 | 824 |
Table text extracted from the original PDF; superscript letters are shown inline. The original table image is below.
View original table image
| Zone | Area (%) | Mean EC (μS/cm) | Mean δ¹⁸O (‰) | Mean ³H (TU) | Residence Time (yr) |
|---|---|---|---|---|---|
| A | 18.3 | 387 | -5.6 | 3.8 | 8-15 |
| B | 31.7 | 624 | -4.9 | 2.1 | 15-28 |
| C | 33.2 | 893 | -4.1 | 0.8 | 28-42 |
| D | 16.8 | 1,243 | -3.4 | <0.3 | >47 |
Table text extracted from the original PDF; superscript letters are shown inline. The original table image is below.
View original table image
Results
Results
Comprehensive Interpretation
The isotopic scatter pattern (Figure 1) shows a clear evaporative trend among shallow well samples, plotting below and to the right of the Global Meteoric Water Line, which indicates that recharge water undergoes partial evaporation in the unsaturated zone before reaching the water table. Deep borehole samples cluster more tightly, reflecting longer residence times and mixing that dampens isotopic variability.
Discussion
The identification of focused recharge corridors associated with ephemeral pan systems aligns with findings from western Kalahari research, where de Vries and colleagues documented preferential infiltration beneath clay pans during high-intensity rainfall events [5] . The relatively young tritium ages in Zone A (8-15 years) confirm that active recharge is occurring on decadal timescales, even in this semi-arid setting, which contradicts earlier assumptions that modern recharge in the central Kalahari was negligible [13] . The progressive increase in EC and total dissolved solids from Zone A through Zone D traces a clear geochemical evolution along the flow path, driven by carbonate dissolution, cation exchange, and evaporative concentration. The hydrochemical gradient supports the potentiometric surface interpretation of a generally northwest-to-southeast flow direction, with a secondary component directed toward the Makgadikgadi depression in the east [14] . However, the tritium data also highlight the vulnerability of these recharge zones. Because active recharge is spatially concentrated in a relatively small portion of the mapped area (18.3%), any land use change such as overgrazing, pan modification, or borehole overextraction could disproportionately reduce aquifer replenishment.
Conclusion
This research delineated four groundwater recharge zones across a 4,200 km² section of the central Kalahari using stable isotope tracers, hydrochemical parameters, and tritium dating. Active recharge was found to be concentrated in 18.3% of the mapped area, primarily associated with ephemeral pan systems that enable focused infiltration during episodic high-intensity rainfall. Mean groundwater residence times ranged from 8 years in the active recharge zone to over 47 years in the southeastern discharge area.
For water resource managers in central Botswana, the practical message is that protecting recharge corridors from degradation should be a priority. Borehole siting guidelines could incorporate the recharge zone map to avoid overextraction in areas dependent on slow lateral flow. Future research should extend the tracer network to cover the broader Kalahari Basin and incorporate noble gas tracers to refine residence time estimates beyond the range accessible by tritium alone.
Acknowledgement
Acknowledgements Funding SourcesThis research received support from internal research allocation at the National Geological Institute of Warsaw. Institutional SupportThe authors thank the National Geological Institute of Warsaw, Masovia, Poland, for providing isotope laboratory access and analytical support.
Figures and tables from the paper
References
14 in the original paper- Thomas DSG, Shaw PA. The Kalahari environment. Cambridge: Cambridge University Press; 1991.
- Scanlon BR, Keese KE, Flint AL, Flint LE, Gaye CB, Edmunds WM, Simmers I. Global synthesis of groundwater recharge in semiarid and arid regions. Hydrological Processes. 2006;20(15):3335-3370.
- Healy RW. Estimating groundwater recharge. Cambridge: Cambridge University Press; 2010.
- Clark ID, Fritz P. Environmental isotopes in hydrogeology. Boca Raton: CRC Press; 1997.
- de Vries JJ, Selaolo ET, Beekman HE. Groundwater recharge in the Kalahari, with reference to paleohydrologic conditions. Journal of Hydrology. 2000;238(1-2):110-123.
- Stadler S, Osenbrück K, Knöller K, Suckow A, Sultenfuß J, Oster H, Himmelsbach T, Hötzl H. Understanding the origin and fate of nitrate in groundwater of semi-arid environments. Journal of Arid Environments. 2008;72(10):1830-1842.
- Key RM, Ayres N. The 1998 edition of the national geological map of Botswana. Journal of African Earth Sciences. 2000;30(3):427-451.
- Batisani N, Yarnal B. Rainfall variability and trends in semi-arid Botswana. Journal of Arid Environments. 2010;74(1):99-109.
- APHA. Standard methods for the examination of water and wastewater. 23rd ed. Washington: American Public Health Association; 2017.
- Kulongoski JT, Hilton DR. Applications of groundwater helium. In: Baskaran M (ed). Handbook of environmental isotope geochemistry. Berlin: Springer; 2011. p. 285-304.
- Appelo CAJ, Postma D. Geochemistry, groundwater and pollution. 2nd ed. Leiden: Balkema; 2005.
- Isaaks EH, Srivastava RM. An introduction to applied geostatistics. New York: Oxford University Press; 1989.
- Mazor E, Verhagen BT, Sellschop JPF, Jones MT, Robins NE, Hutton LG, Jennings CMH. Northern Kalahari groundwaters: hydrologic, isotopic and chemical studies at Orapa, Botswana. Journal of Hydrology. 1977;34(3-4):203-234.
- Lekula M, Lubczynski MW, Shemang EM, Verhoef W. Hydrogeological conceptual model of large and complex semi-arid groundwater systems. Physics and Chemistry of the Earth. 2018;106:47-62.