
Research article · 2025 · Full text
International Journal of Geography Geology and EnvironmentAssessing earthquake damage potential through site amplification mapping in Tehran
Volume 7(11) · Pages 101–104 · DOI: 10.22271/27067483.2025.v7.i11b.665 ↗
Research areasSeismic Performance and Analysisearthquake and tectonic studiesEarthquake and Disaster Impact Studies
Abstract
Author-writtenTehran, Iran’s capital with over 8.5 million residents, is situated in a high seismic hazard region associated with active thrust faults along the southern Alborz mountain margin. The potential for catastrophic earthquake damage is amplified by thick alluvial deposits beneath the city that significantly modify ground motion characteristics through site amplification effects. This research presents comprehensive site amplification mapping based on ambient vibration measurements at 380 locations, geotechnical borehole data from 145 sites, and active-source seismic surveys along 12 transects. The HVSR method was applied to determine fundamental site period and amplification factor at each point. Fundamental periods range from 0.15 s in northern districts underlain by thin alluvial cover to 2.8 s in southern districts where alluvial thickness exceeds 200 m. Amplification factors range from 1.5 to 8.2, with highest values concentrated along the alluvial margin rather than in the thickest deposits, reflecting the strong impedance contrast at the sediment-bedrock interface. Integration with building vulnerability data identifies the central and south-central districts as zones of greatest damage potential, where amplification factors of 5.8–8.2 combine with fundamental periods of 0.5–1.5 s that resonate with the dominant 3–10-storey reinforced concrete building stock. A scenario earthquake on the North Tehran Fault estimates 85,000 buildings at risk of moderate to severe damage.
Summary
Source-checkedPlain-language reading of the full paper, prepared with AI and checked against the text. Each point links to the authors' own words.
Why it matters
- Tehran is a high-risk seismic area with over 8.5 million residents, located near active thrust faults on the southern Alborz mountain margin. View evidence ↗
- Thick alluvial deposits under the city can increase the potential for catastrophic damage by modifying ground motion through site amplification. View evidence ↗
- Earlier microzonation attempts lacked the spatial resolution needed to identify local amplification anomalies caused by buried geological features. View evidence ↗
The question
- The study aims to create a detailed site amplification map and combine it with building vulnerability data to pinpoint areas with the highest earthquake damage potential. View evidence ↗
What they did
- Researchers recorded ambient vibrations at 380 locations across an approximate 1 km grid using broadband seismometers. View evidence ↗
- The Horizontal-to-Vertical Spectral Ratio (HVSR) technique was applied using SESAME guidelines, with recordings processed in 60-second windows. View evidence ↗
What they found
- Fundamental site periods varied from 0.15 s in the north (thin alluvium) to 2.8 s in the south (alluvium >200 m). View evidence ↗
- Amplification factors ranged from 1.5 to 8.2, with the highest values occurring at the alluvial margin instead of the thickest deposits. View evidence ↗
- The South-Central zone exhibited the highest mean amplification factor of 8.2, with site periods between 1.20 and 2.20 s. View evidence ↗
- Double-resonance conditions occur in central districts where 3–6 storey RC buildings (60% of stock) have natural periods (0.3–0.8 s) that overlap with site periods. View evidence ↗
- In a scenario earthquake on the North Tehran Fault, approximately 85,000 buildings are estimated to be at risk of moderate to severe damage. View evidence ↗
- The Central district is projected to be the most affected, with 32,400 buildings impacted and estimated casualties between 18,000 and 48,000. View evidence ↗
What it means
- The authors recommend urgent building code enforcement, structural retrofitting, and targeted emergency planning in high-risk zones. View evidence ↗
- Future research needs to expand the measurement network to eastern and western suburban areas and implement real-time monitoring to validate HVSR estimates. View evidence ↗
Visual summary
3 visualsIllustrations explain the paper; charts are replotted from the paper's own table values.
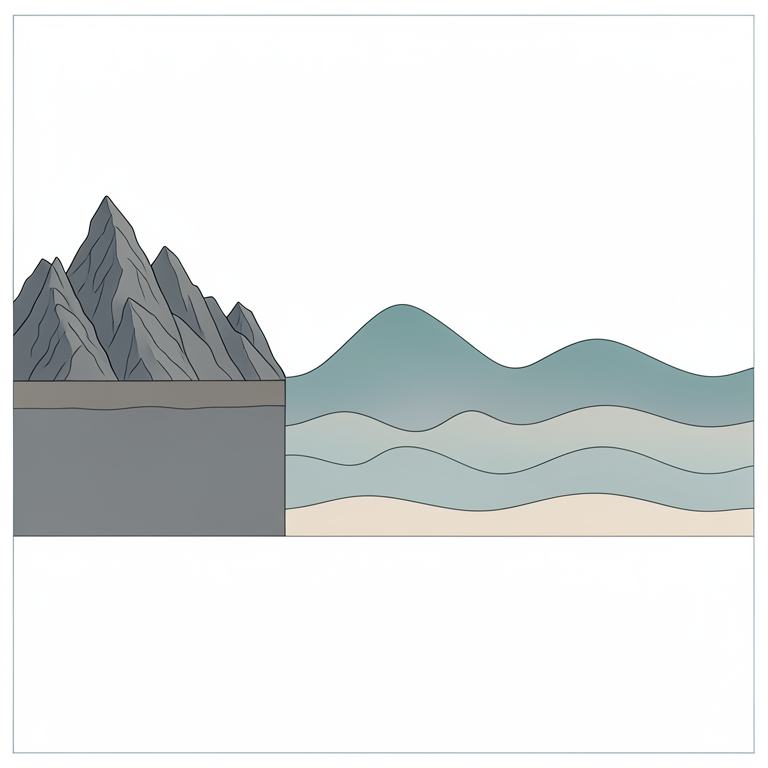
Site Period and Amplification Gradient
AI-generated conceptual illustration (A geological cross-section of the Tehran basin, featuring a mountain range transitioning into an alluvial plain.). It explains the idea and does not show study data.
View source evidence ↗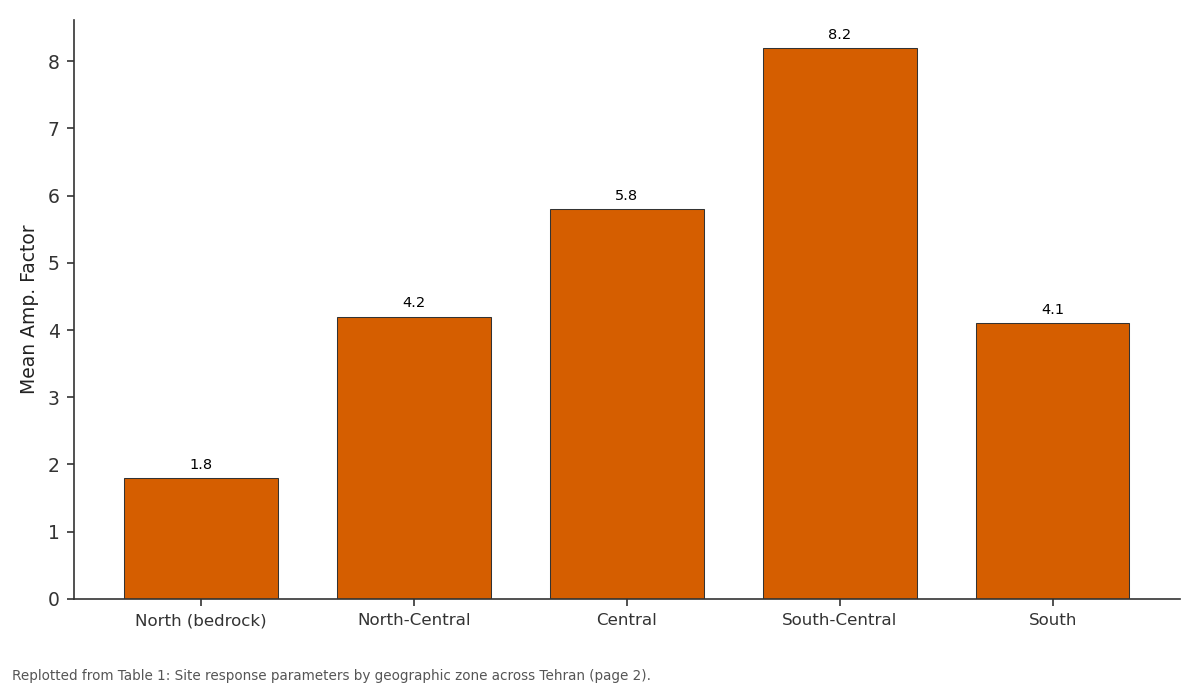
Mean Amp. Factor: North (bedrock) vs North-Central vs Central vs South-Central vs South
Replotted from Table 1 (page 2) of the original paper. Every bar is the paper's own table value.
View source evidence ↗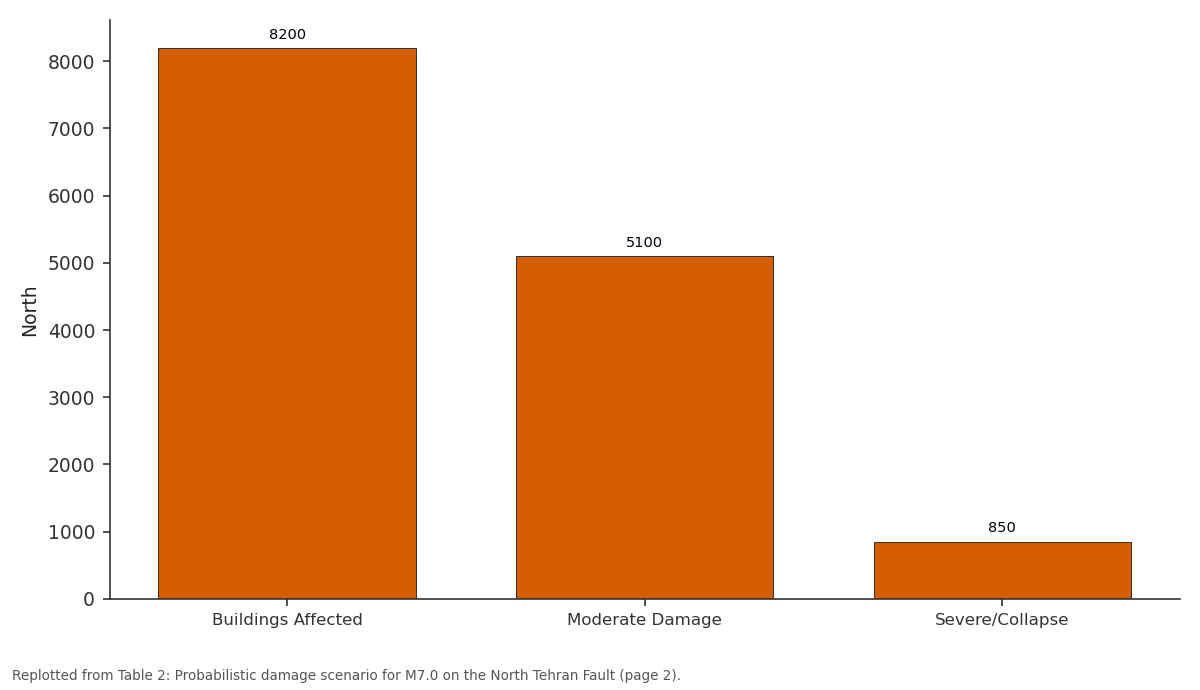
North: Buildings Affected vs Moderate Damage vs Severe/Collapse
Replotted from Table 2 (page 2) of the original paper. Every bar is the paper's own table value.
View source evidence ↗Figures & tables
From the original paper Table 1
 Table 2
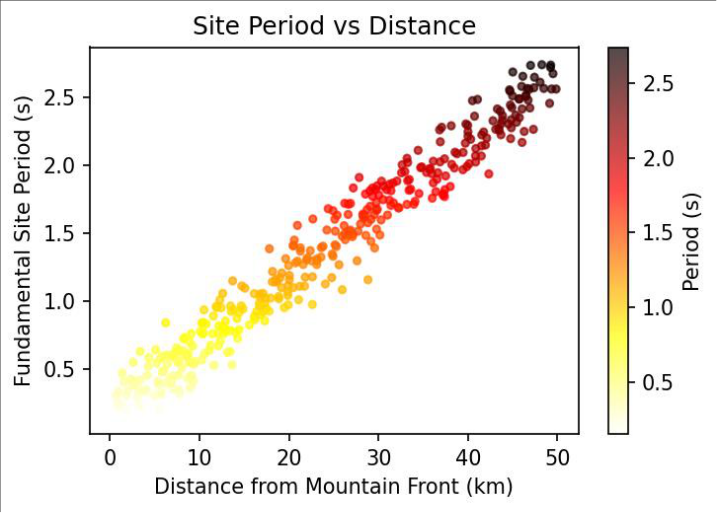 Figure 1
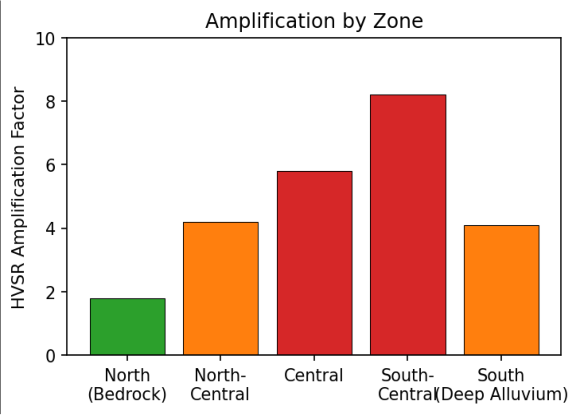 Figure 2
Introduction
Iran is one of the most seismically active countries globally, situated in the Alpine-Himalayan belt where Arabian-Eurasian convergence at ~25 mm/yr generates frequent destructive earthquakes [1] . Tehran is threatened by the North Tehran Fault, Mosha Fault, Parchin Fault, and South Rey Fault, all capable of M7+ events in close proximity to the metropolitan area. The historical record includes the 855 AD earthquake that destroyed ancient Rey and the 1830 event that damaged the then smaller settlement [1,2] . The severity of earthquake damage in urban areas is strongly influenced by local site effects. When seismic waves propagate from bedrock into overlying soft deposits, they undergo amplitude amplification and frequency modification that can dramatically increase destructive potential [3] . In Tehran, alluvial fan deposits thin from zero at the northern mountain margin to over 300 m in the southern plains, creating highly variable amplification conditions [4,5] . Previous microzonation efforts provided preliminary site classification but at insufficient spatial resolution to capture localised amplification anomalies associated with buried geological features [4,6] . The ambient vibration HVSR method offers a rapid, cost-effective approach to characterise site response at high measurement density [7,8] . This research aims to produce a comprehensive site amplification map using 380 HVSR measurements supplemented by geotechnical and geophysical data, and to integrate the results with building vulnerability information to identify zones of greatest earthquake damage potential for emergency preparedness and retrofit prioritisation [9,10] .
Research Area Description
Tehran is situated at 1,100-1,800 m elevation on the southern Alborz flank. The alluvial sequence comprises Quaternary fan and flood plain deposits that fine southward from proximal gravels to distal silts and clays. The deepest alluvium (>200 m) underlies the southern districts of Rey and Islamshahr. Annual precipitation averages 230 mm. The metropolitan population exceeds 8.5 million, with the highest building density in central districts dominated by 3-6 storey reinforced concrete frame structures [1,5] .
Material and Methods
Material and Methods
Material
Ambient vibrations were recorded at 380 locations on an approximate 1 km grid using Nanometrics Trillium Compact broadband seismometers with flat response from 0.008 to 100 Hz, sampling at 200 Hz for 30-60 minutes during nighttime hours to minimise cultural noise. Geotechnical borehole data from 145 locations provided soil layer thicknesses, SPT blow counts, and some shear wave velocity profiles. Twelve MASW and seismic refraction profiles crossed major geological boundaries [4,7] .
Methods
The HVSR technique was applied following SESAME guidelines [8] . Recordings were divided into 60 s nonoverlapping windows with Konno-Ohmachi smoothing (bandwidth 40). Fundamental period was identified at the dominant HVSR peak; amplification factor as the peak amplitude. Vs30 was computed from borehole and MASW data for comparison with Iranian building code site classification. A probabilistic damage scenario was constructed for a M7.0 event on the North Tehran Fault using building vulnerability functions [3,9,10] .
Building Code Comparison and Resonance Analysis
Comparison of HVSR amplification with Iranian seismic code Vs30 site classification revealed significant discrepancies along the alluvial margin where sharp thickness changes produce amplification not captured by the Vs30 parameter alone [3] . Sites classified as moderate by the code actually exhibited high amplification factors due to the strong impedance contrast at shallow bedrock. The 3-6 storey RC frame buildings (natural period 0.3-0.8 s) that constitute 60% of the building stock in central districts overlap substantially with measured site periods, creating double-resonance conditions that can amplify spectral accelerations 5-10 times beyond rock-site values [6,10] . The highest amplification occurs at the alluvial margin (south-central zone, Figure 2) rather than in the thickest alluvium, reflecting impedance contrast physics at the sediment-bedrock interface.
Results
Results
Comprehensive Interpretation
The convergence of HVSR measurements, geotechnical data, and building vulnerability analysis identifies central and south-central Tehran as the zone of greatest seismic damage potential-where high amplification, resonanceprone building stock, and dense population coincide. Highdensity measurements around critical facilities revealed two hospitals located above localised amplification anomalies from buried palaeochannels.
Discussion
The systematic north-to-south period increase correlates with alluvial thickening, consistent with theoretical relationships between deposit thickness and resonance frequency [3,7] . The finding that maximum amplification occurs at the alluvial margin rather than in the thickest deposits has important implications for microzonation mapping, as it demonstrates that simple depth-based classification schemes may misidentify the highest-risk zones [4,6] . The damage scenario estimating 85,000 buildings at risk and 45,000-120,000 potential casualties underscores the catastrophic consequences of a major earthquake. The discrepancies between HVSR results and code-based classification support the argument for site-specific assessment requirements at critical facilities and in high-risk zones [9,10] . Future work should extend the measurement network to the rapidly growing suburban areas east and west of the current grid and develop real-time strong-motion monitoring to validate the HVSR-based amplification estimates during actual earthquake events [11,12,13,14] .
Conclusion
This research produced a comprehensive site amplification map for Tehran based on 380 ambient vibration measurements. The systematic period variation from 0.15 to 2.8 s correlates with alluvial thickness. Amplification factors reaching 8.2 at the alluvial margin define the most hazardous zones.
Integration with building vulnerability identifies central and south-central districts as priorities for seismic risk reduction. The double-resonance between site and structural periods in these areas represents the most dangerous condition. These results support urgent measures including building code enforcement for new construction, structural retrofitting of vulnerable existing buildings, and targeted emergency preparedness planning in the highest-risk zones identified by this analysis.
Acknowledgement
Acknowledgements
Figures and tables from the paper
| Zone | N sites | Period Range (s) | Mean Amp. Factor | Dominant Vs30 Class |
|---|---|---|---|---|
| North (bedrock) | 52 | 0.15–0.40 | 1.8 | Class I |
| North-Central | 78 | 0.40–0.90 | 4.2 | Class II |
| Central | 105 | 0.90–1.50 | 5.8 | Class III |
| South-Central | 88 | 1.20–2.20 | 8.2 | Class III–IV |
| South | 57 | 1.80–2.80 | 4.1 | Class IV |
Table text extracted from the original PDF; superscript letters are shown inline. The original table image is below.
View original table image
| District Zone | Buildings Affected | Moderate Damage | Severe/Collapse | Estimated Casualties |
|---|---|---|---|---|
| North | 8,200 | 5,100 | 850 | 2,500–7,000 |
| Central | 32,400 | 22,800 | 6,200 | 18,000–48,000 |
| South-Central | 28,600 | 19,400 | 5,800 | 16,000–42,000 |
| South | 15,800 | 9,200 | 2,150 | 9,000–23,000 |
Table text extracted from the original PDF; superscript letters are shown inline. The original table image is below.
View original table image
References
13 in the original paper- Berberian M, Yeats RS. Patterns of historical earthquake rupture in the Iranian Plateau. Bull Seismol Soc Am. 1999;89(1):120-139.
- Ambraseys NN, Melville CP. A history of Persian earthquakes. Cambridge: Cambridge University Press; 1982. 219 p.
- Kramer SL. Geotechnical earthquake engineering. Upper Saddle River: Prentice Hall; 1996. 653 p.
- Jafari MK, Razmkhah A, Sohrabi A, et al. Microzonation of Tehran. In: Proceedings of the 12th European Conference on Earthquake Engineering. 2002. Paper 844.
- Rieben EH. The geology of the Tehran plain. Am J Sci. 1955;253(11):617-639.
- Motamed R, Ghalandarzadeh A, Towhata I. Seismic microzonation and damage assessment of Bam. J Earthq Eng. 2007;11(S1):110-132.
- Nakamura Y. A method for dynamic characteristics estimation of subsurface using microtremor. Q Rep RTRI. 1989;30(1):25-33.
- SESAME. Guidelines for the H/V spectral ratio technique on ambient vibrations. European Commission research project. 2004;EVG1-CT-2000-00026:62 p.
- Building and Housing Research Center. Iranian code of practice for seismic resistant design, standard no. 2800. 4th ed. Tehran; 2014.
- Jafari MK, Asghari A, Rahmani I. Empirical correlation between shear wave velocity and SPT-N for south Tehran soils. In: Proceedings of the 4th International Conference on Earthquake Geotechnical Engineering. 2007. Paper 1132.
- Bard PY, Bouchon M. The seismic response of sediment-filled valleys. Bull Seismol Soc Am. 1985;75(2):519-541.
- Bonnefoy-Claudet S, Cotton F, Bard PY. The nature of noise wavefield. J Appl Geophys. 2006;62(2):166-181.
- Haghshenas E, Bard PY, Theodulidis N. Empirical evaluation of microtremor H/V spectral ratio. Bull Earthq Eng. 2008;6(1):75-108.