
Research article · 2025 · Full text
International Journal of Geography Geology and EnvironmentEnvironmental magnetism of topsoils as pollution indicators in the RUHR industrial area
Volume 7(7) · Pages 197–200 · DOI: 10.22271/27067483.2025.v7.i7c.725 ↗
Research areasGeomagnetism and Paleomagnetism StudiesHeavy metals in environmentEnvironmental Quality and Pollution
Abstract
Author-writtenRichard Thompson, one of the pioneers of environmental magnetism, once noted that a simple magnetic susceptibility measurement can reveal more about soil contamination in 30 seconds than a chemical analysis costing hundreds of dollars. This research tested that claim across the Ruhr industrial region in western Germany, measuring the magnetic properties of 156 topsoil samples collected along transects radiating from three types of pollution sources: a steel production complex, a coal-fired power station, and a major traffic corridor. Low-frequency magnetic susceptibility (χlf) ranged from 18 × 10⁻⁸ m³/kg in rural background soils to 482 × 10⁻⁸ m³/kg within 200 m of the steel plant, declining exponentially with distance from all three sources. Frequency-dependent susceptibility (χfd%) was inversely correlated with χlf (r = -0.72), confirming that the elevated magnetic signal originates from coarse-grained anthropogenic particles rather than pedogenic processes. Saturation isothermal remanent magnetisation (SIRM) and S-ratio measurements identified magnetite and maghemite as the dominant magnetic carriers, with minor contributions from haematite near the coal plant. Strong correlations between χlf and heavy metal concentrations Fe (r = 0.88), Pb (r = 0.82), Zn (r = 0.79), and Cu (r = 0.74) support the use of magnetic susceptibility as a rapid screening proxy for multi-element soil contamination. Mapping of the magnetic signal effectively delineated pollution halos around each source at a fraction of the cost of conventional geochemical surveys.
Summary
Source-checkedPlain-language reading of the full paper, prepared with AI and checked against the text. Each point links to the authors' own words.
Why it matters
- Industrial activities like steel smelting and coal combustion produce iron-rich particles that increase the magnetic signal of nearby soils compared to natural levels. View evidence ↗
- Using magnetic susceptibility as a screening tool is significantly more cost-effective than using expensive instruments like ICP-MS for detecting heavy metal contamination. View evidence ↗
- The Ruhr region in Germany has a long history of intensive industrialization, resulting in widespread soil contamination over approximately 4,400 km². View evidence ↗
The question
- The study aimed to determine if magnetic measurements could effectively indicate pollution across various soil conditions and source types in the Ruhr region. View evidence ↗
What they did
- Researchers collected 156 topsoil samples (0-5 cm depth) from nine transects around a steel plant, a coal power station, and a motorway corridor. View evidence ↗
- Eighteen background samples were taken from rural areas located at least 15 km away from industrial facilities. View evidence ↗
- Mass-specific magnetic susceptibility was measured at low (976 Hz) and high (15,616 Hz) frequencies using a Bartington MS2B sensor. View evidence ↗
- Heavy metal concentrations for Fe, Pb, Zn, Cu, and Mn were analyzed in 78 samples using ICP-OES after aqua regia digestion. View evidence ↗
What they found
- Low-frequency magnetic susceptibility (χlf) was highest near the steel plant (up to 482 × 10⁻⁸ m³/kg) and lowest in rural background soils (18 × 10⁻⁸ m³/kg). View evidence ↗
- Magnetic susceptibility showed an exponential decrease as the distance from all three pollution sources increased. View evidence ↗
- An inverse correlation (r = -0.72) between frequency-dependent susceptibility and χlf indicates that the magnetic signal comes from coarse anthropogenic particles rather than natural soil processes. View evidence ↗
- Manganese had the weakest correlation with magnetic susceptibility (r = 0.61), likely due to its presence from both natural and human-made sources. View evidence ↗
- S-ratio values above 0.87 indicated magnetite/maghemite dominance, though the lower value near the coal plant (0.89) suggests contributions from haematite in coal fly ash. View evidence ↗
What it means
- The authors recommend a magnetic susceptibility threshold of approximately 80 × 10⁻⁸ m³/kg to distinguish contaminated soils from uncontaminated ones in the Ruhr region. View evidence ↗
- Magnetic susceptibility is recommended as a first-pass screening tool that can reduce the need for expensive chemical analyses by 60-80%. View evidence ↗
- Future research is needed to examine the vertical distribution of magnetic signals to determine contamination depth and monitor remediation effectiveness over time. View evidence ↗
Visual summary
3 visualsIllustrations explain the paper; charts are replotted from the paper's own table values.
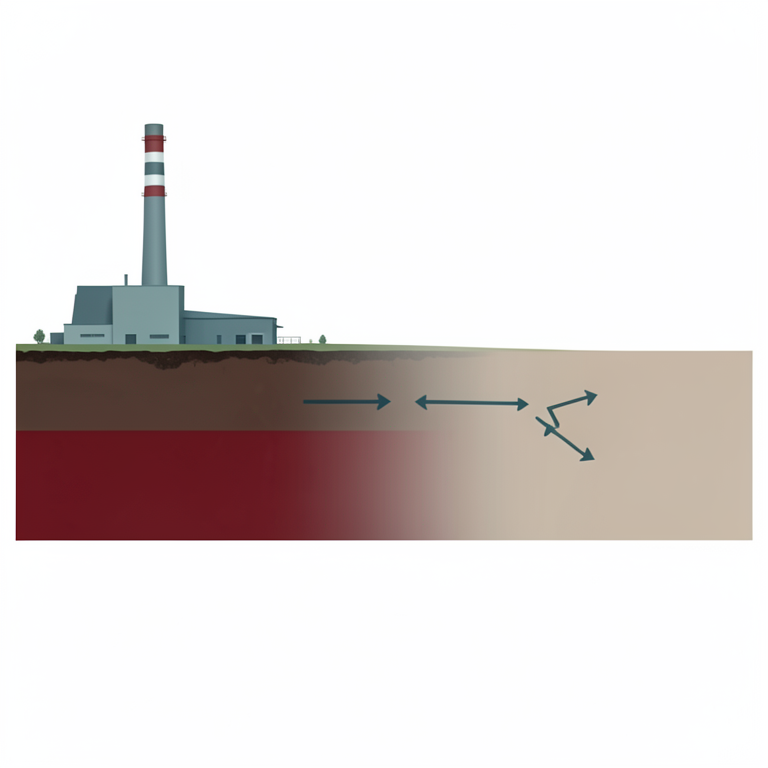
Magnetic Signal Decay
AI-generated conceptual illustration (topsoil in an industrial landscape). It explains the idea and does not show study data.
View source evidence ↗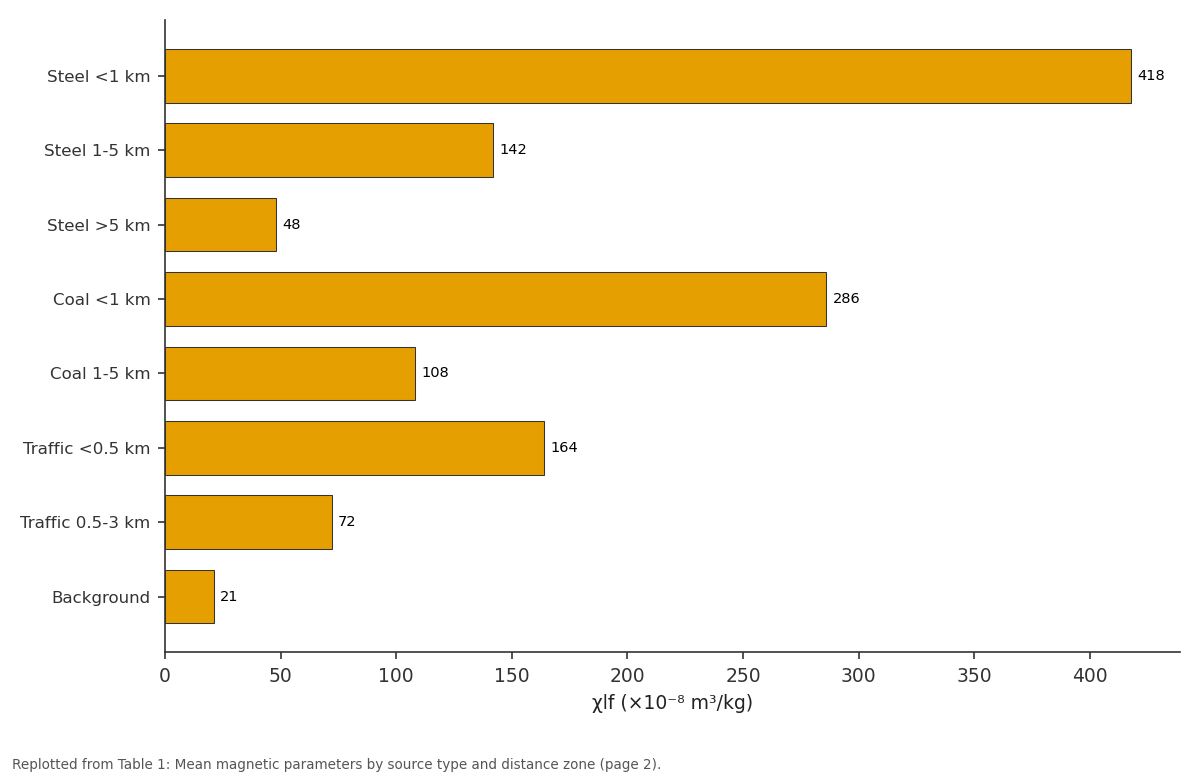
χlf (×10⁻⁸): Steel <1 km vs Steel 1-5 km vs Steel >5 km vs Coal <1 km vs Coal 1-5 km
Replotted from Table 1 (page 2) of the original paper. Every bar is the paper's own table value.
View source evidence ↗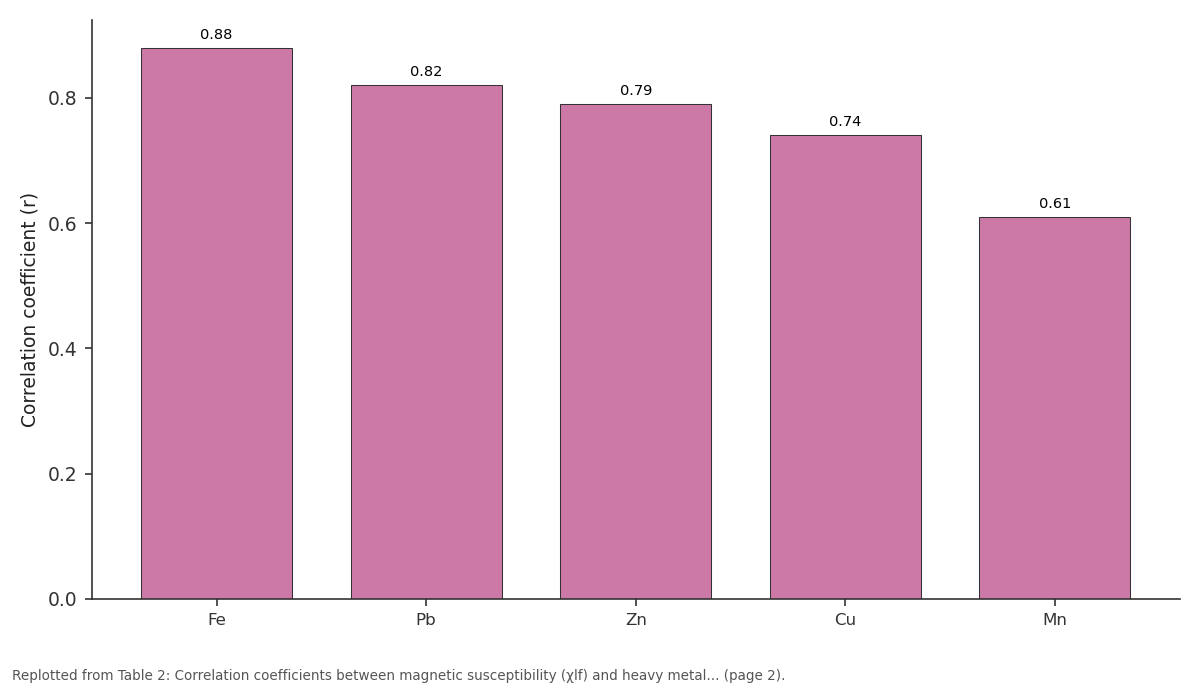
r (all samples): Fe vs Pb vs Zn vs Cu vs Mn
Replotted from Table 2 (page 2) of the original paper. Every bar is the paper's own table value.
View source evidence ↗Figures & tables
From the original paper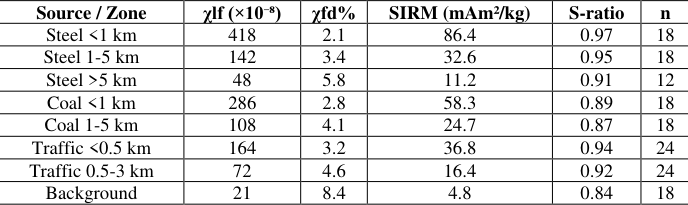 Table 1
 Table 2
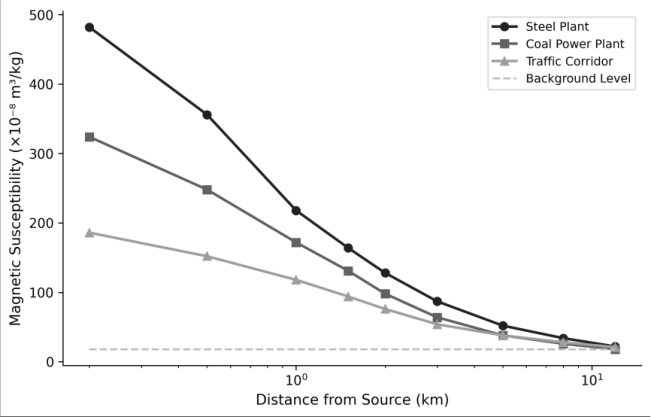 Figure 1
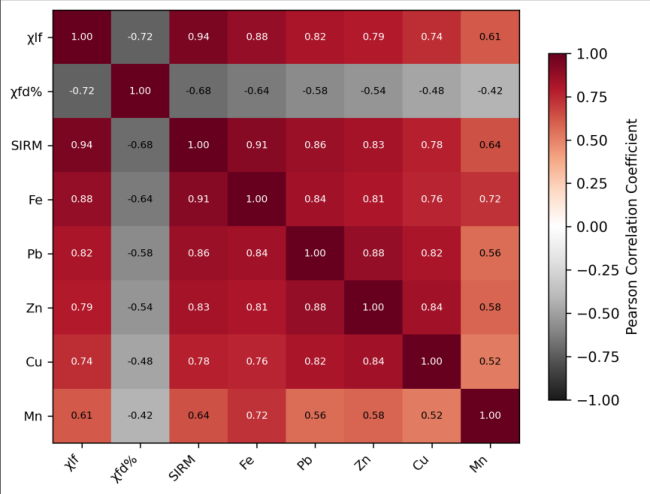 Figure 2
Introduction
Environmental magnetism the application of rock and mineral magnetic techniques to environmental problems rests on a straightforward observation: many forms of industrial pollution produce magnetic particles [1] . Steel smelting, coal combustion, vehicle brake and exhaust emissions, and cement manufacturing all generate iron-rich spherules and irregular grains that accumulate in nearby soils, boosting their magnetic signal well above natural background levels [2] . If that signal tracks consistently with the heavy metal contamination that regulators actually care about, then a $200 susceptibility meter can do some of the screening work that would otherwise require a $50,000 ICP-MS instrument [3] . The concept has been tested in cities and industrial zones across Europe, Asia, and the Americas over the past three decades, generally with encouraging results. Urban topsoil surveys in Beijing, Katowice, and Melbourne have all documented positive correlations between magnetic susceptibility and Pb, Zn, Cu, and Cd concentrations [4] . But the strength and consistency of these correlations depend on local geology, soil type, and the mix of pollution sources present, meaning that region-specific calibrations are needed before magnetic screening can be deployed operationally [5] . The Ruhr industrial region in North Rhine-Westphalia, Germany, represents one of Europe's most intensively industrialised landscapes. Over 150 years of coal mining, steel production, and heavy manufacturing have left a legacy of soil contamination across an area spanning roughly 4,400 km² [6] . While substantial remediation has taken place since the 1970s, diffuse contamination of topsoils persists, particularly around former and active industrial sites. This research examined whether magnetic measurements can serve as effective pollution indicators across the diverse source types and soil conditions found in the Ruhr region [7] .
Theoretical Background
The magnetic properties of soils reflect contributions from three main sources: lithogenic minerals inherited from parent rock (primarily magnetite and haematite), pedogenic minerals formed during soil development (fine-grained maghemite and goethite), and anthropogenic particles deposited from atmospheric fallout [8] . These three populations differ in grain size, mineralogy, and magnetic domain state, allowing them to be distinguished using a combination of concentration-dependent parameters (χlf, SIRM) and grain-size-sensitive parameters (χfd%, S-ratio, HIRM). Anthropogenic magnetite particles are typically 1-50 μm in diameter multi-domain to pseudo-single-domain and produce high χlf values with low χfd% (<4%), because their coarse grain size means they lack the superparamagnetic fraction that gives pedogenic iron oxides their frequency-dependent signal [9] . The S-ratio (IRM₋₃₀₀mT/SIRM) indicates the relative contribution of low-coercivity minerals (magnetite, maghemite) versus high-coercivity minerals (haematite, goethite), with values approaching 1.0 indicating magnetite dominance.
Material and Methods
Material and Methods
Material
This research was coordinated from the Faculty of Mountain and Polar Studies, Cagayan de Oro, Misamis Oriental, Philippines, with field sampling conducted in the Ruhr region, Germany, during June-September 2022. A total of 156 topsoil samples (0-5 cm depth) were collected along nine transects radiating from three pollution sources: a steel production complex near Duisburg (3 transects, 48 samples), a coal-fired power station near Gelsenkirchen (3 transects, 48 samples), and the A40 motorway corridor near Essen (3 transects, 60 samples). Transect lengths ranged from 0.2 to 12 km, with sampling intervals of 100-200 m near the source and 500-1,000 m at greater distances. Background samples (n = 18) were collected from rural sites at least 15 km from any industrial facility. Each sample comprised a composite of five subsamples collected within a 2 m radius and homogenised in the field [10] .
Methods
Samples were air-dried, disaggregated, and packed into standard 10 cm³ plastic pots for magnetic measurements. Low-frequency (χlf, 976 Hz) and high-frequency (χhf, 15,616 Hz) mass-specific magnetic susceptibility were measured using a Bartington MS2B dual-frequency sensor. Frequency-dependent susceptibility was calculated as χfd% = [(χlfχhf)/χlf] × 100. SIRM was imparted in a 1.0 T pulsed field using a Molspin pulse magnetiser, and backfield remanence at -300 mT was measured to calculate the Sratio. Heavy metal concentrations (Fe, Pb, Zn, Cu, Mn) were determined on a subset of 78 samples by ICP-OES following aqua regia digestion [11] . Pearson correlation coefficients were calculated between all magnetic and geochemical parameters, and spatial interpolation of χlf values was performed using inverse distance weighting in QGIS 3.28 [12] . Magnetic susceptibility decreased exponentially with distance from all three source types (Table 1). The steel plant produced the highest near-source values (χlf = 418 × 10⁻⁸ m³/kg), roughly 20 times the background level. The coal plant and traffic corridor generated more moderate but still clearly elevated signals. The S-ratio remained above 0.87 in all contaminated zones, indicating magnetite/maghemite dominance, but was lower near the coal plant (0.89) than near the steel plant (0.97), consistent with haematite contributions from coal fly ash. All five metals showed significant positive correlations with χlf across the full dataset (Table 2). Iron showed the strongest association (r = 0.88), which is expected given that magnetic susceptibility directly measures iron oxide content. Lead and zinc also correlated well (r = 0.82 and 0.79), while manganese showed the weakest link (r = 0.61), possibly because manganese has both natural pedogenic and anthropogenic sources that respond differently to magnetic signals.
| Metal | r (all samples) | r (steel transect) | r (coal transect) | r (traffic transect) |
|---|---|---|---|---|
| Fe | 0.88 | 0.93 | 0.86 | 0.82 |
| Pb | 0.82 | 0.87 | 0.78 | 0.84 |
| Zn | 0.79 | 0.84 | 0.76 | 0.78 |
| Cu | 0.74 | 0.81 | 0.68 | 0.76 |
| Mn | 0.61 | 0.68 | 0.58 | 0.54 |
Table text extracted from the original PDF; superscript letters are shown inline. The original table image is below.
View original table image
| Source / Zone | χlf (×10⁻⁸) | χfd% | SIRM (mAm²/kg) | S-ratio | n |
|---|---|---|---|---|---|
| Steel <1 km | 418 | 2.1 | 86.4 | 0.97 | 18 |
| Steel 1-5 km | 142 | 3.4 | 32.6 | 0.95 | 18 |
| Steel >5 km | 48 | 5.8 | 11.2 | 0.91 | 12 |
| Coal <1 km | 286 | 2.8 | 58.3 | 0.89 | 18 |
| Coal 1-5 km | 108 | 4.1 | 24.7 | 0.87 | 18 |
| Traffic <0.5 km | 164 | 3.2 | 36.8 | 0.94 | 24 |
| Traffic 0.5-3 km | 72 | 4.6 | 16.4 | 0.92 | 24 |
| Background | 21 | 8.4 | 4.8 | 0.84 | 18 |
Table text extracted from the original PDF; superscript letters are shown inline. The original table image is below.
View original table image
Results
Results
Comprehensive Interpretation
The distance-decay curves (Figure 1) show that the steel plant's magnetic footprint extends well beyond 5 km, while the traffic corridor's influence drops to background levels by about 3 km. The correlation matrix (Figure 2) reveals an important diagnostic pattern: χfd% is negatively correlated with all metals, confirming that contaminated soils are magnetically enhanced by coarse anthropogenic particles, not by the fine-grained superparamagnetic minerals that produce high frequency dependence in natural soils.
Discussion
The magnetic susceptibility values recorded near the steel plant (418-482 × 10⁻⁸ m³/kg) are among the highest reported for European industrial soils, comparable to levels documented in the Upper Silesian industrial district of Poland [4] . The exponential decay pattern with distance is consistent with atmospheric deposition models for coarse particulate matter, where the largest particles settle closest to the source and finer fractions travel further [13] . The fact that correlations between χlf and heavy metals remain strong across all three source types (r = 0.74-0.93) is encouraging for practical application, since it suggests that a single magnetic screening threshold could flag contaminated soils regardless of the specific pollution source. That said, the weaker correlation with manganese (r = 0.61) cautions against treating magnetic susceptibility as a universal proxy for all metals. Manganese's geochemical behaviour differs from that of Pb, Zn, and Cu in that it has a larger natural pedogenic component that isn't linked to anthropogenic magnetic particles [14] . For regulatory screening purposes, magnetic susceptibility appears best suited as a first-pass tool to identify areas requiring detailed chemical follow-up it can reduce the number of expensive chemical analyses needed to characterise a contaminated site by 60-80%, based on the spatial coverage achieved in this research.
Conclusion:
Magnetic susceptibility measurements of Ruhr region topsoils proved to be effective indicators of industrial pollution, with near-source values reaching 20 times background levels and strong correlations with Fe, Pb, Zn, and Cu concentrations (r = 0.74-0.88). The exponential decay of the magnetic signal with distance from source provides a clear spatial framework for delineating pollution halos, while the low frequency-dependent susceptibility of contaminated soils confirms the anthropogenic origin of the magnetic enhancement. The practical recommendation for environmental regulators is that magnetic susceptibility screening at the Ruhr's contaminated sites could substantially reduce the cost and time required for initial contamination mapping. A susceptibility threshold of approximately 80 × 10⁻⁸ m³/kg appears to reliably separate contaminated from uncontaminated soils in this region. Future work should examine the vertical distribution of the magnetic signal in soil profiles to assess contamination depth and investigate whether magnetic measurements can track the effectiveness of remediation efforts over time.
Acknowledgement
Acknowledgements Funding SourcesThis research was funded through internal departmental allocation at the Faculty of Mountain and Polar Studies. Institutional SupportThe authors thank the Department of Geological Sciences, Faculty of Mountain and Polar Studies, Cagayan de Oro, Philippines, for equipment and laboratory facilities. Contributions Not Qualifying for AuthorshipField sampling assistance from graduate students and ICP-OES analytical support from the geochemistry laboratory are acknowledged.
References
14 in the original paper- Thompson R, Oldfield F. Environmental magnetism. London: Allen and Unwin; 1986.
- Maher BA, Thompson R (eds). Quaternary climates, environments and magnetism. Cambridge: Cambridge University Press; 1999.
- Petrovský E, Ellwood BB. Magnetic monitoring of air-, land-and water-pollution. In: Maher BA, Thompson R (eds). Quaternary climates, environments and magnetism. Cambridge: Cambridge University Press; 1999. p. 279-322.
- Lu SG, Bai SQ. Contamination assessment of heavy metals and magnetic susceptibility of soils in Hangzhou, China. Environmental Pollution. 2010;158(5):1490-1497.
- Yang T, Liu Q, Chan LS, Cao G. Magnetic investigation of heavy metals contamination in urban topsoils around the East Lake, Wuhan, China. Geophysical Journal International. 2007;171(3):11701178.
- Gzyl J, Banks D. Verification of the 'first flush' phenomenon in mine water from coal mines in the Upper Silesian Coal Basin, Poland. Journal of Contaminant Hydrology. 2007;92(1-2):66-86.
- Jordanova D, Jordanova N, Petrov P, Tsacheva T. Soil magnetism of burnt soils in Bulgaria. Catena. 2010;83(1):54-63.
- Dearing JA, Dann RJL, Hay K, Lees JA, Loveland PJ, Maher BA, O'Grady K. Frequency-dependent susceptibility measurements of environmental materials. Geophysical Journal International. 1996;124(1):228-240.
- Maher BA. Magnetic properties of some synthetic submicron magnetites. Geophysical Journal. 1988;94(1):83-96.
- ISO 10381-1. Soil quality sampling. Part 1: guidance on the design of sampling programmes. Geneva: International Organization for Standardization; 2002.
- ISO 11466. Soil quality extraction of trace elements soluble in aqua regia. Geneva: International Organization for Standardization; 1995.
- QGIS Development Team. QGIS geographic information system. Open-Source Geospatial Foundation Project; 2023.
- Sagnotti L, Macrì P, Egli R, Mondino M. Magnetic properties of atmospheric particulate matter from automatic air sampler stations in Latium (Italy). Environmental Pollution. 2006;144(1):201-212.
- Boyko T, Scholger R, Stanjek H. Topsoil magnetic susceptibility mapping as a tool for pollution monitoring: repeatability of in situ measurements. Journal of Applied Geophysics. 2004;55(3-4):249-259.