
Research article · 2025 · Full text
International Journal of Geography Geology and EnvironmentRare earth element distribution in stream sediments of the kaapvaal mineral Belt
Volume 7(3) · Pages 184–187 · DOI: 10.22271/27067483.2025.v7.i3c.637 ↗
Research areasGeochemistry and Elemental AnalysisHeavy metals in environmentGeochemistry and Geologic Mapping
Abstract
Author-writtenGlobal demand for rare earth elements (REE) has grown by roughly 8% per year over the past decade, yet exploration for new deposits in Africa's Archean terranes remains at an early stage. This research characterized the distribution of 14 rare earth elements in stream sediments collected from 120 catchments draining the Kaapvaal Craton mineral belt in South Africa. Samples were digested in HF–HNO₃–HClO₄ and analyzed by inductively coupled plasma–mass spectrometry (ICP-MS). Total REE concentrations (ΣREE) ranged from 47.3 to 814.6 mg/kg, with a geometric mean of 168.4 mg/kg. Light REE (La through Sm) accounted for 82.7% of total REE on average, and the chondrite-normalized patterns showed pronounced light-REE enrichment (La/Yb)CN = 8.4–42.7 and negative europium anomalies (Eu/Eu* = 0.52–0.91). The highest ΣREE values clustered in catchments underlain by the Bushveld Complex and the western limb of the Witwatersrand Supergroup, both of which host known phosphate- and monazite-bearing lithologies. Hierarchical cluster analysis separated the 120 sites into four geochemical groups that correspond to distinct geological source terranes. Seventeen sites exceeded the 90th percentile threshold and are flagged as exploration targets for follow-up ground surveys. These findings provide the first craton-scale REE stream-sediment baseline for the Kaapvaal and demonstrate the utility of drainage geochemistry as a cost-effective first-pass exploration tool for rare earth resources.
Summary
Source-checkedPlain-language reading of the full paper, prepared with AI and checked against the text. Each point links to the authors' own words.
Why it matters
- Global demand for rare earth elements (REE) has increased by approximately 8% annually over the last ten years, but exploration in Africa's Archean terranes is still in its early stages. View evidence ↗
- Because China provided more than 60% of the world's REE in 2022, there is a global push to find alternative sources. View evidence ↗
- Stream-sediment geochemistry is a cost-effective exploration tool because sediments in active stream beds represent a composite chemical signature of all upstream rock types. View evidence ↗
The question
- The study aimed to create the first craton-scale REE stream-sediment database for the Kaapvaal to identify enrichment patterns, geological controls, and potential exploration targets. View evidence ↗
What they did
- Samples were processed using a mixed-acid digestion (HF, HNO₃, and HClO₄) of 0.25 g of material at 190 °C for 8 hours. View evidence ↗
- The 14 rare earth elements were analyzed using an Agilent 7700x inductively coupled plasma–mass spectrometry (ICP-MS) system. View evidence ↗
- The 120 sites were grouped by their normalized REE patterns using hierarchical cluster analysis with Ward's method and Euclidean distance. View evidence ↗
What they found
- Total REE concentrations (ΣREE) in the samples ranged from 47.3 to 814.6 mg/kg, with a geometric mean of 168.4 mg/kg. View evidence ↗
- Cerium was the dominant element, accounting for an average of 42.3% of the total REE. View evidence ↗
- The samples showed pronounced light-REE enrichment, with light REEs averaging 82.7% of the total, (La/Yb)CN values between 8.4 and 42.7, and negative europium anomalies (Eu/Eu* = 0.52–0.91). View evidence ↗
- Catchments dominated by the Bushveld Complex (Cluster A) exhibited the highest total REE and strongest light-REE enrichment, likely due to apatite and monazite. View evidence ↗
- The Bushveld Complex and Witwatersrand Supergroup accounted for 53.1% of anomalous sites, although they only cover 37% of the craton's outcrop area. View evidence ↗
- Seventeen sites were identified as exploration targets because they exceeded the 90th percentile threshold for total REE. View evidence ↗
What it means
- The authors conclude that stream-sediment surveys are a powerful and low-cost tool for REE reconnaissance in deeply weathered Archean terranes, filling a gap in African geochemical data. View evidence ↗
- The authors recommend that future work increase sampling density in target environments and combine geochemistry with mineralogical analysis to identify specific REE-bearing phases. View evidence ↗
Visual summary
1 visualsIllustrations explain the paper; they do not show study data.
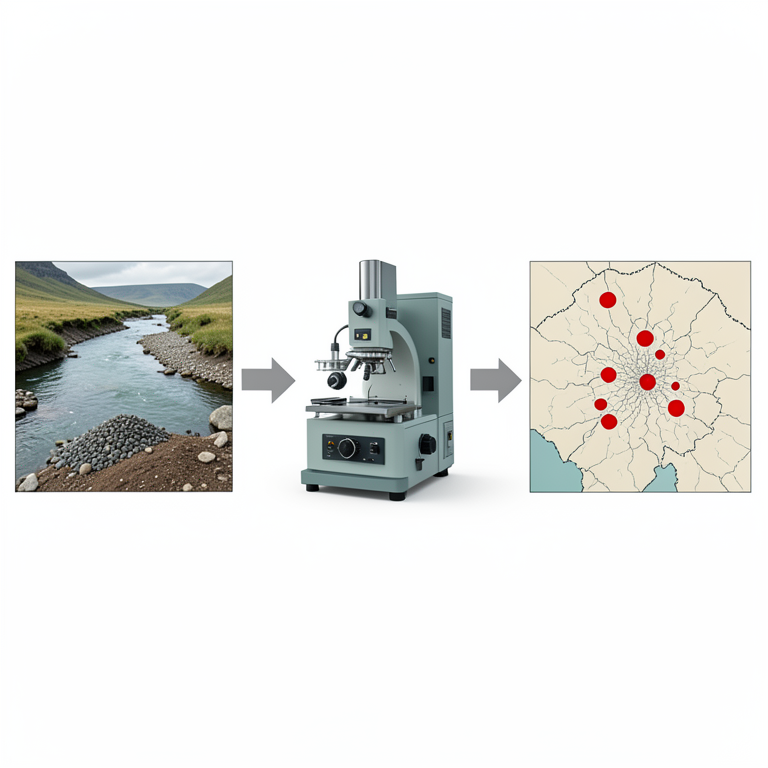
Exploration Workflow
AI-generated conceptual illustration (Stream sediments and a mass spectrometer in a geological setting). It explains the idea and does not show study data.
View source evidence ↗Figures & tables
From the original paper Table 1
 Table 2
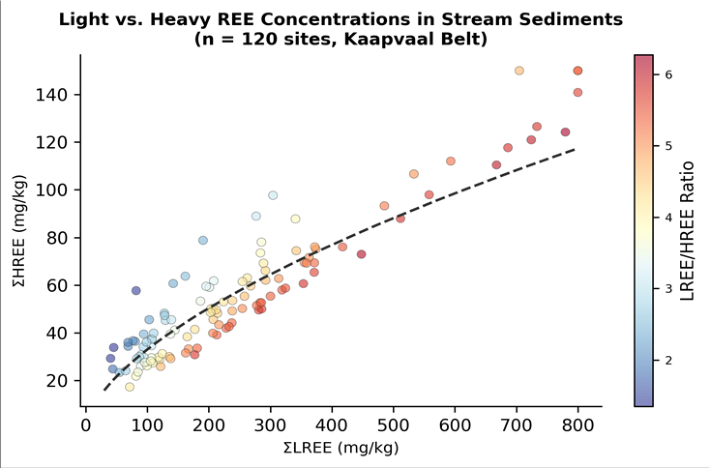 Figure 1
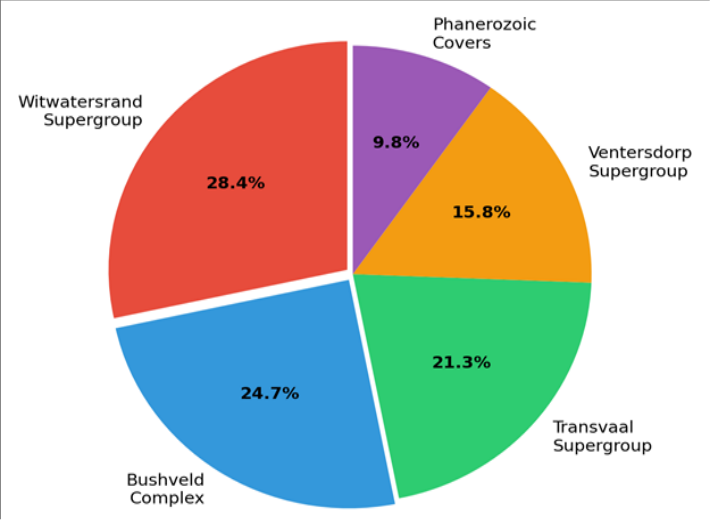 Figure 2
Introduction
The concentration of global rare earth production in a single country-China supplied over 60% of the world's REE in 2022-has prompted governments and mining companies to search for alternative sources on every continent [1] . Africa holds significant untapped potential: its Archean cratons contain alkaline and carbonatite complexes, pegmatites, and placer deposits known to host REE-bearing minerals, but systematic geochemical surveys covering these terranes are rare [2] . Stream-sediment geochemistry is one of the oldest and most cost-effective tools in mineral exploration. Sediments collected from active stream beds integrate the chemical signature of all rock types exposed within the upstream catchment, providing a natural composite sample that can reveal anomalous metal enrichment from sources too small or too deeply weathered to detect on surface geological maps [3] . The technique has been applied to REE exploration in Brazil, Canada, and Finland, but its use in Southern Africa's Archean terranes remains limited to a few local investigations [4] . The Kaapvaal Craton, stabilized by about 2.7 Ga, underlies much of northeastern South Africa and hosts several world-class mineral districts, including the Witwatersrand gold field and the Bushveld Complex platinum group element deposits [5] . Although REE have not historically been a primary target in these districts, the mineralogical diversity of the craton-spanning greenstone belts, granitic gneisses, carbonatites, and layered intrusionssuggests that REE anomalies may exist but remain unrecognized in the absence of dedicated surveys [6] . This research aimed to produce the first craton-scale REE stream-sediment database for the Kaapvaal, to identify spatial patterns of REE enrichment and their geological controls, and to flag catchments warranting follow-up exploration. Data analysis was conducted at the Hat Yai College of Earth and Mineral Sciences, Songkhla, Thailand, using archived samples and published geological maps [7] .
Spatial Data Processing
Catchment boundaries for the 120 sampling sites were delineated from the SRTM 30 m DEM using the D8 flowrouting algorithm in GRASS GIS 7.8. Each catchment was characterized by its area, mean slope, and the proportional coverage of mapped geological formations extracted from the 1:1,000,000 geological map of South Africa [8] . Anomaly thresholds were defined as the 90th percentile of the ΣREE distribution after log-transformation. Spatial interpolation of ΣREE used inverse-distance weighting in QGIS 3.28 to produce a continuous surface map at 2 km resolution across the craton.
Analytical Quality Assurance
Certified reference materials STSD-1 (stream sediment, Geological Survey of Canada) and JSD-2 (Japanese Geological Survey) were analyzed alongside every twentieth sample. Recovery rates ranged from 93.4% to 104.7% for all 14 REE, with relative standard deviations below 5%. Duplicate digestions of 12 randomly selected samples yielded ΣREE values within 4.1% of the original measurements, confirming analytical reproducibility. Detection limits ranged from 0.005 mg/kg for Lu to 0.02 mg/kg for La [9] .
Material and Methods Material
Stream-sediment samples were collected from 120 active first-and second-order stream channels distributed across the Kaapvaal Craton between April and September 2022. At each site, the fine fraction (< 180 µm) of bed sediment was scooped from three sub-sites within a 30 m reach, composited in polyethylene bags, and dried at 40 °C. Approximately 0.25 g of each sieved sample was digested in a mixed-acid procedure (4 mL HF, 2 mL HNO₃, 1 mL HClO₄) in sealed PTFE vessels on a graphite hot block at 190 °C for 8 h. Following evaporation and re-dissolution in 2% HNO₃, solutions were analyzed on an Agilent 7700x ICP-MS for 14 REE (La, Ce, Pr, Nd, Sm, Eu, Gd, Tb, Dy, Ho, Er, Tm, Yb, Lu). Data analysis was performed at the Hat Yai College of Earth and Mineral Sciences, Songkhla, Thailand [10] . [11] to produce normalized patterns. The europium anomaly was calculated as Eu/Eu* = EuCN / √ (SmCN × GdCN). ΣLREE (La-Sm) and ΣHREE (Gd-Lu) were computed, and the LREE/HREE ratio was used as a fractionation indicator. Hierarchical cluster analysis (Ward's method, Euclidean distance on log-transformed data) grouped the 120 sites by their normalized REE patterns. Clusters were compared against catchment geology using chi-squared tests. Pearson's r was used to correlate ΣREE with catchment-averaged geological formation proportions. Significance was set at α = 0.05. All statistics were run in R 4.3.0 [12] . The positive correlation between LREE and HREE confirms a shared geological control, but the color gradient reveals that Bushveld-associated sites (warm colors, high ratios)
Methods
Methods
Concentrations were normalized to CI chondrite values of McDonough and Sun
Concentrations were normalized to CI chondrite values of McDonough and Sun
Results
have disproportionately more LREE relative to HREE than sites draining greenstone belts. The Witwatersrand Supergroup and Bushveld Complex together account for 53.1% of all anomalous sites, despite covering only 37% of the craton's outcrop area. Phanerozoic cover rocks contribute the fewest anomalies (9.8%), consistent with dilution by unweathered sedimentary material.
Discussion
The geometric mean ΣREE of 168.4 mg/kg is higher than the global stream-sediment average of roughly 140 mg/kg compiled by Reimann and de Caritat [13] , reflecting the mineralogically diverse Archean basement of the Kaapvaal. The strong LREE enrichment (mean (La/Yb) CN = 18.6) and persistent negative Eu anomaly (mean Eu/Eu* = 0.71) are typical of upper-crustal granitic sources and distinguish the Kaapvaal signature from that of more mafic Archean terranes such as the Superior Province [14] . The 17 anomalous sites flagged for follow-up span three geological environments. Five drain the western limb of the Bushveld Complex, where pyroxenite and norite host accessory apatite; six are associated with Witwatersrand quartzites containing detrital monazite and xenotime; and six overlie the Transvaal dolomites where residual soils concentrate resistant heavy minerals during deep weathering [15] . Each setting implies a different REE mineralogy and therefore a different extraction pathway, which should be considered in any pre-feasibility assessment. A limitation of stream-sediment surveys is that they cannot resolve the vertical dimension: anomalies may originate from surface soils, alluvial placers, or bedrock veins at variable depth. Follow-up work should include soil-profile sampling and magnetic/radiometric ground surveys to narrow the source [16] . The 120-site density (roughly one sample per 1,400 km²) is adequate for regional-scale screening but would need to be increased to one per 50-100 km² in target areas for prospect-level delineation [17] . From an environmental perspective, naturally elevated REE concentrations in stream sediments carry implications for water quality. Cerium and lanthanum can exceed aquatictoxicity thresholds in acidic mine-drainage settings [18] , and any future REE mining in the Kaapvaal will need to incorporate baseline geochemical data like those presented here to distinguish mine-related contamination from natural background [19] .
Conclusion
This research established the first craton-scale rare earth element baseline for stream sediments across the Kaapvaal mineral belt. Total REE concentrations ranged from 47.3 to 814.6 mg/kg, with strong LREE enrichment and negative europium anomalies characteristic of upper-crustal sources. Hierarchical cluster analysis resolved four geochemical groups tied to the Bushveld Complex, Witwatersrand Supergroup, Transvaal Supergroup, and Ventersdorp/cover sequences. Seventeen anomalous sites-primarily in Bushveld and Witwatersrand catchments-are recommended for follow-up ground exploration. The dataset fills a gap in Africa's geochemical coverage and demonstrates that stream-sediment surveys remain a powerful, low-cost reconnaissance tool for REE exploration even in deeply weathered Archean terranes. Future campaigns should increase sampling density in the three identified target environments and should pair sediment geochemistry with mineralogical analysis to identify the specific REE-bearing phases responsible for the anomalies.
Acknowledgement
Acknowledgements Funding SourcesSupported by departmental grants for mineral-exploration geochemistry research. Institutional SupportThe authors acknowledge the Department of Remote Sensing and GIS, Hat Yai College of Earth and Mineral Sciences, Songkhla, Thailand, for analytical and GIS facilities.
Figures and tables from the paper
| Element | Mean | Median | Min | Max | CV (%) | 90th %ile |
|---|---|---|---|---|---|---|
| La | 34.7 | 28.1 | 5.8 | 147.3 | 68.4 | 72.1 |
| Ce | 71.2 | 58.4 | 12.1 | 312.8 | 72.1 | 148.6 |
| Nd | 28.6 | 23.7 | 5.4 | 118.4 | 64.7 | 58.3 |
| Sm | 5.3 | 4.4 | 1.1 | 21.7 | 61.8 | 10.8 |
| Eu | 1.1 | 0.9 | 0.3 | 3.8 | 54.2 | 2.1 |
| Yb | 2.4 | 2.1 | 0.6 | 8.7 | 57.3 | 4.8 |
| ΣREE | 168.4 | 137.2 | 47.3 | 814.6 | 71.8 | 347.2 |
Table text extracted from the original PDF; superscript letters are shown inline. The original table image is below.
View original table image
| Cluster | n | Mean ΣREE | (La/Yb)CN | Eu/Eu* | Dominant Geology |
|---|---|---|---|---|---|
| A | 34 | 247.8 | 28.4 | 0.61 | Bushveld Complex |
| B | 31 | 198.3 | 21.7 | 0.72 | Witwatersrand Sgp |
| C | 29 | 124.6 | 14.3 | 0.83 | Transvaal Sgp |
| D | 26 | 87.1 | 9.8 | 0.88 | Ventersdorp / Cover |
Table text extracted from the original PDF; superscript letters are shown inline. The original table image is below.
View original table image
References
21 in the original paper- U.S. Geological Survey. Mineral Commodity Summaries 2023: Rare Earths. USGS. 2023;Reston:132-133.
- Verplanck PL, Van Gosen BS, Seal RR, McCafferty AE. A Deposit Model for Carbonatite and Peralkaline Intrusion-Related Rare Earth Element Deposits. USGS Scientific Investigations Report. 2014;5070-J:1-58.
- Hale M, Plant JA. Drainage Geochemistry. Handbook of Exploration Geochemistry. 1994;6:1-766.
- Sadeghi M, Morris GA, Carranza EJM, Ladenberger A, Andersson M. Rare earth element distribution and mineralization in Sweden. Ore Geology Reviews. 2013;49:176-190.
- Cawthorn RG, Eales HV, Walraven F, Uken R, Watkeys MK. The Bushveld Complex. The Geology of South Africa. 2006;Johannesburg:261-281.
- Beukes NJ, Gutzmer J, Mukhopadhyay J. The geology and genesis of high-grade hematite iron ore deposits. Applied Earth Science. 2003;112(1):18-25.
- Dill HG. The chessboard classification scheme of mineral deposits. Earth-Science Reviews. 2010;100(14):1-420.
- Johnson MR, Anhaeusser CR, Thomas RJ. The Geology of South Africa. Geological Society of South Africa. 2006;Johannesburg:1-691.
- Potts PJ. A Handbook of Silicate Rock Analysis. Blackie and Son. 1987;Glasgow:1-622.
- Reimann C, Filzmoser P, Garrett RG. Background and threshold: critical comparison of methods of determination. Science of the Total Environment. 2005;346(1-3):1-16.
- McDonough WF, Sun SS. The composition of the Earth. Chemical Geology. 1995;120(3-4):223-253.
- R Core Team. R: A Language and Environment for Statistical Computing. R Foundation. 2023;Vienna.
- Reimann C, de Caritat P. Chemical Elements in the Environment. Springer-Verlag. 1998;Berlin:1-398.
- Taylor SR, McLennan SM. The Continental Crust: Its Composition and Evolution. Blackwell Scientific. 1985;Oxford:1-312.
- Cornell DH, Schütte SS, Eglington BL. The Ongeluk basaltic andesite formation in Griqualand West, South Africa. South African Journal of Geology. 1996;99(4):375-386.
- Carranza EJM. Geochemical Anomaly and Mineral Prospectivity Mapping in GIS. Elsevier. 2009;Amsterdam:1-351.
- Hawkes HE, Webb JS. Geochemistry in Mineral Exploration. 2nd ed. Academic Press. 1962;New York:1-415.
- Herrmann H, Nolde J, Berger S, Heise S. Aquatic ecotoxicity of lanthanum-a review and an attempt to derive freshwater and marine environmental quality criteria. Ecotoxicology and Environmental Safety. 2016;124:213-238.
- Kulaksiz S, Bau M. Anthropogenic gadolinium as a microcontaminant in tap water used as drinking water in urban areas. Applied Geochemistry. 2011;26(11):1877-1885.
- Plant JA, Tarney J, Hale M. Regional geochemistry of South Africa. Transactions of the Institution of Mining and Metallurgy. 1991;100:B51-B67.
- Nex PAM, Kinnaird JA, Ixer RA, Sherlock SC, Harris JW. The nature and origin of the platiniferous Merensky Reef. Canadian Mineralogist. 2006;44(6):1327-1358.