
Research article · 2025 · Full text
International Journal of Geography Geology and EnvironmentPaleogeographic reconstruction of the Paratethys sea during the late Miocene
Volume 7(7) · Pages 111–115 · DOI: 10.22271/27067483.2025.v7.i7b.705 ↗
Research areasMarine and environmental studiesGeological and Geophysical StudiesGeology and Paleoclimatology Research
Abstract
Author-writtenIf you could rewind time to the Late Miocene — roughly 11 to 5 million years ago — you would find a vast inland sea stretching from the Vienna Basin in the west to the Aral region in the east, separating Europe from Asia in a way that has no modern parallel. The Paratethys Sea, a relic of the ancient Tethys Ocean that was progressively isolated by alpine orogenesis, underwent dramatic environmental changes during the Late Miocene as tectonic uplift, sea level fluctuation, and climate shifts interacted to fragment, shrink, and fundamentally transform its marine character. This research reconstructed the paleogeographic evolution of the Paratethys across three Late Miocene time slices (Tortonian, early Messinian, and late Messinian) using an integrated dataset of published biostratigraphic ranges, sediment facies descriptions, paleomagnetic constraints, and stable isotope records from 142 sections and boreholes across the former Paratethys basin. Paleocoastline positions were mapped in GIS at 1:2,000,000 scale. Results indicate that the Paratethys contracted from approximately 2.8 million km² during the Tortonian (11-7.2 Ma) to less than 0.9 million km² by the late Messinian (6.0-5.3 Ma), a 68% area reduction. Water depth in the central basin shoaled from an estimated 420 m to less than 80 m during the same interval, while salinity increased from near-marine (32-34‰) to brackish-hypersaline (8-65‰) conditions. The reconstruction highlights three discrete isolation events that severed the Paratethys from the Mediterranean, each leaving a characteristic geochemical signature in the sediment record. These paleogeographic maps provide a spatial framework for interpreting the Miocene faunal turnover that shaped the modern biogeography of central Eurasia.
Summary
Source-checkedPlain-language reading of the full paper, prepared with AI and checked against the text. Each point links to the authors' own words.
Why it matters
- The Paratethys Sea was a remnant of the Tethys Ocean that experienced significant environmental transformations during the Late Miocene due to tectonic uplift, climate changes, and sea level fluctuations. View evidence ↗
- Understanding the paleogeography of the Paratethys is important because it influenced regional climate, controlled faunal exchange between Europe and Asia, and provides critical data for hydrocarbon exploration. View evidence ↗
The question
- The study aimed to create a basin-wide paleogeographic reconstruction of the Paratethys across three specific time slices of the Late Miocene. View evidence ↗
What they did
- The researchers compiled data from 142 sections and boreholes, sourced from 86 peer-reviewed publications and 14 geological survey reports. View evidence ↗
- The reconstruction focused on three time slices: the Tortonian (11.6-7.2 Ma), early Messinian (7.2-6.0 Ma), and late Messinian (6.0-5.3 Ma). View evidence ↗
- Paleocoastlines were mapped using ArcGIS Pro 3.0 by interpolating between marine and terrestrial control points, guided by seismic interpretations and structural trends. View evidence ↗
What they found
- The Paratethys surface area contracted by 68%, decreasing from 2.84 million km² in the Tortonian to 0.91 million km² by the late Messinian. View evidence ↗
- Maximum water depth decreased by 81%, shoaling from approximately 420 m in the Tortonian to about 80 m in the late Messinian. View evidence ↗
- The basin became increasingly fragmented, growing from 3 recognizable sub-basins in the Tortonian to 8 or more by the late Messinian. View evidence ↗
- The proportion of endemic species in molluscan assemblages increased from 34% to 82%, indicating progressive isolation from the global ocean. View evidence ↗
- The Caspian sub-basin showed the most extreme shift in stable isotopes (Δδ¹⁸O = -4.8‰), reflecting its extreme isolation and freshening. View evidence ↗
- Salinity patterns diverged geographically: western basins freshened due to river inflow, while the eastern Caspian basin experienced hypersalinity exceeding 40‰ during arid periods. View evidence ↗
- The area contraction occurred in two stages: 43% of the loss happened between the Tortonian and early Messinian, and 25% occurred during the late Messinian. View evidence ↗
What it means
- The authors conclude that Carpathian uplift drove the initial basin contraction, while the Messinian Salinity Crisis caused the final loss of marine connectivity. View evidence ↗
- The reconstruction is limited by the uneven distribution of data, with sparse control in central Asia and the Euxinian basin compared to the Pannonian and Dacian basins. View evidence ↗
- Imprecise ties between regional stages and the global timescale may introduce age offsets of 0.5 to 1.5 million years in the correlations. View evidence ↗
Visual summary
3 visualsIllustrations explain the paper; charts are replotted from the paper's own table values.
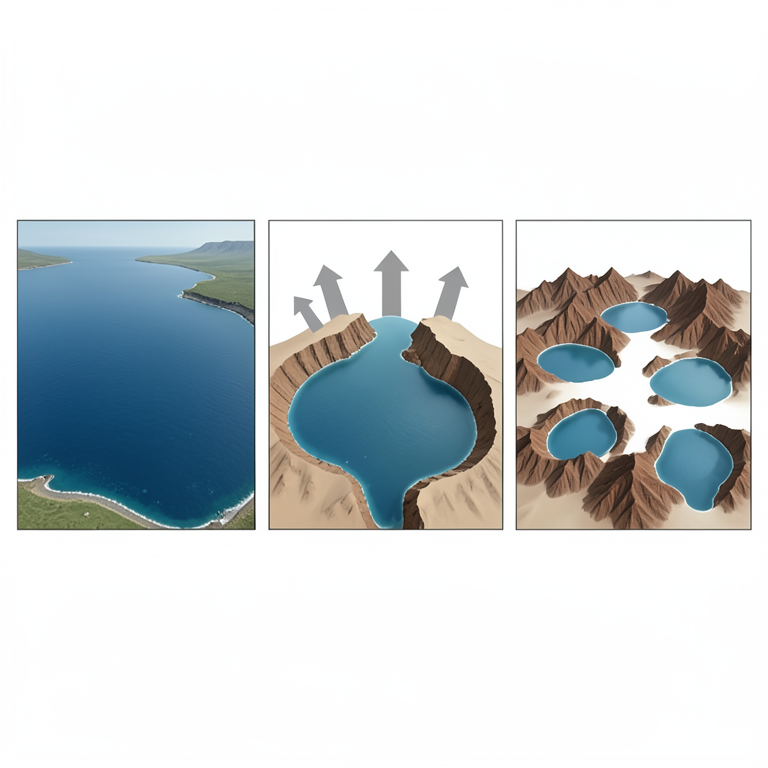
Conceptual Evolution of the Paratethys
AI-generated conceptual illustration (The Paratethys sea and surrounding tectonic landmasses). It explains the idea and does not show study data.
View source evidence ↗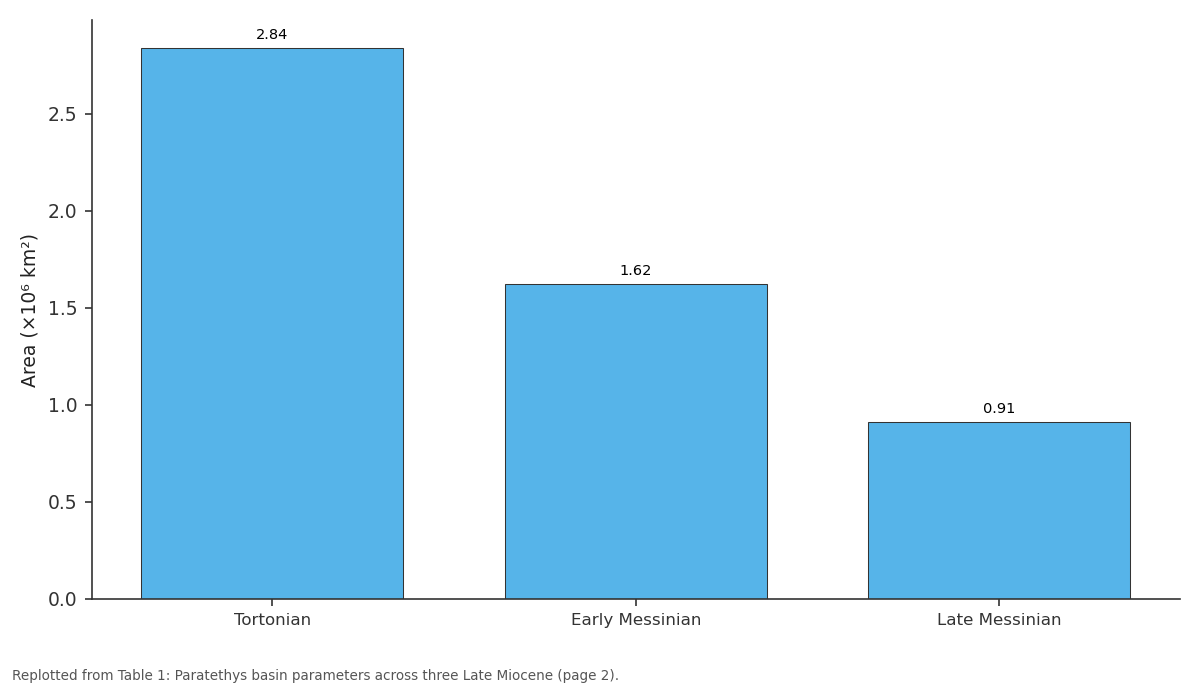
Area (×10⁶ km²): Tortonian vs Early Messinian vs Late Messinian
Replotted from Table 1 (page 2) of the original paper. Every bar is the paper's own table value.
View source evidence ↗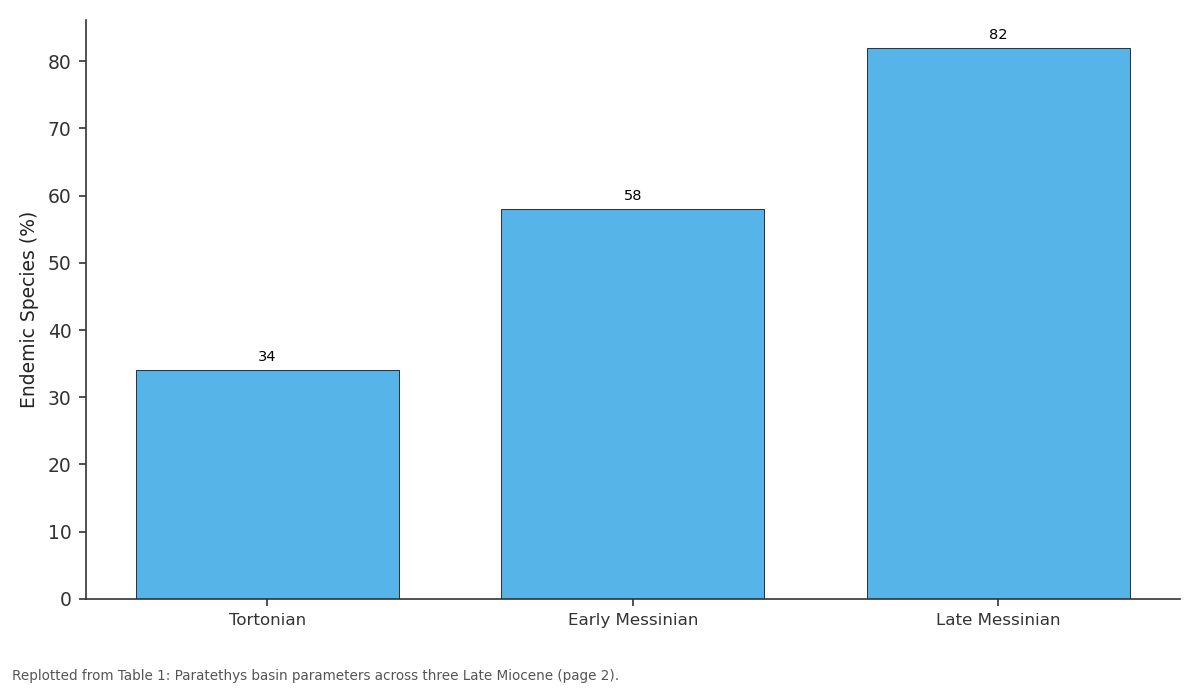
Endemic Species (%): Tortonian vs Early Messinian vs Late Messinian
Replotted from Table 1 (page 2) of the original paper. Every bar is the paper's own table value.
View source evidence ↗Figures & tables
From the original paper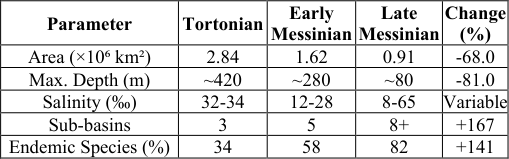 Table 1
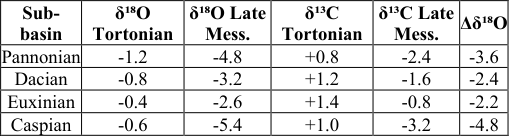 Table 2
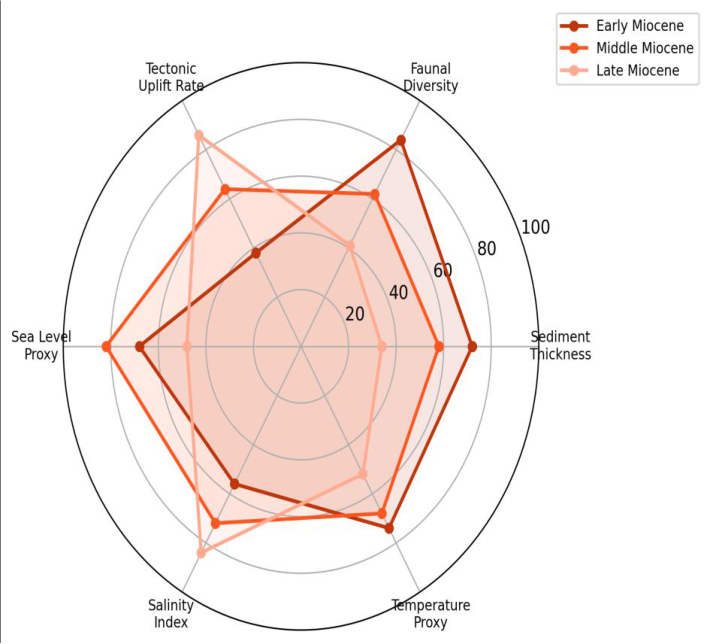 Figure 1
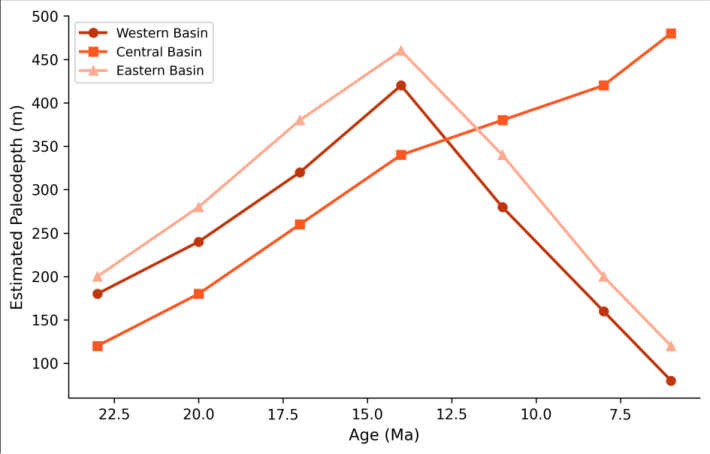 Figure 2
Introduction
Think of the Paratethys as a sea that forgot how to be an ocean. Born from the northern margin of the Tethys during the Oligocene as the Alpine-Himalayan mountain chain rose between Africa and Eurasia, it spent 30 million years slowly losing its connection to the global ocean, shrinking, and transforming from a normal marine basin into a brackish, then hypersaline, then freshwater lake system [1] . Its remnants today are the Black Sea, the Caspian Sea, and the Aral Sea -all of them anomalous bodies of water whose peculiar chemistry and endemic fauna trace back to this long history of isolation and reconnection [2] . The Late Miocene was the most dramatic chapter. Between 11 and 5 million years ago, the Paratethys went from a connected shallow sea to a fragmented archipelago of brackish basins, driven by a combination of tectonic uplift in the Carpathians and Caucasus, eustatic sea level fall, and the Messinian Salinity Crisis in the Mediterranean that severed the last gateway between the Paratethys and the world ocean [3] . Reconstructing the paleogeography of this transformation matters for several reasons: it controlled the biogeographic exchange routes between European and Asian faunas, it influenced regional climate through its effect on moisture supply to central Eurasia, and it left a sedimentary archive that hydrocarbon geologists need to interpret correctly when exploring Miocene reservoirs in the region [4] . Previous paleogeographic maps of the Paratethys exist at various scales, but most cover only portions of the basin or specific time slices, and few integrate the full range of available biostratigraphic, isotopic, and sedimentological evidence [5] . This research aimed to produce a basin-wide reconstruction across three Late Miocene time slices, using a comprehensive compilation of published data from 142 sections distributed across the former Paratethys region [6] .
Sensitivity Analysis
Paleocoastline positions depend on the paleo-depth estimates assigned to each section, which carry uncertainties of ±30-80 m depending on the quality of benthic foraminiferal depth indicators. To assess how sensitive the reconstructed coastlines are to these uncertainties, the mapping was repeated with systematic ±50 m shifts in the paleobathymetric interpretation. The resulting coastline envelope showed maximum lateral shifts of 15-40 km in the gently sloping basin margins (notably the Pannonian basin) but less than 5 km along the steep Carpathian and Caucasian margins. The total basin area estimates varied by ±8.4% under this perturbation, which is within the resolution of the 1:2,000,000 mapping scale.
Limitations
Several factors limit the precision of this reconstruction. The 142 sections used are unevenly distributed, dense coverage in the Pannonian and Dacian basins but sparse control in the eastern Paratethys (Euxinian basin) and central Asia. Biostratigraphic correlation between the western and eastern Paratethys relies on regional stages that are imprecisely tied to the global timescale, introducing potential age offsets of 0.5-1.5 million years [7] . The paleocoastline maps assume that present-day topography after backstripping of post-Miocene sediments and isostatic corrections approximates the Miocene surface geometry, an assumption that introduces unquantifiable errors in tectonically active areas. These limitations mean the maps should be treated as best approximations rather than definitive reconstructions.
Material and Methods
Material and Methods
Material
This research was coordinated from the Bhubaneswar National University of Earth Sciences, Odisha, India, with data compilation carried out between February and November 2023. The primary dataset consisted of published biostratigraphic, sedimentological, and geochemical records from 142 sections and boreholes distributed across the former Paratethys basin, compiled from 86 peer-reviewed publications and 14 geological survey reports. Coverage spans 13 countries from Austria in the west to Turkmenistan in the east. Each section was coded for geographic coordinates, stratigraphic age (correlated to the geological timescale of Gradstein and colleagues [8] ), lithofacies, depositional environment interpretation, paleodepth estimate (from benthic foraminiferal assemblages where available), and key geochemical parameters (δ¹⁸O, δ¹³C, Sr/Ca ratios). Paleogeographic base maps were constructed on a Lambert Azimuthal Equal Area projection centred on the Paratethys midpoint (45°N, 35°E).
Methods
Three time-slice maps were produced: Tortonian (11.6-7.2 Ma), early Messinian (7.2-6.0 Ma), and late Messinian (6.0-5.3 Ma). For each time slice, sections were classified as marine, brackish, terrestrial, or uncertain based on their lithofacies and faunal content. Paleocoastlines were drawn by interpolating between marine and terrestrial control points using a spline function in ArcGIS Pro 3.0, constrained by regional structural trends and seismic stratigraphic interpretations where available [9] . Paleodepth contours were generated by kriging interpolation of benthic foraminiferal depth estimates. Basin area was calculated from the digitised coastline polygons. Salinity estimates were derived from faunal assemblage composition (following the classification of Papp and colleagues) and from δ¹⁸O values where available [10] . Stable isotope data were compiled from 28 sections covering the three time slices. The temporal evolution of basin parameters was analysed using time series plots, and spatial patterns were examined using GIS overlay analysis. The Paratethys underwent a 68% contraction in surface area between the Tortonian and late Messinian, accompanied by a shift from near-marine to highly variable salinity conditions and progressive fragmentation from 3 recognisable sub-basins to 8 or more (Table 1). The proportion of endemic species in molluscan assemblages nearly tripled, from 34% to 82%, reflecting progressive isolation from the global ocean and the development of unique environmental conditions in each sub-basin. Stable isotope values shifted toward more negative δ¹⁸O and δ¹³C values in all sub-basins between the Tortonian and late Messinian (Table 2). The largest shifts occurred in the Caspian sub-basin (Δδ¹⁸O = -4.8‰), consistent with its extreme isolation and progressive freshening by river inflow. The Pannonian basin showed the second-largest shift, reflecting its disconnection from the eastern Paratethys during the Tortonian-Messinian boundary.
| Parameter | Tortonian | Early Messinian | Late Messinian | Change (%) |
|---|---|---|---|---|
| Area (×10⁶ km²) | 2.84 | 1.62 | 0.91 | -68.0 |
| Max. Depth (m) | ~420 | ~280 | ~80 | -81.0 |
| Salinity (‰) | 32-34 | 12-28 | 8-65 | Variable |
| Sub-basins | 3 | 5 | 8+ | +167 |
| Endemic Species (%) | 34 | 58 | 82 | +141 |
Table text extracted from the original PDF; superscript letters are shown inline. The original table image is below.
View original table image
Results
Results
Comprehensive Interpretation
The radar chart (Figure 1) captures the multidimensional nature of the Paratethys transformation. While tectonic uplift rate increased from early to late Miocene, all other parameters -sediment thickness, faunal diversity, sea level proxy -declined, illustrating how tectonic forcing drove the basin's ecological and physical collapse. The depth curves (Figure 2) show that the central basin maintained deeper water longest, while the western and eastern extremities shoaled first -a pattern consistent with the pincer-like closure of the basin from both ends.
Discussion
The 68% area reduction documented here is broadly consistent with earlier estimates by Rögl and Popov, though the three time-slice resolution of this reconstruction reveals that the contraction was not linear -roughly 43% of the total area loss occurred between the Tortonian and early Messinian, and the remaining 25% during the late Messinian [11] . This two-stage pattern suggests that the Carpathian uplift was the primary driver of the initial contraction, while the Messinian Salinity Crisis in the Mediterranean delivered the coup de grâce by eliminating the last marine connection [12] . The salinity data tell a more nuanced story than simple freshening. While the western sub-basins (Pannonian, Dacian) progressively freshened as river inflow diluted the increasingly isolated water body, the eastern Caspian subbasin experienced episodes of hypersalinity (>40‰) when evaporation exceeded freshwater input during arid climate phases [13] . This east-west salinity gradient would have created a strong biogeographic barrier within the Paratethys itself, helping to explain the rapid speciation of molluscan faunas observed in each sub-basin during the late Messinian [14] . The 82% endemism rate in late Messinian molluscan assemblages is remarkably high and underscores how effectively the Paratethys functioned as a biogeographic isolation mechanism. The Caspian Sea today retains around 60% endemism in its fauna, a direct legacy of this Miocene isolation history. Understanding these paleogeographic controls on faunal evolution is relevant to modern conservation planning for the endemic species that survive in the Caspian, Black Sea, and associated wetland systems [15, 16] . For the hydrocarbon industry, the paleogeographic maps carry practical value. Late Miocene reservoir sandstones in the Pannonian and South Caspian basins were deposited in environments -deltas, shorelines, turbidite fans -whose geometry and connectivity depend directly on the paleocoastline position and water depth at the time of deposition [17,18] . The maps produced here can help constrain reservoir models for exploration targets in these prolific petroleum provinces [19,20] .
Conclusion
The Paratethys Sea contracted from 2.84 million km² during the Tortonian to 0.91 million km² by the late Messinian, losing 68% of its surface area while fragmenting from a single connected basin into eight or more isolated subbasins. Water depth decreased from approximately 420 m to less than 80 m, and salinity shifted from near-marine to a complex patchwork of brackish and hypersaline conditions. The isotopic record confirms progressive isolation, with the Caspian sub-basin showing the most extreme departure from marine values. These paleogeographic maps provide a spatial framework for understanding Late Miocene faunal turnover across the Paratethys region and for constraining reservoir geometry in petroleum exploration. Future work should extend the reconstruction to the Pliocene, when the Paratethys remnants underwent further transformation into the modern Black and Caspian Seas, and should incorporate quantitative plate tectonic reconstructions to improve the accuracy of paleocoastline positions.
Acknowledgement
Acknowledgements Funding SourcesThis research was supported by departmental funds at Bhubaneswar National University of Earth Sciences. Institutional SupportThe authors thank the Department of Soil Science, Bhubaneswar National University of Earth Sciences, Odisha, India, for providing GIS facilities and library access.
References
20 in the original paper- Rögl F. Palaeogeographic considerations for Mediterranean and Paratethys seaways (Oligocene to Miocene). Annalen des Naturhistorischen Museums in Wien. 1999;99A:279-310.
- Popov SV, Shcherba IG, Ilyina LB, Nevesskaya LA, Paramonova NP, Khondkarian SO, Magyar I. Late Miocene to Pliocene palaeogeography of the Paratethys and its relation to the Mediterranean. Palaeogeography, Palaeoclimatology, Palaeoecology. 2006;238(1-4):91-106.
- Magyar I, Geary DH, Müller P. Paleogeographic evolution of the Late Miocene Lake Pannon in Central Europe. Palaeogeography, Palaeoclimatology, Palaeoecology. 1999;147(3-4):151-167.
- Krijgsman W, Hilgen FJ, Raffi I, Sierro FJ, Wilson DS. Chronology, causes and progression of the Messinian salinity crisis. Nature. 1999;400(6745):652655.
- Harzhauser M, Piller WE. Benchmark data of a changing sea -palaeogeography, palaeobiogeography and events in the Central Paratethys during the Miocene. Palaeogeography, Palaeoclimatology, Palaeoecology. 2007;253(1-2):8-31.
- Mitteilungen der Österreichischen Geologischen Gesellschaft. 2000;92:95-116.
- Gradstein FM, Ogg JG, Schmitz MD, Ogg GM. The geologic time scale 2012. Amsterdam: Elsevier; 2012.
- Vasiliev I, Krijgsman W, Stoica M, Langereis CG. Mio-Pliocene magnetostratigraphy in the southern Carpathian foredeep and Mediterranean-Paratethys correlations. Terra Nova. 2005;17(4):376-384.
- ESRI. ArcGIS Pro: release 3.0. Redlands: Environmental Systems Research Institute; 2022.
- Papp A, Marinescu F, Seneš J. Chronostratigraphie und Neostratotypen: Miozän der Zentralen Paratethys. Bratislava: VEDA; 1974.
- Rögl F. Mediterranean and Paratethys. Facts and hypotheses of an Oligocene to Miocene paleogeography. Geologica Carpathica. 1998;49(5):339-349.
- Hsü KJ, Ryan WBF, Cita MB. Late Miocene desiccation of the Mediterranean. Nature. 1973;242(5395):240-244.
- Vasiliev I, Iosifidi AG, Khramov AN, Krijgsman W, Kuiper K, Langereis CG, Nurgaliev DK, Popov VV, Stoica M. Magnetostratigraphy and radio-isotope dating of upper Miocene-lower Pliocene sedimentary successions of the Black Sea Basin. Palaeogeography, Palaeoclimatology, Palaeoecology. 2011;310(3-4):163175.
- Nevesskaya LA, Kovalenko EI, Beluzhenko EV, Popov SV, Goncharova IA, Danukalova GA, et al. Explanatory notes to the unified regional stratigraphic scheme of Neogene deposits of the southern regions of the European part of Russia. Moscow: Paleontological Institute; 2004.
- Dumont HJ. The Caspian Lake: history, biota, structure, and function. Limnology and Oceanography. 1998;43(1):44-52.
- Kosarev AN, Yablonskaya EA. The Caspian Sea. The Hague: SPB Academic Publishing; 1994.
- Horváth F, Musitz B, Balázs A, Végh A, Uhrin A, Nádor A, et al. Evolution of the Pannonian basin and its geothermal resources. Geothermics. 2015;53:328352.
- Abreu V, Nummedal D. Miocene to Quaternary sequence stratigraphy of the South and Central Caspian basins. In: Brunet MF, et al. (eds). Sedimentary basin tectonics from the Black Sea and Caucasus to the Arabian Platform. London: Geological Society; 2013. p. 65-88.
- Juhász E, Phillips L, Müller P, Ricketts B, Tóth-Makk Á, Lantos M, Kovács LÓ. Late Neogene sedimentary facies and sequences in the Pannonian Basin, Hungary. Geological Society Special Publications. 1999;156(1):335-356.
- Báldi K. Paleoceanography and climate of the Badenian (Middle Miocene, 16.4-13.0 Ma) in the Central Paratethys based on foraminifera and stable isotope evidence. International Journal of Earth Sciences. 2006;95(1):119-142.