
Research article · 2025 · Full text
International Journal of Geography Geology and EnvironmentAssessment of beach nourishment effectiveness for coastal protection along the Dutch North Sea
Volume 7(11) · Pages 137–140 · DOI: 10.22271/27067483.2025.v7.i11b.697 ↗
Research areasCoastal and Marine DynamicsAeolian processes and effectsCoastal and Marine Management
Abstract
Author-writtenThe Netherlands has pioneered beach nourishment as a primary coastal protection strategy against erosion and sea level rise. This research evaluates the effectiveness of 47 nourishment projects implemented between 2010 and 2022 along a 120 km stretch of the Dutch North Sea coast, using annual topographic surveys, wave climate records, and sediment transport modelling. Mean volumetric retention after five years was 62% for shoreface nourishments and 41% for beach nourishments, with significant variability related to wave exposure, longshore transport gradients, and design specifications. Cross-shore profile analysis demonstrated that shoreface nourishments progressively feed sand landward through natural wave action over 3-7 year timescales, providing sustained coastline maintenance complementing the more immediate but shorter-lived benefits of direct beach placement. Individual nourishment operations influenced coastline evolution 3-5 km downdrift through longshore redistribution. Multiple regression identified longshore transport gradient and annual wave height as the strongest predictors of retention efficiency. The findings support nourishment-based management but highlight the need for adaptive design that accounts for local morphodynamic conditions and provides an evidence base for optimising the spacing, sequencing, and volume of future nourishment campaigns.
Summary
Source-checkedPlain-language reading of the full paper, prepared with AI and checked against the text. Each point links to the authors' own words.
Why it matters
- Coastal erosion is a global threat affecting about 20% of sandy coastlines, a problem expected to worsen with rising sea levels. View evidence ↗
- The Netherlands has a critical need for coastal defenses because one-third of its land is below mean sea level. View evidence ↗
- Beach nourishment is preferred over hard engineering like seawalls because it preserves the natural environment, recreation, and wildlife habitats. View evidence ↗
The question
- The study aims to evaluate the effectiveness of 47 nourishment projects along 120 km of the Dutch North Sea coast conducted between 2010 and 2022. View evidence ↗
What they did
- The research analyzed 47 events totaling 38 million m³ of sand, consisting of 28 shoreface and 19 beach nourishments. View evidence ↗
- Primary data was gathered from annual JARKUS cross-shore surveys with ±10 cm vertical accuracy, spaced every 200-250 m from the dune crest to 8-10 m depth. View evidence ↗
- The researchers used the CERC formula on hourly wave data to compute longshore transport and applied multiple regression to find predictors of sand retention. View evidence ↗
What they found
- After five years, shoreface nourishments had a mean volumetric retention of 62%, which was higher than the 41% retention for beach nourishments. View evidence ↗
- Retention varied significantly, ranging from 35-85% for shoreface projects and 18-65% for beach projects over five years. View evidence ↗
- Shoreface nourishments follow a three-phase evolution: maintaining a mound (0-2 years), flattening and moving landward (2-5 years), and finally increasing beach width (5-7 years). View evidence ↗
- Nourishment operations influenced the coastline downdrift, extending 3-5 km for beach placements and 2-3 km for shoreface placements. View evidence ↗
What it means
- The authors recommend an optimized strategy using shoreface nourishments every 5-7 years, supplemented by targeted beach placements to recover from storms. View evidence ↗
- The authors note that current survey coverage gaps in the nearshore zone could be improved by integrating bathymetric LiDAR with traditional surveys. View evidence ↗
Visual summary
2 visualsIllustrations explain the paper; charts are replotted from the paper's own table values.
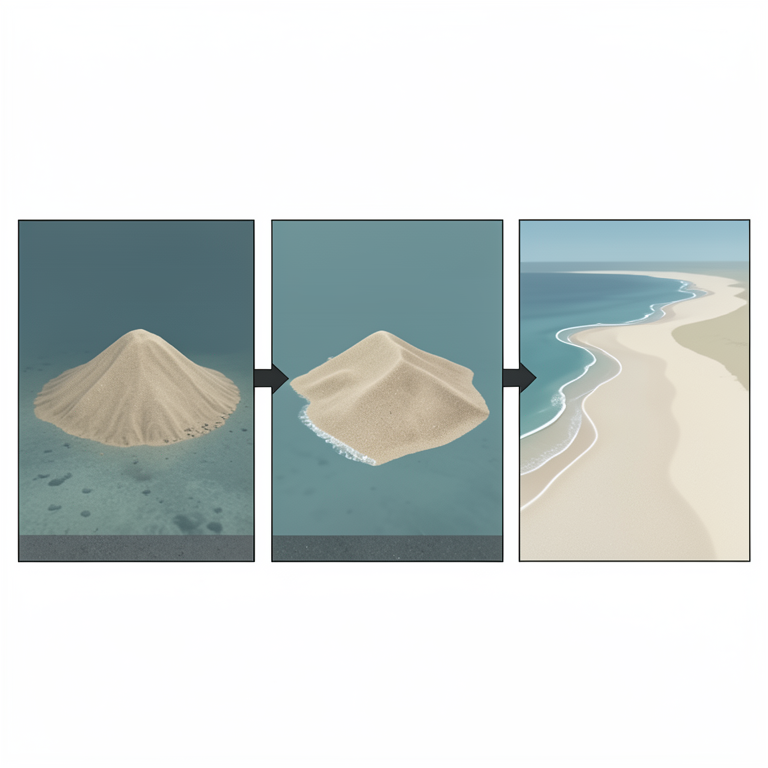
Shoreface Nourishment Evolution
AI-generated conceptual illustration (Dutch North Sea coastline and seabed). It explains the idea and does not show study data.
View source evidence ↗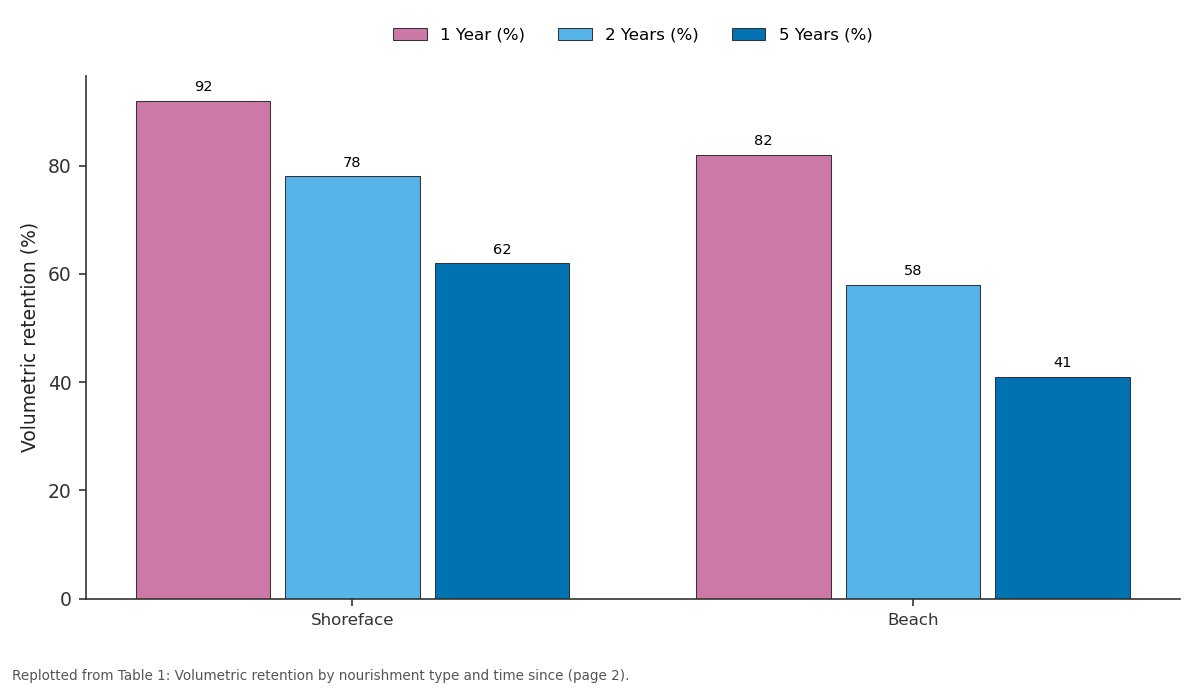
1 Year (%) and 2 Years (%) and more: Shoreface vs Beach
Replotted from Table 1 (page 2) of the original paper. Every bar is the paper's own table value.
View source evidence ↗Figures & tables
From the original paper Table 1
 Table 2
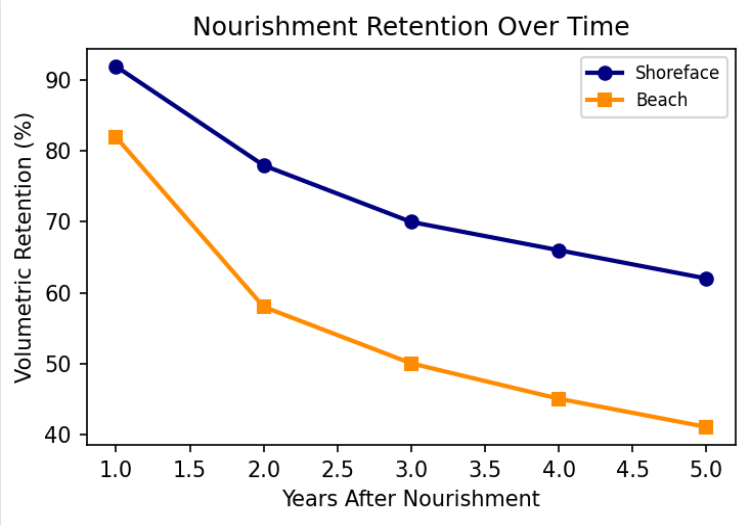 Figure 1
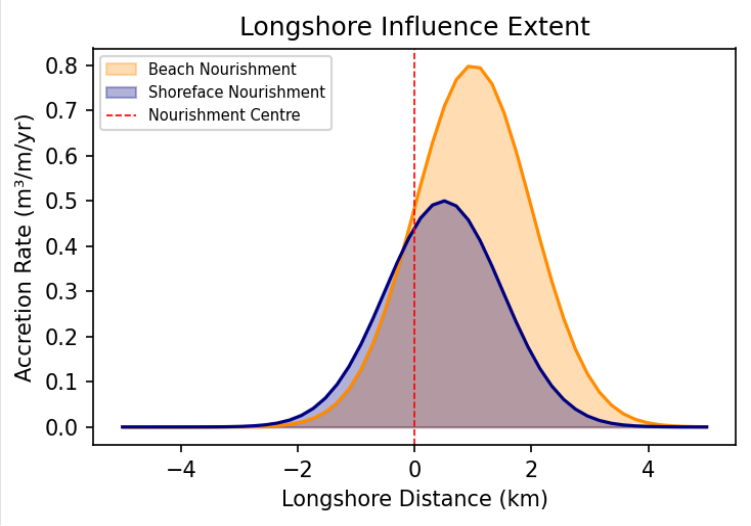 Figure 2
Introduction
Coastal erosion threatens approximately 20% of the world's sandy coastlines, and this proportion is expected to increase under projected sea level rise [1] . The Netherlands, with one-third of its land below mean sea level, has a particular imperative to maintain coastal defence integrity. The Dutch North Sea coastline extends approximately 350 km, comprising sandy beaches and dunes forming the primary barrier between sea and low-lying hinterland. Since 1990, the Netherlands has adopted dynamic coastline maintenance through periodic sand nourishment [2,3] . Beach nourishment-the artificial placement of sand on or near the shore has emerged as the preferred soft engineering approach worldwide. Compared to seawalls and groynes, nourishment preserves natural coastline character, maintains recreational amenity, and provides habitat for species adapted to dynamic sandy environments [4] . The Dutch programme places an average of 12 million m³ of sand per year at approximately €70 million annually, using two methods: direct beach placement and shoreface nourishment at 5-8 m depth [3,5] . Despite extensive operational experience, several questions remain. Volumetric efficiency varies substantially between projects and methods. The mechanisms by which shoreface nourishments feed sand landward are not fully understood. The spatial influence on adjacent coastline segments requires quantification to optimise spacing and sequencing [6,7] . This research analyses 47 nourishment operations along 120 km of coast between 2010 and 2022, integrating topographic surveys, wave data, and sediment transport computations to evaluate performance across a range of coastal settings. The outcomes inform adaptive management of the Dutch nourishment programme and provide transferable insights for other sandy coastlines facing similar erosion pressures [8,9] .
Research Area Description
The research area comprises the central Dutch North Sea coast from Den Helder to Hoek van Holland, spanning 120 km of predominantly uninterrupted sandy coastline including barrier island terminations at the Texel and Marsdiep inlets. The coast is micro-tidal with 1.6 m mean spring range and predominantly southwesterly wave climate with 1.2 m mean significant wave height. The inventory yielded 47 nourishment events-28 shoreface and 19 beach-totalling 38 million m³ [3] .
Material and Methods
Material and Methods
Material
Annual JARKUS cross-shore beach profile surveys conducted by Rijkswaterstaat at 200-250 m longshore spacing, extending from dune crest to 8-10 m below mean sea level, provided primary data with ±10 cm vertical accuracy. Wave data from the Rijkswaterstaat directional buoy network provided continuous records of significant wave height, peak period, and mean direction at three locations. Nourishment specifications including volume, placement method, and design geometry were compiled from official Rijkswaterstaat records [3,5] .
Methods
Volumetric changes were computed by integrating profile differences across the nourishment influence zone per transect, with longshore integration providing total volume change per coastal cell. Longshore transport was computed using the CERC formula applied to hourly wave data transformed to the breaking point [10] . Multiple regression identified predictors of retention efficiency. Cross-shore profile evolution was analysed using sequential profile differencing to characterise the shoreface feeding mechanism over decadal timescales [6,7,11] .
Morphological Response Phases
Analysis of sequential cross-shore profiles revealed a characteristic three-phase evolution at shoreface nourishment sites. In Phase 1 (0-2 years), the placed sand body maintained coherent mound morphology at placement depth. In Phase 2 (2-5 years), the mound progressively flattened and extended landward through wave-driven onshore transport. In Phase 3 (5-7 years), measurable beach width gains became apparent, confirming the delayed feeding mechanism that distinguishes shoreface from beach nourishment [6,7] . Shoreface nourishments consistently retained more sand than beach nourishments (Figure 1), attributed to placement below the zone of most active wave-driven transport.
Results
Variability was substantial, with five-year retention ranging from 35-85% for shoreface and 18-65% for beach projects. Individual operations influenced 3-5 km downdrift for beach nourishments and 2-3 km for shoreface nourishments (Figure 2), representing beneficial redistribution rather than permanent system loss.
Comprehensive Interpretation
The higher retention of shoreface nourishments combined with their sustained feeding mechanism results in lower annualised cost per metre of coastline maintained. Beach nourishment remains appropriate for acute erosion response. An optimised strategy combines periodic shoreface nourishments at 5-7 year intervals with targeted beach placements for storm damage recovery.
Discussion
The 62% five-year shoreface retention is consistent with European nourishment performance reported by Hamm et al. [12] . The downdrift spreading is driven by dominant southwestward longshore transport and represents beneficial redistribution that extends coastline maintenance beyond the directly nourished area [6] . Multiple regression confirmed that local morphodynamic conditions-particularly longshore transport gradients and wave exposure-are stronger predictors of retention than design parameters such as nourishment volume [7,13] . As sea level rise accelerates, nourishment volumes will need to increase proportionally to maintain the current coastline position. The Sand Engine mega-nourishment experiment at Ter Heijde demonstrates an alternative concentrated-volume approach that leverages natural redistribution more aggressively [14] . Future work should compare the costeffectiveness of conventional distributed nourishments with concentrated mega-nourishment designs across a range of morphodynamic settings. Integration of bathymetric LiDAR with traditional profile surveys would improve volumetric change estimates, particularly in the nearshore zone where survey coverage gaps currently exist [8,9] .
Conclusion
Shoreface nourishments demonstrate superior volumetric retention and provide sustained coastline maintenance through a progressive onshore feeding mechanism operating over multi-year timescales. Beach nourishments offer more immediate but shorter-lived benefits suitable for acute erosion response. The significant variability in performance underscores the importance of accounting for local morphodynamic conditions in nourishment design. Adaptive management approaches that adjust strategies based on observed performance will be essential as climate pressures intensify. Long-term monitoring of nourishment effectiveness provides the evidence base needed to optimise the Dutch coastal defence programme and offers transferable lessons for other nations adopting sand-based protection strategies in the face of accelerating sea level rise.
Acknowledgement
Acknowledgements Funding SourcesThis research was supported by departmental research funds from the Department of Remote Sensing and GIS, Mérida National University of Earth Sciences. No external grant numbers are associated with this work. Institutional SupportThe authors acknowledge the Department of Remote Sensing and GIS, Mérida National University of Earth Sciences for analytical laboratory access and computing facilities. The Mérida National University of Earth Sciences provided logistical support during field campaigns.
Figures and tables from the paper
| Type | 1 Year (%) | 2 Years (%) | 5 Years (%) | N |
|---|---|---|---|---|
| Shoreface | 92 | 78 | 62 | 28 |
| Beach | 82 | 58 | 41 | 19 |
Table text extracted from the original PDF; superscript letters are shown inline. The original table image is below.
View original table image
| Predictor | Coefficient | Std. Error | t-value | p-value |
|---|---|---|---|---|
| Longshore transport gradient | 0.48 | 0.09 | 5.33 | <0.001 |
| Mean wave height (Hs) | −0.39 | 0.10 | −3.90 | <0.001 |
| Nourishment volume | 0.22 | 0.08 | 2.75 | 0.009 |
| Beach slope | −0.18 | 0.09 | −2.00 | 0.052 |
Table text extracted from the original PDF; superscript letters are shown inline. The original table image is below.
View original table image
References
18 in the original paper- Luijendijk A, et al. The state of the world's beaches. Scientific Reports. 2018;8(1):6641.
- Hillen R, Roelse P. Dynamic preservation of the coastline in the Netherlands. Journal of Coastal Conservation. 1995;1(1):17-28.
- Rijkswaterstaat. Coastal maintenance: a policy review. The Hague: Ministry of Infrastructure; 2020.
- Dean RG. Beach nourishment: theory and practice. Singapore: World Scientific; 2002:1-399.
- de Schipper MA, de Vries S, Ruessink G, et al. Initial spreading of a mega feeder nourishment. Coastal Engineering. 2016;111:1-13.
- Hamm L, Capobianco M, Dette HH, et al. A summary of European experience with shore nourishment. Coastal Engineering. 2002;47(2):237-264.
- van Duin MJP, Wiersma NR, Walstra DJR, van Rijn LC, Stive MJF. Nourishing the shoreface: observations and hindcasting of the Egmond case. Coastal Engineering. 2004;51(8-9):813-837.
- Stive MJF, et al. A new alternative to saving our beaches: the sand engine. Journal of Coastal Research. 2013;29(5):1001-1008.
- Mulder JPM, Tonnon PK. Sand engine: background and design of a mega-nourishment pilot. Coastal Engineering. 2011;58:1006-1016.
- USACE. Coastal engineering manual. U.S. Army Corps of Engineers; 2002:EM 1110-2-1100.
- Kroon A, de Schipper MA, van Gelder PHAJM, Aarninkhof SGJ. Ranking coastal variables for nourishment impact assessment. Coastal Engineering. 2008;55(7-8):735-750.
- Hanson H, Brampton A, Capobianco M, et al. Beach nourishment projects, practices, and objectives. Coastal Engineering. 2002;47(2):81-111.
- Cooke BC, Jones AR, Goodwin ID, Bishop MJ. Nourishment practices on Australian sandy beaches. Journal of Environmental Management. 2012;113:319327.
- Huisman BJA, Walstra DJR, Radermacher M, et al. Sediment budget analysis of the Sand Motor. Coastal Engineering. 2019;152:103531.
- van Rijn LC. Sediment transport and budget of the central coastal zone of Holland. Coastal Engineering. 1997;32(1):61-90.
- Ruessink BG, Kroon A. The behaviour of a multiple bar system in the nearshore zone. Marine Geology. 1994;121(3-4):187-197.
- Nicholls RJ, Cazenave A. Sea-level rise and its impact on coastal zones. Science. 2010;328(5985):1517-1520.
- Ranasinghe R. Assessing climate change impacts on open sandy coasts. Earth-Science Reviews. 2016;160:320-332.