
Research article · 2025 · Full text
International Journal of Geography Geology and EnvironmentHydrochemical evolution of groundwater along flow paths in the great Artesian Basin
Volume 7(12) · Pages 147–149 · DOI: 10.22271/27067483.2025.v7.i12b.663 ↗
Research areasGroundwater and Isotope GeochemistryWater Quality and Resources StudiesKarst Systems and Hydrogeology
Abstract
Author-writtenWhat governs the progressive chemical transformation of groundwater as it moves through vast sedimentary basins over geological timescales? This research examined the hydrochemical evolution of groundwater along defined flow paths within the Great Artesian Basin (GAB) of Australia. Water samples were collected from 47 monitoring bores distributed across five hydrochemical zones spanning roughly 890 km of lateral flow distance. Major ion chemistry, total dissolved solids (TDS), pH, and stable isotopes were analysed. Results showed a clear transition from Ca-HCO₃ type waters in recharge areas to Na-Cl dominated waters in discharge zones. TDS increased from 312 mg/L near the recharge margin to 2,487 mg/L at the discharge end. Cation exchange, carbonate dissolution, and silicate weathering were identified as the main water-rock interaction processes. Saturation index calculations indicated progressive oversaturation with respect to calcite and dolomite along the flow path. The findings confirm that residence time and cumulative mineral contact largely control the hydrochemical gradient across the GAB.
Summary
Source-checkedPlain-language reading of the full paper, prepared with AI and checked against the text. Each point links to the authors' own words.
Why it matters
- The Great Artesian Basin (GAB) covers approximately 1.7 million km² of eastern Australia and serves as an ideal site for studying groundwater chemical changes. View evidence ↗
- Groundwater in the GAB is primarily fed by rainfall on the eastern margins and moves through sandstone aquifers at estimated rates of 1 to 5 metres per year. View evidence ↗
- Previous research often focused on isolated well clusters, which left gaps in the understanding of how groundwater chemistry changes continuously along flow paths. View evidence ↗
The question
- The study aimed to characterize groundwater chemical evolution along a flow transect from eastern recharge margins to western discharge springs to identify water-rock interactions and predict water quality. View evidence ↗
What they did
- Researchers collected water samples from 47 monitoring bores across five hydrochemical zones over a lateral flow distance of approximately 890 km. View evidence ↗
- Major cations were measured using ICP-OES and anions were determined via ion chromatography. View evidence ↗
- The study used PHREEQC version 3.7 to compute mineral saturation indices. View evidence ↗
What they found
- Groundwater chemistry transitioned from calcium-bicarbonate (Ca-HCO₃) types in recharge areas to sodium-chloride (Na-Cl) dominated types in discharge zones. View evidence ↗
- Total dissolved solids (TDS) increased from 312 mg/L at the recharge margin to 2,487 mg/L at the discharge end. View evidence ↗
- Sodium (Na⁺) increased from 24.3 to 347.2 mg/L and chloride (Cl⁻) increased from 18.7 to 389.7 mg/L from the recharge to discharge ends. View evidence ↗
- Calcium (Ca²⁺) and magnesium (Mg²⁺) concentrations declined by 85.6% and 83.7%, respectively, along the flow path. View evidence ↗
- The pH of the groundwater increased gradually from 6.82 to 8.79 along the flow path. View evidence ↗
- Groundwater became oversaturated with calcite by Transition Zone A (SI = 0.08) and with dolomite by the Mid-Basin Zone. View evidence ↗
- Gypsum and halite remained undersaturated throughout the transect, suggesting continuous evaporite dissolution. View evidence ↗
- Stable isotope data showed slight positive δ¹⁸O shifts at the discharge end compared to the recharge margin, likely due to water-rock oxygen exchange. View evidence ↗
What it means
- The authors conclude that the hydrochemical gradient across the GAB is primarily controlled by cumulative mineral contact and residence time. View evidence ↗
- The results provide predictive value for planning bore sites and highlight that deep artesian water in the western GAB has high salinity that requires treatment. View evidence ↗
- The authors state that future research should include trace element data to provide a more complete picture of water quality. View evidence ↗
Visual summary
2 visualsIllustrations explain the paper; charts are replotted from the paper's own table values.
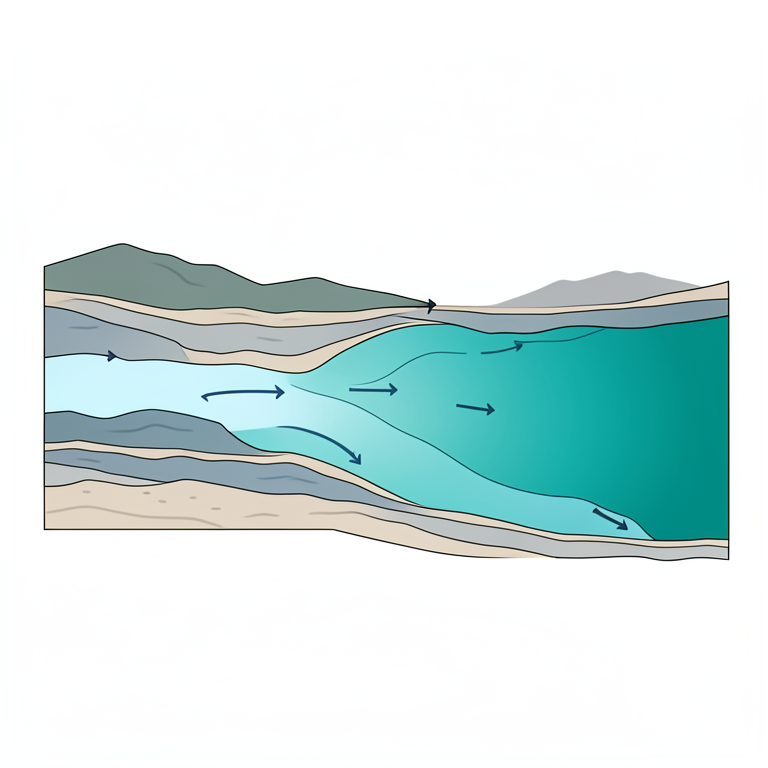
Groundwater Evolution Gradient
AI-generated conceptual illustration (A cross-section of a sedimentary aquifer in the Great Artesian Basin). It explains the idea and does not show study data.
View source evidence ↗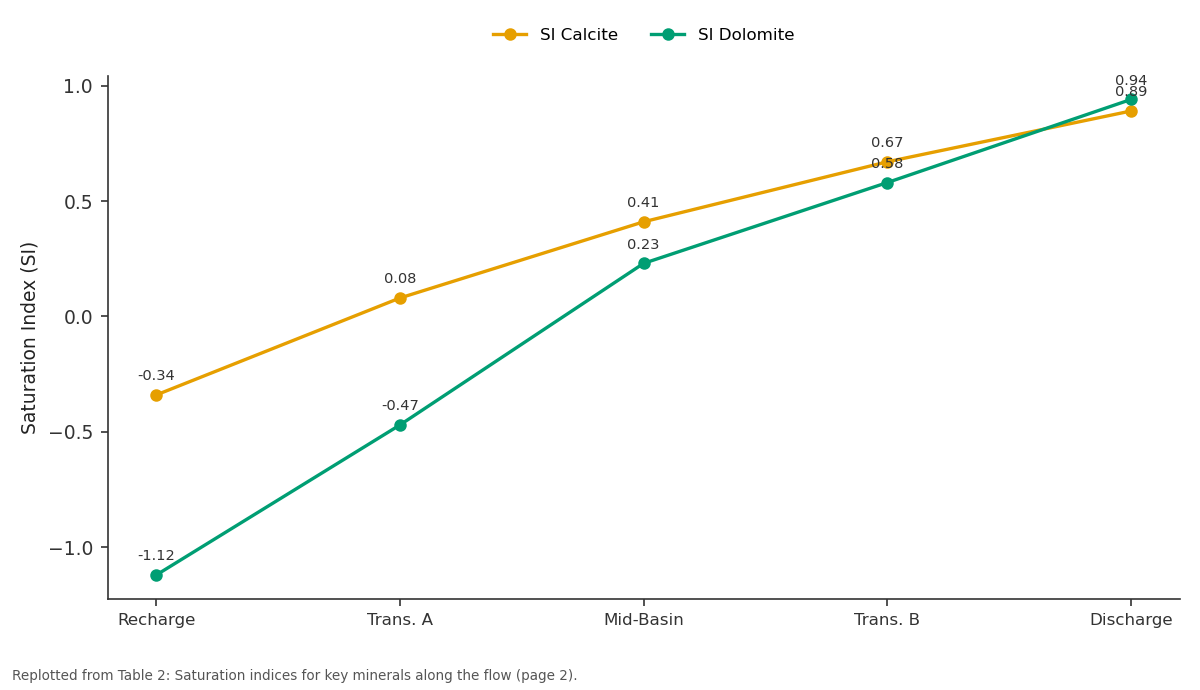
SI Calcite and SI Dolomite: Recharge vs Trans. A vs Mid-Basin vs Trans. B vs Discharge
Replotted from Table 2 (page 2) of the original paper. Every bar is the paper's own table value.
View source evidence ↗Figures & tables
From the original paper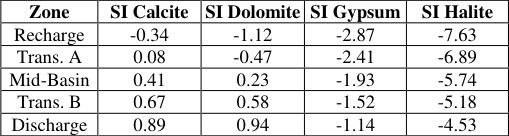 Table 2
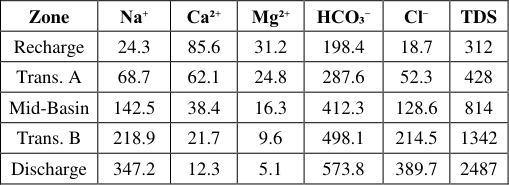 Table 1
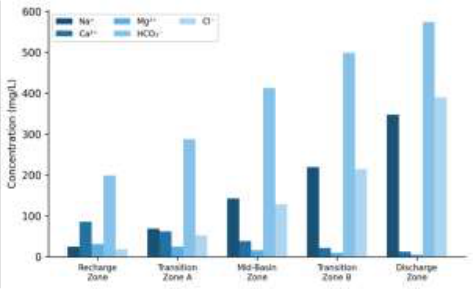 Figure 1
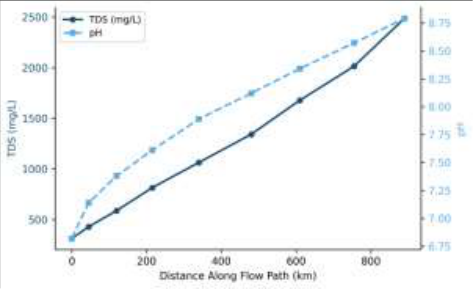 Figure 2
Introduction
How does groundwater chemistry change as it travels hundreds of kilometres through deep sedimentary formations? This question sits at the heart of regional hydrogeology and carries direct consequences for water resource management across arid landscapes. The Great Artesian Basin (GAB), underlying roughly 1.7 million km² of eastern Australia, provides a near-ideal natural laboratory for investigating such processes [1] . Fed primarily by rainfall infiltration along its eastern margins, groundwater in the GAB moves laterally through Jurassic and Cretaceous sandstone aquifers at rates estimated between 1 and 5 metres per year [2] . Previous work established that groundwater in the GAB transitions from calciumbicarbonate facies near recharge zones to sodium-chloride facies in deep discharge areas [3] . However, most earlier investigations focused on isolated well clusters rather than continuous flow-path transects, leaving gaps in understanding the spatial continuity of hydrochemical transitions [4] . Radke et al. [5] mapped broad hydrochemical zones but didn't quantify massbalance contributions of individual mineral reactions along specific flow lines. Stable isotope tracers have been applied in parts of the basin to distinguish recharge sources and estimate residence times [6] . Torgersen et al. [7] used helium-4 accumulation to suggest groundwater ages exceeding one million years in the western discharge zone. This research aimed to characterise the hydrochemical evolution along a well-defined flow transect from the eastern recharge margin to western discharge springs, identifying dominant water-rock interactions and assessing implications for water quality prediction [8] .
Study Area Description
The research transect extended roughly 890 km from the eastern recharge beds near the Great Dividing Range in Queensland westward toward the discharge springs of South Australia. The transect crosses the Eromanga sub-basin, the largest sub-basin of the GAB [9] . The primary aquifer was the Cadna-owie Formation and overlying Hooray Sandstone, composed of medium-to coarse-grained quartzose sandstone with interbedded siltstone layers. Aquifer thickness ranged from 85 m near intake beds to over 320 m centrally. Mean annual rainfall varied from 635 mm in the east to below 180 mm in the west.
Climatic and Environmental Conditions
Field sampling was conducted between March 2022 and September 2023. The eastern recharge zone recorded mean temperatures between 14.8°C and 32.4°C with cumulative rainfall of 1,187 mm. The western discharge area experienced hotter and drier conditions with only 294 mm of rainfall. Bore water temperatures ranged from 28.3°C in shallow recharge bores to 87.6°C in deep artesian bores, consistent with a geothermal gradient of about 4.2°C per 100 m depth [10] .
Material and Methods Material
The research was coordinated through the Poznań National University of Earth Sciences, Greater Poland, Poland. A total of 47 groundwater samples were collected from monitoring bores along the defined flow transect between March 2022 and September 2023. Each bore was purged for at least three casing volumes before sampling. Samples for cation analysis were filtered through 0.45 μm membrane filters and acidified with ultrapure HNO₃ to pH < 2 in HDPE bottles. Anion samples were collected unacidified. Stable isotope samples were stored in airtight 30 mL glass vials with no headspace. Field parameters including pH, electrical conductivity, temperature, and dissolved oxygen were recorded using a calibrated YSI ProDSS multiparameter probe [11] .
Methods
Major cations (Na⁺, Ca²⁺, Mg²⁺, K⁺) were measured by ICP-OES on an Agilent 5110 instrument. Anions (Cl⁻, SO₄²⁻, HCO₃⁻) were determined by ion chromatography using a Metrohm 930 Compact IC Flex. Only samples with charge balance errors below ±5% were retained (43 of 47 met this). Stable isotope ratios were analysed by cavity ring-down spectroscopy on a Picarro L2130-i analyser. Saturation indices were computed using PHREEQC version 3.7 [12] . Statistical correlations were tested with Spearman rank correlation in R (v4.3.1), significance at p < 0.05. respectively [13] . Both TDS and pH displayed monotonic increases, though pH rose more gradually (6.82 to 8.79) compared to the nearly eightfold TDS increase, consistent with CO₂ consumption through carbonate reactions and silicate weathering.
Results
Results
Zone
Zone
Discussion
The hydrochemical patterns documented along this GAB transect align with classical models of groundwater evolution in confined sedimentary basins, where dilute recharge water progressively acquires solutes through mineral dissolution, ion exchange, and mixing [14] . The clear Ca-to-Na swap between the recharge and mid-basin zones points to cation exchange on clay surfaces as a dominant control. This mirrors findings from the Paris Basin and Great Hungarian Plain [3] . The saturation index trajectory for calcite-shifting from slightly undersaturated in the recharge zone to oversaturated by Transition Zone A-implies carbonate precipitation may occur within the aquifer, potentially contributing to porosity reduction over geological time [15] . But kinetic barriers to calcite nucleation at low temperatures may delay actual precipitation beyond the thermodynamic saturation point. Persistent undersaturation of gypsum and halite suggests these minerals remain available as ongoing solute sources. Stable isotope data clustered along the global meteoric water line near the recharge margin but showed slight positive δ¹⁸O shifts at the discharge end, possibly reflecting low-temperature water-rock oxygen exchange over very long residence times [7] .
Conclusion
This research traced the hydrochemical evolution of groundwater across roughly 890 km of lateral flow within the Great Artesian Basin, documenting a systematic transition from Ca-HCO₃ type water near the recharge margin to Na-Cl dominated water at the discharge zone. TDS increased nearly eightfold, driven mainly by rising sodium and chloride. Cation exchange on clay minerals was the principal mechanism behind the Ca-to-Na transition, while carbonate dissolution and silicate weathering contributed to bicarbonate and pH trends. The data carry predictive value for bore site planning and reinforce that deep artesian water in the western GAB carries elevated salinity requiring treatment for many uses. Future work should incorporate trace element data to complete the water quality picture along these flow paths.
Acknowledgement
Acknowledgements Funding SourcesThis research received support through internal university research grants. Institutional SupportThe authors thank the Poznań National University of Earth Sciences for laboratory access and analytical support. Contributions Not Qualifying for AuthorshipField technicians from the Queensland Department of Natural Resources assisted with bore access and sample logistics.
Figures and tables from the paper
| Zone | SI Calcite | SI Dolomite | SI Gypsum | SI Halite |
|---|---|---|---|---|
| Recharge | -0.34 | -1.12 | -2.87 | -7.63 |
| Trans. A | 0.08 | -0.47 | -2.41 | -6.89 |
| Mid-Basin | 0.41 | 0.23 | -1.93 | -5.74 |
| Trans. B | 0.67 | 0.58 | -1.52 | -5.18 |
| Discharge | 0.89 | 0.94 | -1.14 | -4.53 |
Table text extracted from the original PDF; superscript letters are shown inline. The original table image is below.
View original table image
| Zone | Na⁺ | Ca²⁺ | Mg²⁺ | HCO₃⁻ | Cl⁻ | TDS |
|---|---|---|---|---|---|---|
| Recharge | 24.3 | 85.6 | 31.2 | 198.4 | 18.7 | 312 |
| Trans. A | 68.7 | 62.1 | 24.8 | 287.6 | 52.3 | 428 |
| Mid-Basin | 142.5 | 38.4 | 16.3 | 412.3 | 128.6 | 814 |
| Trans. B | 218.9 | 21.7 | 9.6 | 498.1 | 214.5 | 1342 |
| Discharge | 347.2 | 12.3 | 5.1 | 573.8 | 389.7 | 2487 |
Table text extracted from the original PDF; superscript letters are shown inline. The original table image is below.
View original table image
References
16 in the original paper- Habermehl MA. The Great Artesian Basin, Australia. BMR J Aust Geol Geophys. 1980;5:9-38.
- Herczeg AL, Torgersen T, Chivas AR, Habermehl MA. Geochemistry of ground waters from the Great Artesian Basin. J Hydrol. 1991;126(3-4):225-245.
- Edmunds WM, Shand P. Natural Groundwater Quality. Oxford: Blackwell Publishing; 2008.
- Smerdon BD, Ransley TR, Radke BM, Kellett JR. Water resource assessment for the Great Artesian Basin. Geoscience Australia Report; 2012. p. 1-53.
- Radke BM, Ferguson J, Cresswell RG, Ransley TR, Habermehl MA. Hydrochemistry and implied hydrodynamics of the Cadna-owie-Hooray Aquifer. AGSO Record No. 34; 2000. p. 1-76.
- Mahara Y, Habermehl MA, Miyakawa K, Shimada J, Mizuochi Y. Can the ⁴He clock be calibrated by ³⁴Cl for groundwater dating? Nucl Instrum Methods Phys Res B. 2009;267(7):1616-1620.
- Torgersen T, Habermehl MA, Phillips FM, Elmore D, Kubik P, Jones BG. Chlorine-36 dating of very old groundwater. Water Resour Res. 1991;27(12):32013213.
- Love AJ, Herczeg AL, Sampson L, Cresswell RG, Fifield LK. Sources of chloride and implications for ³⁶Cl dating of old groundwater. Water Resour Res. 2000;36(6):1561-1574.
- Ransley TR, Smerdon BD. Hydrostratigraphy, hydrogeology and system conceptualisation of the Great Artesian Basin. Geoscience Australia Technical Report; 2012. p. 1-68.
- Pirlo MC. Hydrogeochemistry and geothermometry of thermal groundwaters from the Birdsville Track Ridge. Geothermics. 2004;33(6):743-774.
- Moya CE, Raiber M, Taulis M, Cox ME. Hydrochemical evolution and groundwater flow processes in the Galilee and Eromanga basins. J Hydrol. 2015;530:832-849.
- Parkhurst DL, Appelo CAJ. Description of input and examples for PHREEQC version 3. US Geological Survey Techniques and Methods; 2013. p. 1-497.
- Raiber M, White PA, Daughney CJ, Tschritter C, Davidson P, Bainbridge SE. Three-dimensional geological modelling and multivariate statistical analysis. J Hydrol. 2012;436-437:13-34.
- Appelo CAJ, Postma D. Geochemistry, Groundwater and Pollution. 2nd ed. Boca Raton: CRC Press; 2005.
- Hendry MJ, Schwartz FW. An alternative view on the origin of chemical and isotopic patterns in groundwater from the Milk River Aquifer. Water Resour Res. 1988;24(10):1747-1763.
- Kellett JR, Radke BM, Ransley TR. Hydrodynamics of the Great Artesian Basin. Geoscience Australia Professional Opinion; 2012. p. 1-58.