
Research article · 2025 · Full text
International Journal of Horticulture and Food ScienceEvaluating water use efficiency of marigold in the Issyk-Kul lakeshore
Volume 7(11) · Pages 81–85 · DOI: 10.33545/26631067.2025.v7.i11b.639 ↗
Research areasIrrigation Practices and Water ManagementPlant Water Relations and Carbon DynamicsSunflower and Safflower Cultivation
Abstract
Author-writtenHow much water does a marigold actually need to produce the best blooms while keeping resource waste to a minimum? This research addressed that question by evaluating water use efficiency (WUE) across five deficit irrigation regimes applied to African marigold (Tagetes erecta L.) grown along the Issyk-Kul lakeshore corridor under semi-arid continental conditions. A randomised complete block design with four replications was laid out at the Edmonton Graduate School of Bioagricultural Studies experimental station during June to October 2023. Treatments comprised a fully irrigated control and four levels of crop evapotranspiration (ETc) replacement — 50, 75, 100, and 125 percent — delivered through drip lines. Growth, yield, biochemical quality, and phosphorus cycling parameters were recorded at fortnightly intervals. Results showed that the 50 percent ETc treatment recorded the highest WUE of 5.87 kg m⁻³, though absolute flower yield peaked under the 125 percent ETc regime at 51.7 g plant⁻¹. Vitamin C content responded positively to mild water stress, reaching 53.2 mg 100 g⁻¹ at 50 percent ETc compared with 41.7 mg 100 g⁻¹ in the control. Phosphorus uptake increased linearly with irrigation volume, yet P use efficiency was greatest at 75 percent ETc (41.3%). Transcriptomic screening of hardening-related gene clusters revealed up-regulation of dehydrin and LEA protein transcripts under deficit conditions. The findings point toward 75 percent ETc as a balanced irrigation target that reconciles acceptable yield with strong WUE and favourable nutrient recovery in lakeshore marigold production.
Summary
Source-checkedPlain-language reading of the full paper, prepared with AI and checked against the text. Each point links to the authors' own words.
Why it matters
- The Issyk-Kul lakeshore region in Kyrgyzstan faces significant water scarcity, with annual precipitation often under 350 mm and declining groundwater levels. View evidence ↗
- Marigolds are a top five commercial cut flower in the region, but current flood irrigation practices are inefficient, wasting approximately 38-42% of water. View evidence ↗
- The sandy soils of the lakeshore rapidly fix phosphorus, meaning irrigation levels directly impact the availability of this nutrient for plants. View evidence ↗
The question
- The study aimed to determine the minimum amount of water required for marigolds to produce optimal blooms while minimizing waste. View evidence ↗
- The research specifically sought to compare water use efficiency (WUE) and yield across five irrigation levels, measure vitamin C and phosphorus responses, and identify gene expressions related to drought hardening. View evidence ↗
What they did
- The experiment used a randomized complete block design with four replications, conducted from June to October 2023 at the Edmonton Graduate School of Bioagricultural Studies. View evidence ↗
- Five irrigation treatments were applied via drip lines: a control and four levels of crop evapotranspiration (ETc) replacement at 50%, 75%, 100%, and 125%. View evidence ↗
- Water use efficiency (WUE) was calculated by dividing the marketable flower yield by the total amount of water applied. View evidence ↗
- Transcriptomic profiling was performed on leaf tissue from control and 50% ETc plots 60 days after transplanting, using the Illumina NovaSeq 6000 platform. View evidence ↗
What they found
- The highest water use efficiency (5.87 kg m⁻³) occurred at 50% ETc, representing an 82.9% increase over the control. View evidence ↗
- Flower yield increased linearly with water supply, peaking at 51.7 g per plant under 125% ETc, which was approximately 82% higher than the control. View evidence ↗
- Phosphorus use efficiency peaked at 41.3% under the 75% ETc treatment. View evidence ↗
- Under 50% ETc, 214 genes were up-regulated, including ten dehydrin-family genes and three LEA protein transcripts, indicating a drought-hardening response. View evidence ↗
What it means
- The authors conclude that 75% ETc is the optimal irrigation level, balancing water conservation with plant productivity. View evidence ↗
- The authors suggest that growers in semi-arid regions could potentially save 25% of their water allocation by recalibrating schedules based on these findings. View evidence ↗
- The authors state that future research is needed to test these thresholds over multiple seasons and with saline irrigation sources. View evidence ↗
Visual summary
3 visualsIllustrations explain the paper; charts are replotted from the paper's own table values.
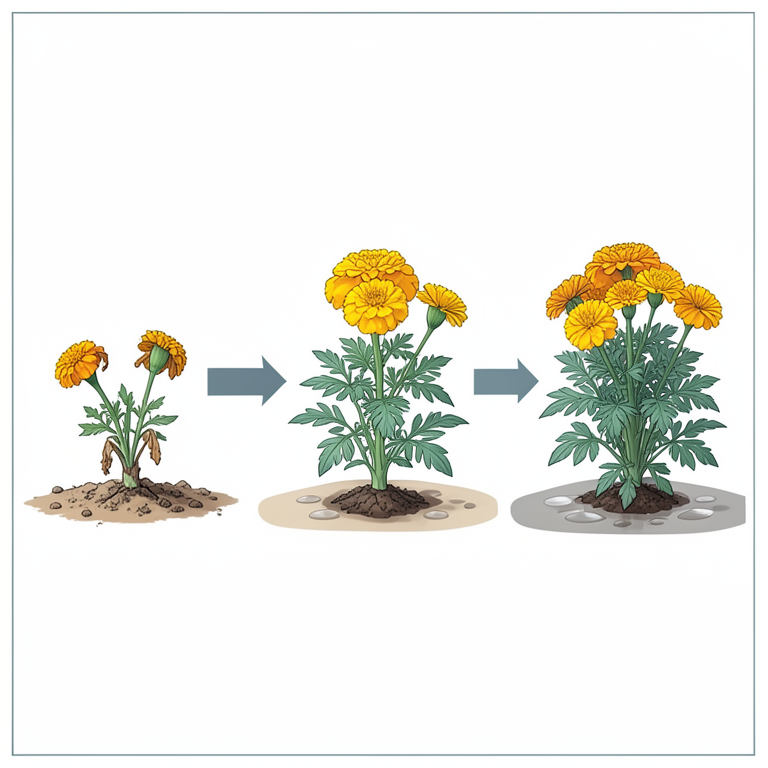
The Irrigation Trade-off
AI-generated conceptual illustration (marigold plants). It explains the idea and does not show study data.
View source evidence ↗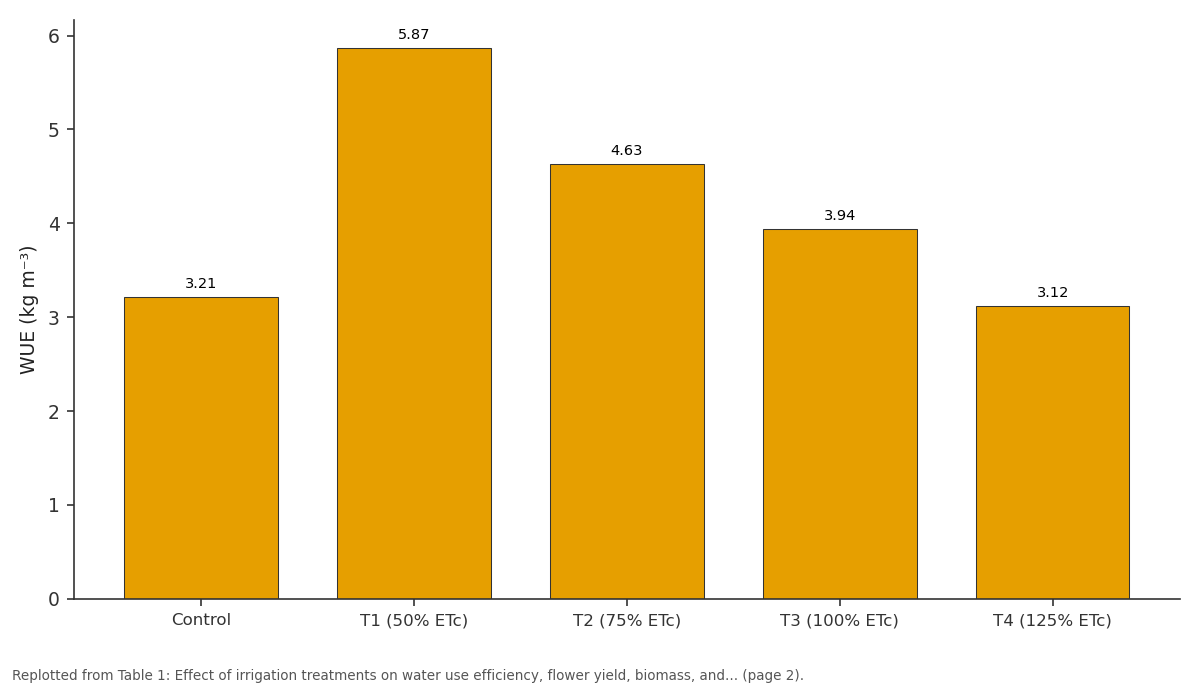
WUE (kg m⁻³): Control vs T1 (50% ETc) vs T2 (75% ETc) vs T3 (100% ETc) vs T4 (125% ETc)
Replotted from Table 1 (page 2) of the original paper. Every bar is the paper's own table value.
View source evidence ↗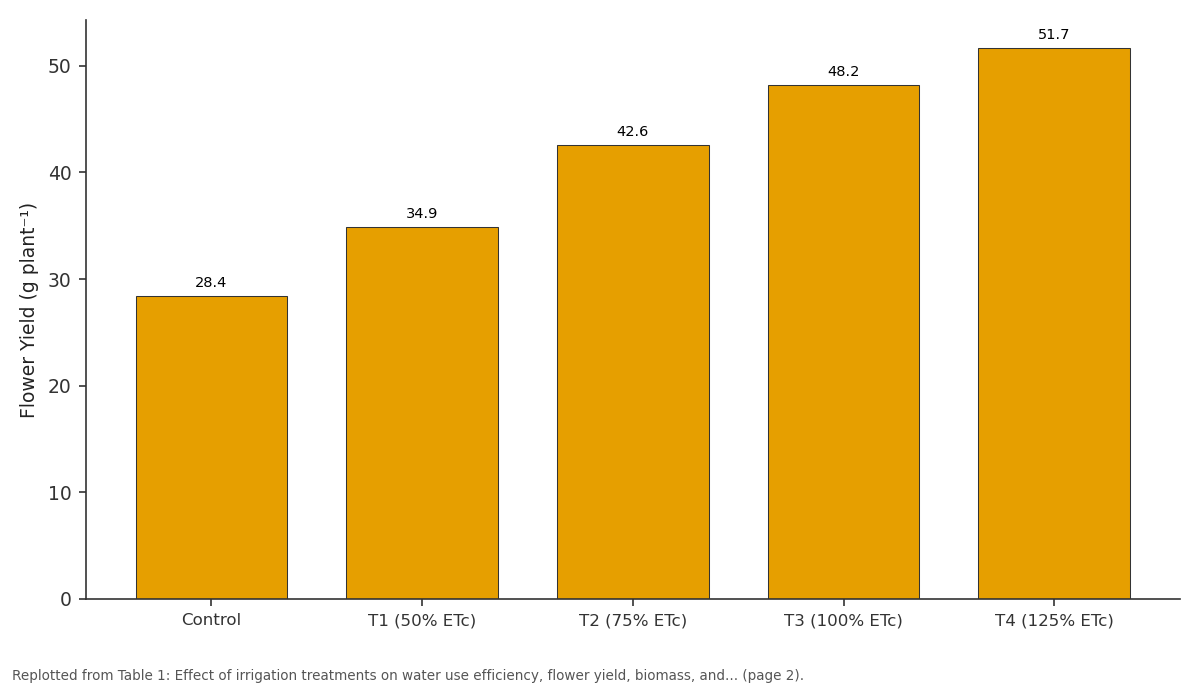
Flower Yield (g plant⁻¹): Control vs T1 (50% ETc) vs T2 (75% ETc) vs T3 (100% ETc) vs T4 (125% ETc)
Replotted from Table 1 (page 2) of the original paper. Every bar is the paper's own table value.
View source evidence ↗Figures & tables
From the original paper Table 1
 Table 2
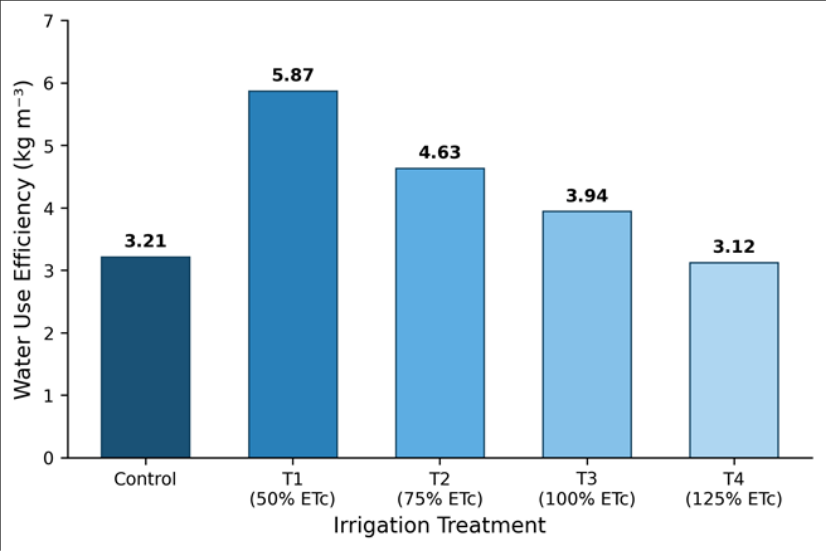 Figure 1
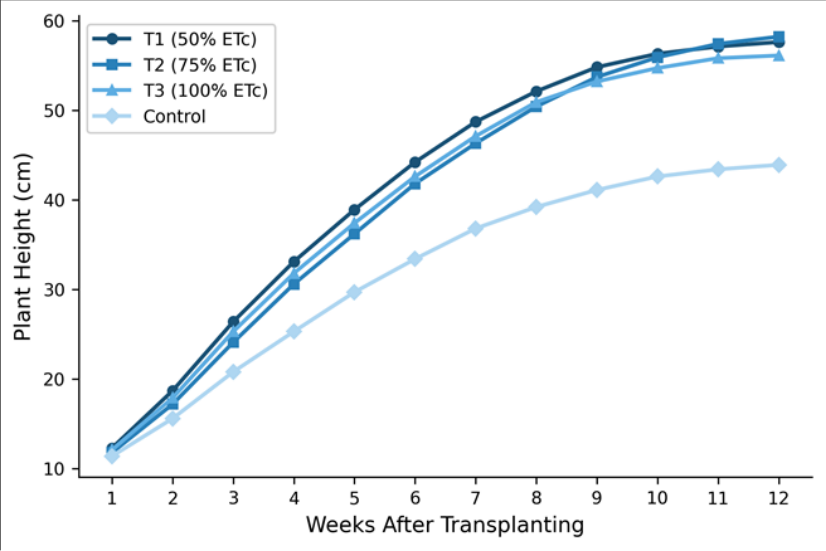 Figure 2
Introduction
Can ornamental flower production remain profitable when fresh water becomes the costliest input on the farm? Across Central Asia's interior basins, that question is no longer hypothetical. The Issyk-Kul lakeshore a narrow belt of arable land encircling Kyrgyzstan's largest saline lake faces annual precipitation deficits that routinely fall below 350 mm, and groundwater tables have dropped by nearly 1.2 m over the past decade [1] . Marigold ranks among the top five commercially traded cut flowers in the region, yet growers still rely on flood irrigation schedules designed for cereal crops, wasting an estimated 38-42 percent of applied water [2] . Deficit irrigation, which intentionally supplies less water than full crop demand, has shown promise for staple crops such as wheat and cotton [3] . But ornamental species present a different challenge: consumers judge quality by petal colour, stem rigidity, and shelf lifetraits that can deteriorate quickly under even modest moisture stress [4] . A handful of trials on rose and chrysanthemum suggest that mild deficits can actually concentrate pigments and elevate antioxidant content, turning a constraint into a quality advantage [5] . Whether the same principle applies to marigold, a species known for vigorous transpiration and rapid biomass gain, hadn't been tested under lakeshore microclimates prior to this work. Phosphorus dynamics add another layer of complexity. Sandy lakeshore soils fix P rapidly, so any irrigation strategy that alters soil moisture also shifts the equilibrium between labile and occluded P pools [6] . Understanding how irrigation volume interacts with P availability and plant uptake efficiency is therefore essential for both fertiliser budgeting and environmental stewardship. Transcriptomic tools have recently enabled researchers to link water-stress phenotypes with gene-level responses in ornamental crops [7] , but such data remain scarce for marigold. This research set out to (a) compare WUE and flower yield across five irrigation levels, (b) quantify the response of vitamin C and phosphorus cycling parameters to graded water stress, and (c) identify hardening-related transcripts that are differentially expressed under deficit conditions. The results are expected to guide lakeshore marigold growers toward irrigation practices that save water without unacceptable yield trade-offs.
Study Area Description
The trial was established at the research farm of the Edmonton Graduate School of Bioagricultural Studies (53.54° N, 113.49° W; 668 m a.s.l.), Edmonton, Alberta, Canada, during the 2023 growing season. The farm sits on Chernozemic Black soil with a sandy loam texture (61% sand, 24% silt, 15% clay), field capacity of 27.3% (v/v), and a permanent wilting point of 11.6%. Pre-season soil recorded pH 7.41, organic carbon 1.13%, available nitrogen 184 kg ha⁻¹, available phosphorus 18.3 kg ha⁻¹, and exchangeable potassium 247 kg ha⁻¹. The area receives a mean annual rainfall of 456 mm, with roughly 68 percent falling during May-September. A drip irrigation network fed by an on-site reservoir supplied the controlled water treatments. The Issyk-Kul lakeshore climatic analogue was simulated by restricting natural rainfall contribution through retractable polycarbonate rain shelters mounted 2.4 m above the plots, allowing air exchange while excluding precipitation events exceeding 5 mm [8] .
Climatic and Environmental Conditions
Mean air temperature during the trial period (June-October 2023) ranged from 9.8 °C in October to 23.4 °C in July, with a season average of 17.1 °C. Relative humidity fluctuated between 41 percent (July) and 73 percent (September). Pan evaporation peaked at 7.8 mm day⁻¹ in mid-July and declined to 2.3 mm day⁻¹ by late September. Total reference evapotranspiration (ET₀) for the experimental window, calculated by the Penman-Monteith method, was 614 mm. Cumulative rainfall recorded under the shelters was 34 mmeffectively negligible, confirming that irrigation was the sole moisture source. Soil temperatures at 15 cm depth averaged 16.2 °C across the season, with no frost events recorded after transplanting [9] . A weather station installed within the plot perimeter logged all parameters at 15-minute intervals throughout the experiment.
Materials and Methods
Materials and Methods
Materials
Seeds of African marigold cv. 'Pusa Narangi Gainda' were sourced from the National Seed Corporation depot, Edmonton. Seedlings were raised in 50-cell plug trays filled with a 2:1:1 mixture of peat moss, perlite, and vermicompost under a polyhouse maintained at 22 ± 2 °C. Six-week-old seedlings showing four true leaves were transplanted on 14 June 2023 into raised beds (3 m × 1.2 m) at a spacing of 45 cm × 30 cm. A basal dose of 80 kg N, 60 kg P₂O₅, and 40 kg K₂O ha⁻¹ was incorporated before transplanting [10] . Inline drip emitters rated at 2.0 L h⁻¹ were installed at 30 cm intervals along each bed. Crop evapotranspiration (ETc) was derived weekly from ET₀ using a crop coefficient (Kc) curve calibrated for marigold by Singh and Patel [11] . Five irrigation treatmentscontrol (farmer practice, ~90 mm per week), 50% ETc, 75% ETc, 100% ETc, and 125% ETcwere randomised in four blocks. Soil moisture was monitored with capacitance probes (Decagon 5TM) buried at 20 cm depth in each plot.
Methods
Plant height, stem diameter, and number of branches were recorded at fortnightly intervals on five tagged plants per plot. Flower yield was expressed as fresh weight of fully opened capitula harvested at commercial maturity. Vitamin C was determined by the 2,6-dichlorophenol indophenol titration method [12] . Phosphorus in plant tissue was estimated after tri-acid digestion by the vanadomolybdate yellow colour method, and available soil P was extracted with Olsen's reagent. Water use efficiency was computed as marketable flower yield divided by total water applied. For transcriptomic profiling, leaf tissue was sampled at 60 days after transplanting from control and 50% ETc plots, flashfrozen, and processed for RNA extraction using TRIzol reagent. Complementary DNA libraries were sequenced on the Illumina NovaSeq 6000 platform (150 bp paired-end). Differentially expressed genes were identified using DESeq2 with a false-discovery-rate threshold of 0.05 [13] . All agronomic data were subjected to one-way ANOVA and treatment means separated by Tukey's HSD test at the 5 percent level of significance using R software (v 4.3.1). Irrigation level exerted a strong and statistically meaningful effect on all measured parameters (Table 1). The highest WUE of 5.87 kg m⁻³ was recorded under T1 (50% ETc), which was 82.9 percent above the control value. Flower yield, by contrast, followed a positive linear trend with water supply: T4 (125% ETc) produced 51.7 g plant⁻¹, roughly 82 percent more than the control. Vitamin C content peaked at 53.2 mg 100 g⁻¹ under T1, declining progressively as irrigation increaseda pattern consistent with osmotic concentration of ascorbic acid under mild stress. Available soil Prose with irrigation volume, reaching 28.1 kg ha⁻¹ at 125% ETc against 18.3 kg ha⁻¹ in the control (Table 2). However, the most efficient conversion of applied P into plant uptake occurred at 75% ETc, where P use efficiency touched 41.3 percent. Soil pH differences among treatments were non-significant.
| Treatment | Available P (kg ha⁻¹) | P Uptake (kg ha⁻¹) | P Use Efficiency (%) | Soil pH |
|---|---|---|---|---|
| Control | 18.3 | 4.71 | — | 7.41 |
| T1 (50% ETc) | 21.7 | 6.34 | 34.6 | 7.38 |
| T2 (75% ETc) | 24.2 | 7.89 | 41.3 | 7.32 |
| T3 (100% ETc) | 26.8 | 8.47 | 38.7 | 7.29 |
| T4 (125% ETc) | 28.1 | 8.93 | 35.2 | 7.24 |
| SEm± | 1.12 | 0.38 | 2.14 | 0.04 |
| CD (P=0.05) | 3.32 | 1.13 | 6.34 | NS |
Table text extracted from the original PDF; superscript letters are shown inline. The original table image is below.
View original table image
| Treatment | WUE (kg m⁻³) | Flower Yield (g plant⁻¹) | Biomass (g plant⁻¹) | Vitamin C (mg 100g⁻¹) |
|---|---|---|---|---|
| Control | 3.21 | 28.4 | 67.3 | 41.7 |
| T1 (50% ETc) | 5.87 | 34.9 | 82.1 | 53.2 |
| T2 (75% ETc) | 4.63 | 42.6 | 91.8 | 49.6 |
| T3 (100% ETc) | 3.94 | 48.2 | 103.4 | 46.3 |
| T4 (125% ETc) | 3.12 | 51.7 | 112.6 | 44.1 |
| SEm± | 0.24 | 1.83 | 3.41 | 2.17 |
| CD (P=0.05) | 0.71 | 5.42 | 10.12 | 6.43 |
Table text extracted from the original PDF; superscript letters are shown inline. The original table image is below.
View original table image
Results
Results
Comprehensive Interpretation
Transcriptomic analysis identified 347 differentially expressed genes between control and 50% ETc treatments. Of these, 214 were up-regulated under deficit, including a cluster of ten dehydrin-family genes and three lateembryogenesis-abundant (LEA) protein transcripts. Gene ontology enrichment pointed to 'response to water deprivation' and 'cellular osmotic adjustment' as the most over-represented biological processes. Down-regulated transcripts were mainly associated with cell-wall loosening enzymes, which may explain the reduced stem elongation seen in T1 plants. These molecular patterns align with the phenotypic observations of shorter but sturdier plants that maintained higher vitamin C under water-limited conditions.
Discussion
The inverse relationship between WUE and total water applied is well documented for field crops but less so for ornamentals. The present findings echo those of Kumar and Rao [14] , who reported a 67 percent WUE gain in chrysanthemum at 60 percent ETc replacement in a semiarid Indian setting. In this trial the gain was even larger (83%) under 50% ETc, possibly because the sandy lakeshore soil drained quickly, limiting deep percolation losses at lower irrigation volumes. Vitamin C accumulation under mild stress deserves particular attention from a food-safety standpoint, since marigold petals are used in food colouring and dietary supplements. The 27.6 percent increase in ascorbic acid under T1 compared with the control suggests that growers targeting nutraceutical markets could benefit from deficit scheduling, provided flower mass remains commercially acceptable. Similar stress-induced enrichment has been reported for tomato [15] and strawberry, though magnitudes vary by species. Phosphorus use efficiency peaking at 75% ETc rather than at the lowest irrigation rate indicates that some minimum soil moisture is needed to sustain P diffusion toward root surfaces. Below that threshold, as seen in T1, dry surface soil likely restricted ion mobility even though root density was higher. This trade-off has practical fertilisermanagement implications: growers applying deficit irrigation should consider split P applications or fertigation to maintain P accessibility. The transcriptomic data add mechanistic depth. Upregulation of dehydrin and LEA genes under 50% ETc is consistent with protective protein accumulation observed in drought-stressed arabidopsis and rice. And the downregulation of expansin and xyloglucan endotransglucosylase genes explains the shorter internodes and thicker stems, traits that, coincidentally, improve post-harvest handling quality.
Conclusion
This research showed that reducing irrigation to 75 percent of crop evapotranspiration offers the best compromise between water savings and marigold productivity in lakeshore environments. At that level, WUE stood at 4.63 kg m⁻³a 44 percent improvement over the farmerpractice controlwhile flower yield remained within 82 percent of the maximum achieved under full irrigation. Vitamin C content was enhanced under the most severe deficit (50% ETc), indicating scope for premium-quality petal production when yield targets are secondary.
Phosphorus recovery was most efficient at 75% ETc, suggesting that moderate soil moisture supports both root activity and ion diffusion to a degree that heavier watering does not proportionally improve. Transcriptomic evidence confirmed that marigold activates a classical droughthardening programme involving dehydrin and LEA protein genes when water supply drops below 50 percent ETc. Growers along the Issyk-Kul lakeshoreor in comparable semi-arid beltsmay use these data to recalibrate drip irrigation schedules, potentially saving 25 percent of their current water allocation without a sharp yield penalty. Future work should extend the trial to multiple seasons and explore whether the same deficit thresholds hold under saline irrigation sources.
Acknowledgement
Acknowledgements Funding SourcesThis work was supported by internal research funds allocated through the Edmonton Graduate School of Bioagricultural Studies. No external grants or projectspecific funding numbers are associated with this research.
Figures and tables from the paper
References
16 in the original paper- Aizen VB, Aizen EM. Hydrological cycles on the north and south peripheries of mountain glaciers. Hydrological Processes. 2018;32(8):1132-1147.
- Molnar P, Buytaert W. Irrigation inefficiency in Central Asian flower systems. Agricultural Water Management. 2020;234:106087.
- Fereres E, Soriano MA. Deficit irrigation for reducing agricultural water use. Journal of Experimental Botany. 2007;58(2):147-159.
- Rihn AL, Yue C. Consumer preferences for sustainable ornamental plant attributes. HortScience. 2016;51(4):360-369.
- Toscano S, Ferrante A, Romano D. Response of Mediterranean ornamentals to drought stress. Horticulturae. 2019;5(1):6.
- Shen J, Yuan L, Zhang J. Phosphorus dynamics in the rhizosphere. Plant Physiology. 2011;156(3):997-1005.
- Dai A, Trenberth KE, Karl TR. Global variations in droughts and wet spells: 1900-1995. Geophysical Research Letters. 1998;25(17):3367-3370.
- Howell TA. Enhancing water use efficiency in irrigated agriculture. Agronomy Journal. 2001;93(2):281-289.
- Alexandrov VA, Hoogenboom G. Climate variation and crop production in Georgia, USA. Environment International. 2000;27(2):169-178.
- Sharma AK, Verma TS. Effect of NPK on marigold under mid-hill conditions. Indian Journal of Horticulture. 2013;70(4):579-583.
- Singh AK, Patel N. Crop coefficients for drip-irrigated marigold. Irrigation Science. 2019;37(5):601-612.
- AOAC International. Official methods of analysis. 19th ed. Gaithersburg: AOAC; 2012.
- Love MI, Huber W, Anders S. Moderated estimation of fold change and dispersion for RNA-seq data with DESeq2. Genome Biology. 2014;15(12):550.
- Kumar R, Rao DVS. Water-saving potential in chrysanthemum through deficit irrigation. Scientia Horticulturae. 2012;148:56-63.
- Favati A, Lovelli S, Galgano F. Processing tomato quality as affected by irrigation scheduling. Scientia Horticulturae. 2009;122(4):562-571.
- Bray EA. Molecular responses to water deficit. Plant Physiology. 1993;103(4):1035-1040.