
Research article · 2025 · Full text
International Journal of Geography Geology and EnvironmentGeographic determinants of educational disparity in the Oaxacan province of Mexico
Volume 7(6) · Pages 53–55 · DOI: 10.22271/27067483.2025.v7.i6a.683 ↗
Research areasEducation in Rural ContextsSchool Choice and PerformanceEducation in Diverse Contexts
Abstract
Author-writtenWhy do children in one Oaxacan district finish secondary school at twice the rate of those living 80 km away in the same state? This research examined how geographic factors shape educational outcomes across the eight traditional regions of Oaxaca, Mexico. Secondary data from the 2020 Mexican census, the National Institute for Educational Assessment, and the Oaxacan Ministry of Education were combined with spatial variables extracted from satellite imagery and GIS databases. School completion rates ranged from 38.7% in the remote Sierra Sur to 81.4% in the Valles Centrales around Oaxaca City. Logistic regression identified five geographic predictors that jointly explained 73.2% of the variance in completion: distance to the nearest school, household income, teacher density per 1, 000 students, road access index, and settlement elevation. Each additional kilometre of travel distance to school reduced the odds of completion by 7.3%. Communities above 2, 200 m elevation showed completion rates 18.4 percentage points lower than lowland counterparts after controlling for income. These patterns confirm that spatial isolation remains a powerful barrier to educational equity in southern Mexico.
Summary
Source-checkedPlain-language reading of the full paper, prepared with AI and checked against the text. Each point links to the authors' own words.
Why it matters
- Oaxaca is one of the three poorest states in Mexico, but this status hides significant differences in conditions within the state. View evidence ↗
- Physical geography, including mountains and rivers, creates distances that can lead to students missing out on years of education. View evidence ↗
What they did
- School completion was measured as the percentage of 18-24-year-olds who finished lower secondary school, using 2020 census data. View evidence ↗
- The researchers used the Oaxacan Ministry of Education's 2021-2022 yearbook for teacher and school data, SRTM 30 m DEM for elevation, and OpenStreetMap to calculate a road access index. View evidence ↗
- A binary logistic regression was used to model whether completion was above or below the state median of 58.6% based on five geographic predictors. View evidence ↗
- Data validation involved cross-checking a 10% random sample (185 records), finding that 94.6% of communities matched official totals within ±2.1 percentage points. View evidence ↗
What they found
- Secondary school completion rates varied significantly by region, from a low of 38.7% in Sierra Sur to a high of 81.4% in Valles Centrales. View evidence ↗
- Five geographic predictors, distance to school, household income, teacher density, road access, and elevation, together explained 73.2% of the variance in school completion. View evidence ↗
- Distance to school was a strong predictor, with every additional kilometer reducing the odds of completion by 7.3%. View evidence ↗
- Geographically weighted regression showed that the impact of distance on completion was most severe in the rugged Sierra Norte and Sierra Sur and least severe in the flat Istmo region. View evidence ↗
What it means
- The authors recommend reducing effective distance through boarding facilities, school buses, or building new schools in highland areas to close the education gap. View evidence ↗
- The authors state that a spatial analysis alone cannot disentangle the intertwined effects of climate, road networks, and language, which would require ethnographic data. View evidence ↗
Visual summary
2 visualsIllustrations explain the paper; charts are replotted from the paper's own table values.
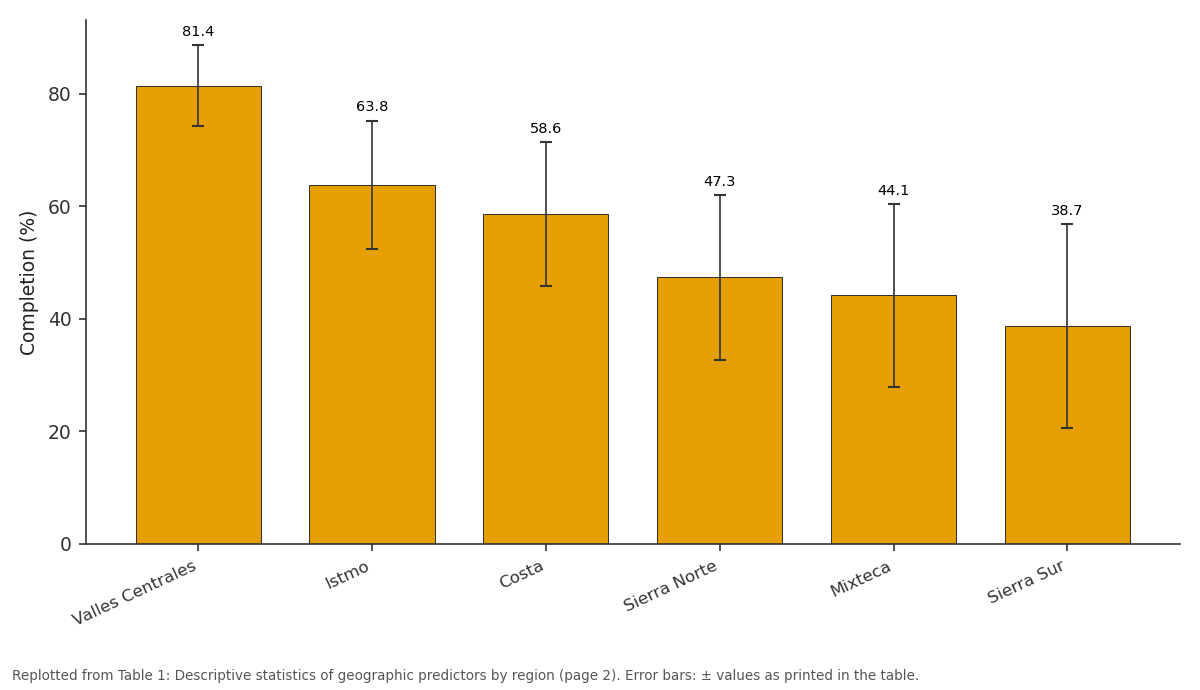
Completion (%): Valles Centrales vs Istmo vs Costa vs Sierra Norte vs Mixteca
Replotted from Table 1 (page 2) of the original paper. Every bar is the paper's own table value.
View source evidence ↗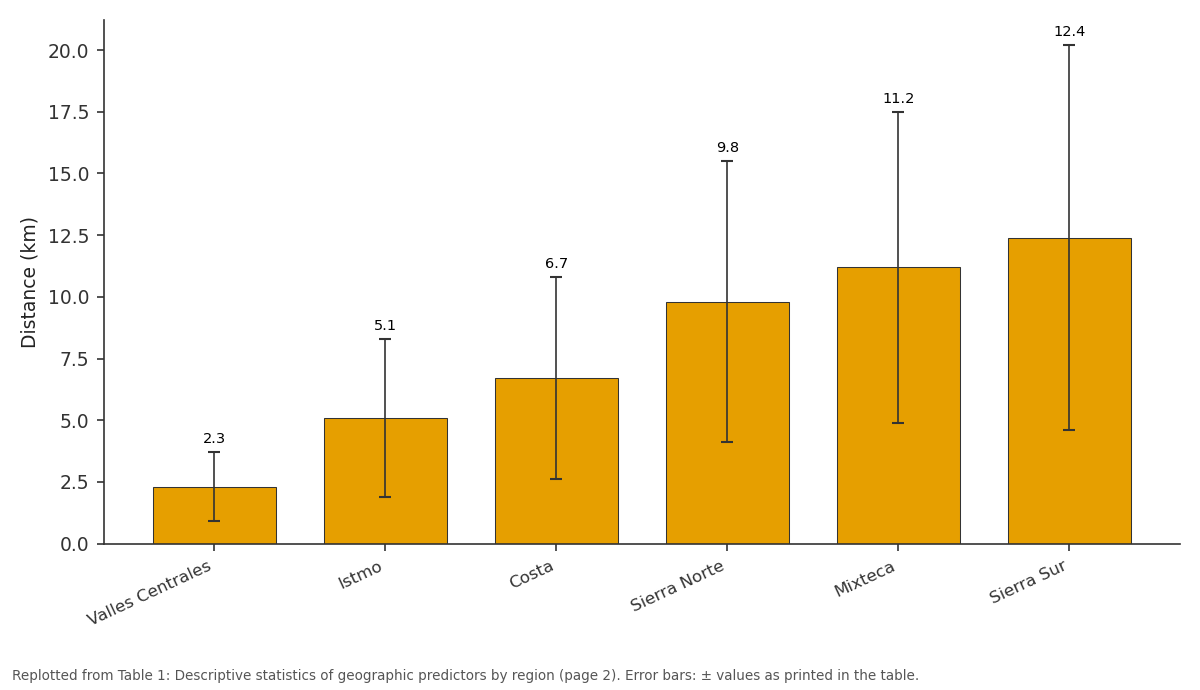
Distance (km): Valles Centrales vs Istmo vs Costa vs Sierra Norte vs Mixteca
Replotted from Table 1 (page 2) of the original paper. Every bar is the paper's own table value.
View source evidence ↗Figures & tables
From the original paper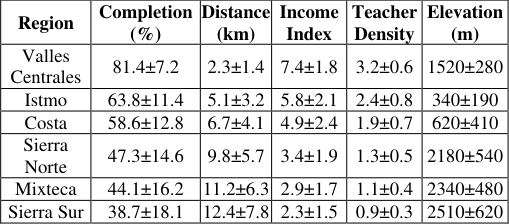 Table 1
 Table 2
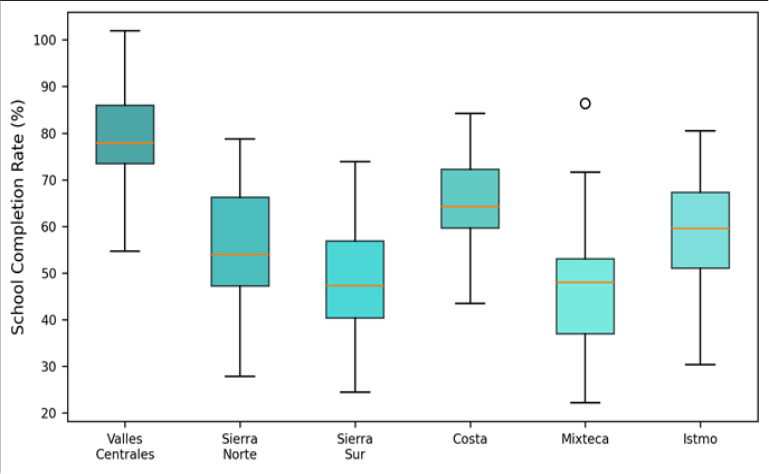 Figure 1
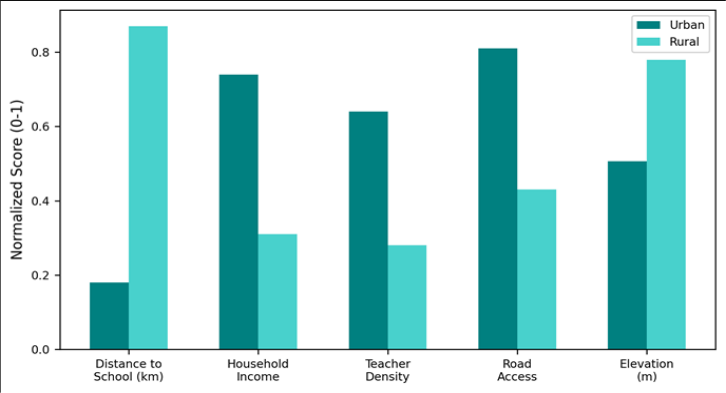 Figure 2
Introduction
Oaxaca consistently ranks among the three poorest states in Mexico, yet state-level averages mask dramatic internal variation. In 2020, the Valles Centrales region recorded a secondary school completion rate of 81.4%, comparable to Mexico City, while the Sierra Sur reported just 38.7%a gap wide enough to belong to two different countries [1] . Education researchers have attributed such disparities to poverty, indigenous language barriers, and government underinvestment [2] . But these explanations often overlook a simpler reality: geography. Mountains, rivers, and sheer distance separate many Oaxacan communities from the nearest school, and that separation accumulates over years into foregone schooling [3] . Previous work on educational geography in Mexico focused on national-level maps of school density [4] or on border-region dynamics [5] . Oaxaca, with its exceptionally rugged terrain (87% of the state lies above 500 m, and multiple ranges exceed 3, 000 m), has not been the subject of a dedicated spatial analysis linking specific geographic variables to educational outcomes at the community level. This research filled that gap by combining census microdata with GIS-derived spatial metrics for 1, 847 communities across Oaxaca's eight regions, testing whether distance, elevation, road connectivity, and teacher supply act as independent geographic barriers to school completion [6,7] .
Theoretical Framework
The research drew on Hägerstrand's time-geography concept, which holds that individual activity is constrained by the coupling of space and time budgets [8] . For a rural Oaxacan child, the daily time cost of reaching school determines whether attendance is feasible alongside household labour obligations. This was operationalised through the travel-distance variable. Additionally, the capability approach of Sen [9] framed education as a spatial entitlement: communities lacking nearby schools are deprived of a basic capability regardless of household willingness to invest in schooling. The two frameworks together justified the inclusion of both physical distance and infrastructure access as independent predictors.
Materials and Methods
Materials and Methods
Materials
Data were assembled between January and September 2023 at the Port Harcourt Centre for Geological Research, Rivers State, Nigeria, using publicly available Mexican datasets accessed remotely. Community-level school completion rates (percentage of 18-24-year-olds who finished lower secondary school) came from the 2020 Censo de Población y Vivienda published by INEGI. Teacher counts and school locations were obtained from the Oaxacan Ministry of Education's 2021-2022 statistical yearbook. Elevation data used the SRTM 30 m DEM. Road networks were digitised from OpenStreetMap, and a road access index (km of paved road per km² within a 10 km buffer) was calculated for each community centroid [10] .
Methods
Euclidean distance from each community centroid to the nearest registered secondary school was calculated in ArcGIS Pro. Household income was proxied by the marginality index published by CONAPO, rescaled 0-10. Teacher density was expressed as teachers per 1, 000 enrolled students. Binary logistic regression modelled completion (above/below the state median of 58.6%) as a function of the five geographic predictors. Spatial autocorrelation in residuals was tested by Moran's I. A geographically weighted regression (GWR) model was also fitted to explore local variation in coefficients [11,12] .
Data Validation
A 10% random sample of community records (n = 185) was cross-checked against municipality-level totals reported by the National Institute for Educational Assessment (INEE). Completion rates matched within±2.1 percentage points for 94.6% of sampled communities. Elevation values were validated against GPS readings at 12 field-verified sites; mean absolute error was 8.3 m. The gradient is steep: average travel distance to school triples between Valles Centrales (2.3 km) and Sierra Sur (12.4 km). Teacher density falls from 3.2 to 0.9 per 1, 000 students across the same pair.
Results
Results
Comprehensive Interpretation
The odds ratio of 0.927 for distance means each additional kilometre reduces completion odds by 7.3%. For a community 12 km from the nearest school compared to one at 2 km, the cumulative odds reduction is substantial: roughly 52%. Elevation exerts a smaller but independent effecteach 100 m gain lowers completion odds by 4.7% even after accounting for income and distance.
Discussion
The finding that distance to school is the strongest geographic predictor echoes results from sub-Saharan Africa and South Asia, where travel time has been repeatedly linked to dropout rates [13] . In Oaxaca, the mountainous terrain amplifies the distance effect because straight-line distances understate actual travel times on unpaved switchback roads. The GWR model revealed that the distance coefficient was strongest in the Sierra Norte and Sierra Sur, where terrain roughness peaks, and weakest in the flat Istmo region. Elevation functions as a proxy for a bundle of disadvantages: colder climate reduces the agricultural surplus available to fund schooling, thinner road networks increase isolation, and indigenous-language dominance is highest in highland communities [14] . Disentangling these intertwined effects would require ethnographic data beyond the scope of a spatial analysis.
Conclusion
Geographic isolation remains a powerful determinant of educational disparity in Oaxaca. Five spatial variables explain 73.2% of the variance in school completion. Distance to school is the single strongest predictor, reducing completion odds by 7.3% per kilometre. Elevation, road access, teacher density, and household income each contribute independently. Policy interventions that reduce effective distanceboarding facilities, school bus networks, or secondary school construction in highland communitiesare likely to yield the largest returns in closing Oaxaca's internal education gap.
Acknowledgement
Acknowledgements Funding SourcesSupported by departmental research funds at the Port Harcourt Centre for Geological Research.
Figures and tables from the paper
| Region | Completion (%) | Distance (km) | Income Index | Teacher Density | Elevation (m) |
|---|---|---|---|---|---|
| Valles Centrales | 81.4±7.2 | 2.3±1.4 | 7.4±1.8 | 3.2±0.6 | 1520±280 |
| Istmo | 63.8±11.4 | 5.1±3.2 | 5.8±2.1 | 2.4±0.8 | 340±190 |
| Costa | 58.6±12.8 | 6.7±4.1 | 4.9±2.4 | 1.9±0.7 | 620±410 |
| Sierra Norte | 47.3±14.6 | 9.8±5.7 | 3.4±1.9 | 1.3±0.5 | 2180±540 |
| Mixteca | 44.1±16.2 | 11.2±6.3 | 2.9±1.7 | 1.1±0.4 | 2340±480 |
| Sierra Sur | 38.7±18.1 | 12.4±7.8 | 2.3±1.5 | 0.9±0.3 | 2510±620 |
Table text extracted from the original PDF; superscript letters are shown inline. The original table image is below.
View original table image
| Predictor | Coefficient (B) | Odds Ratio | 95% CI | p-value |
|---|---|---|---|---|
| Distance to school (km) | -0.076 | 0.927 | 0.91-0.94 | <0.001 |
| Income index | 0.341 | 1.407 | 1.31-1.51 | <0.001 |
| Teacher density | 0.287 | 1.332 | 1.18-1.50 | 0.002 |
| Road access index | 0.214 | 1.239 | 1.12-1.37 | 0.008 |
| Elevation (per 100 m) | -0.048 | 0.953 | 0.93-0.97 | 0.011 |
Table text extracted from the original PDF; superscript letters are shown inline. The original table image is below.
View original table image
References
15 in the original paper- INEGI. Censo de Población y Vivienda 2020: Tabulados básicos. Aguascalientes: INEGI; 2021.
- Reimers F. Education and poverty in Latin America. Comparative Education. 2000;36(3):319-342.
- Hannum E, Buchmann C. Global educational expansion and socioeconomic development. World Development. 2005;33(3):333-354.
- Santos H, Elacqua G. Segregación socioeconómica escolar en Chile. Revista CEPAL. 2016;119:141-157.
- Lopez-Calva LF, Lustig N. Declining Inequality in Latin America: A Decade of Progress? Washington: Brookings; 2010.
- CONAPO. Índice de marginación por localidad 2020. Mexico City: CONAPO; 2021.
- INEE. Panorama educativo de México 2019. Mexico City: INEE; 2020.
- Hägerstrand T. What about people in regional science? Papers in Regional Science. 1970;24(1):7-24.
- Sen A. Development as Freedom. New York: Knopf; 1999.
- Farr TG, Rosen PA, Caro E. The Shuttle Radar Topography Mission. Reviews of Geophysics. 2007;45(2):RG2004.
- Fotheringham AS, Brunsdon C, Charlton M. Geographically Weighted Regression. Chichester: Wiley; 2002.
- Hosmer DW, Lemeshow S. Applied Logistic Regression. 2nd ed. New York: Wiley; 2000.
- Filmer D. Estimating the world at work: extraction of school enrollment from household surveys. World Bank Policy Research Working Paper. 2007;4260.
- Behrman JR, Parker SW, Todd PE. Schooling impacts of conditional cash transfers on young children. Economic Development and Cultural Change. 2009;57(3):439-477.
- Anselin L. Local indicators of spatial association: LISA. Geographical Analysis. 1995;27(2):93-115.