
Research article · 2025 · Full text
International Journal of Geography Geology and EnvironmentSpatio-temporal variability of suspended sediment load in the Yellow River estuary
Volume 7(12) · Pages 171–173 · DOI: 10.22271/27067483.2025.v7.i12b.675 ↗
Research areasCoastal and Marine DynamicsSoil erosion and sediment transportHydrology and Sediment Transport Processes
Abstract
Author-writtenAs the eminent fluvial geomorphologist Stanley Schumm once observed, rivers that carry exceptional sediment loads create estuaries that behave less like coastal features and more like extensions of the continental erosion system. Nowhere is this truer than at the mouth of the Yellow River (Huanghe), historically the world's most sediment-laden major river. This research quantified the spatio-temporal variability of suspended sediment load (SSL) across three monitoring stations in the lower Yellow River and its estuary from January 2019 to December 2023. Monthly SSL data were combined with tidal records and Landsat-8 derived turbidity maps to characterise sediment delivery, retention, and export patterns. Annual SSL at the Lijin upstream gauge declined from 248 million tonnes in 2019 to 179 million tonnes in 2023, a 27.8% reduction attributed to upstream dam regulation and water-sediment regulation scheme (WSRS) adjustments. Sediment retention efficiency in the estuary varied from 22.1% during neap tides in winter to 58.6% during spring tides in summer, driven by the interplay between river discharge magnitude and tidal energy. Sensitivity analysis showed that SSL projections were most responsive to changes in WSRS discharge volume and flood-season precipitation. The declining sediment supply raises concerns about delta erosion and wetland loss in the Yellow River Delta National Nature Reserve.
Summary
Source-checkedPlain-language reading of the full paper, prepared with AI and checked against the text. Each point links to the authors' own words.
Why it matters
- The Yellow River is historically one of the most sediment-heavy rivers in the world, making its estuary function more as an extension of continental erosion than a typical coastal feature. View evidence ↗
- The introduction of the water-sediment regulation scheme (WSRS) and the closure of the Xiaolangdi Dam in 1999 have significantly reduced the river's annual sediment delivery to between 150 and 300 million tonnes. View evidence ↗
- Declining sediment supply has been linked to wetland retreat and a shift from net accretion to net erosion in the Yellow River Delta since 1996. View evidence ↗
The question
- The study aimed to map the spatio-temporal distribution of suspended sediment load (SSL), analyze how seasonal discharge and tides control sediment retention, and identify key parameters for future delivery projections. View evidence ↗
What they did
- The researchers used monthly sediment concentration and discharge data from January 2019 to December 2023 from three stations: Lijin (104 km from the sea), Kenli (48 km), and the estuary mouth. View evidence ↗
- Turbidity maps were created using 87 cloud-free Landsat-8 OLI satellite scenes collected over the five-year study period. View evidence ↗
- Sediment retention efficiency (SRE) was calculated as the percentage of sediment lost between the Lijin station and the estuary mouth, then averaged by season and tidal condition. View evidence ↗
What they found
- Sediment retention efficiency increased from 44.4% to 56.4%, meaning more of the reduced sediment supply is being deposited in the estuary rather than reaching the Bohai Sea. View evidence ↗
- The highest sediment retention (58.6%) occurred during summer spring tides due to the combination of high river discharge and strong tidal mixing. View evidence ↗
- The lowest sediment retention (22.1%) was observed during winter neap tides, when low river flow and tidal energy allowed sediment to move seaward. View evidence ↗
What it means
- The authors conclude that reservoir releases should be timed to coincide with tidal conditions to maximize the amount of sediment delivered to the eroding delta. View evidence ↗
- The authors state that future work should combine these findings with morphodynamic models to predict how the delta shoreline will evolve under various WSRS scenarios. View evidence ↗
Visual summary
2 visualsIllustrations explain the paper; charts are replotted from the paper's own table values.
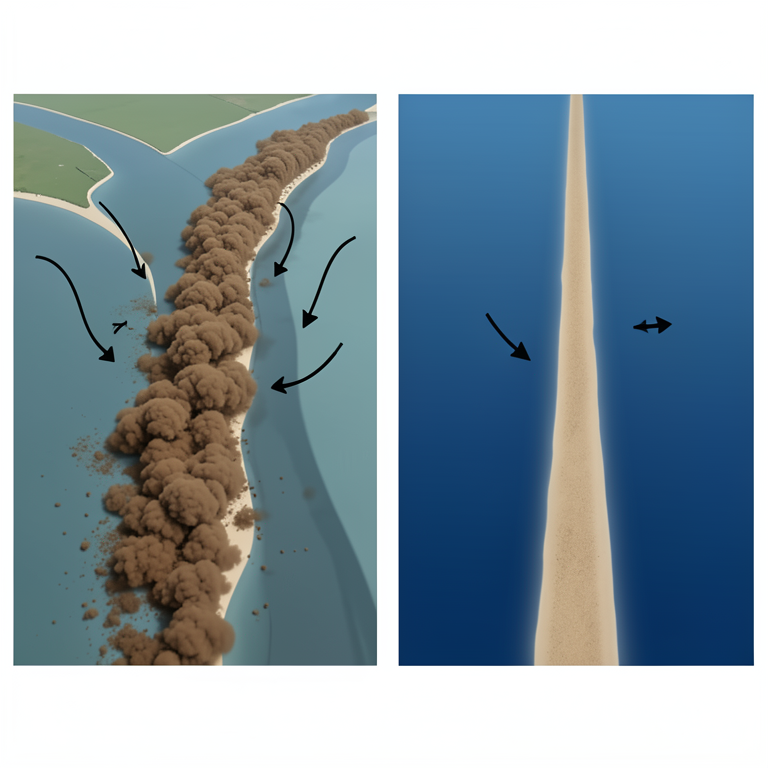
Tidal Influence on Sediment Retention
AI-generated conceptual illustration (Yellow River estuary). It explains the idea and does not show study data.
View source evidence ↗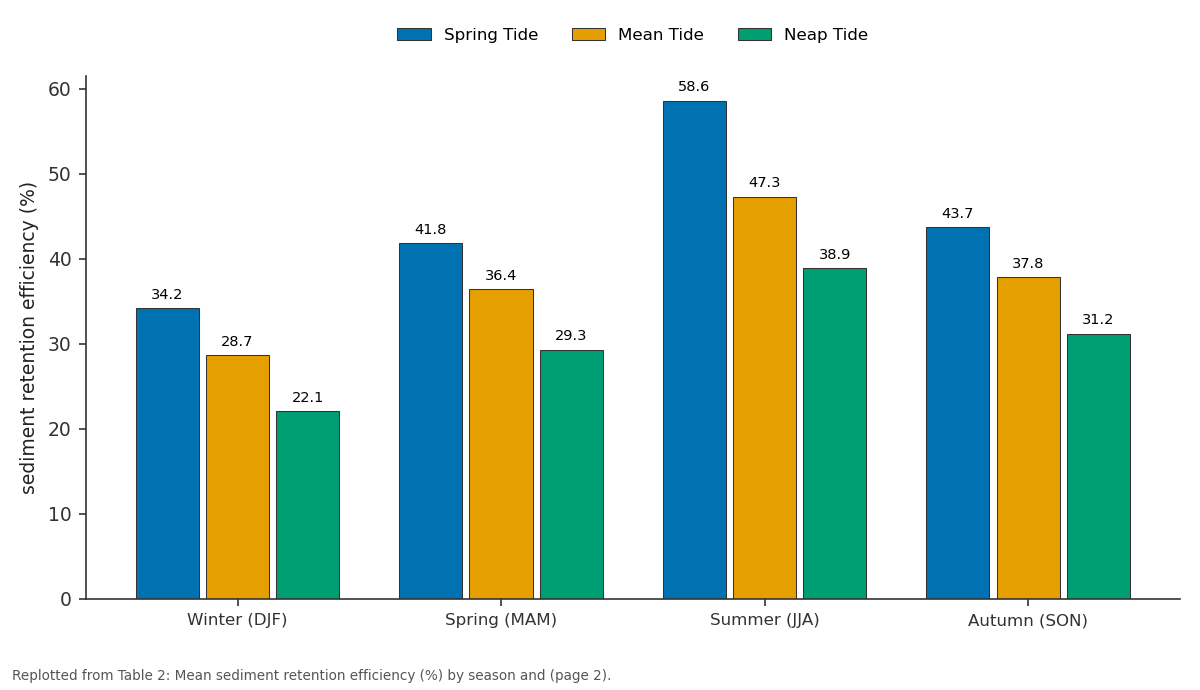
Spring Tide and Mean Tide and more: Winter (DJF) vs Spring (MAM) vs Summer (JJA) vs Autumn (SON)
Replotted from Table 2 (page 2) of the original paper. Every bar is the paper's own table value.
View source evidence ↗Figures & tables
From the original paper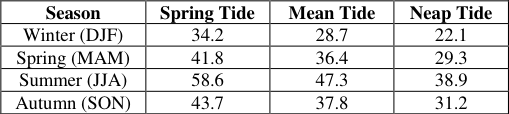 Table 2
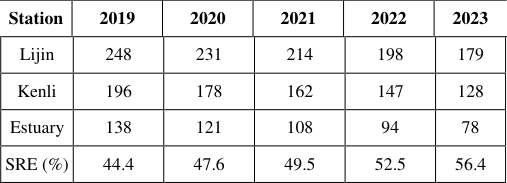 Table 1
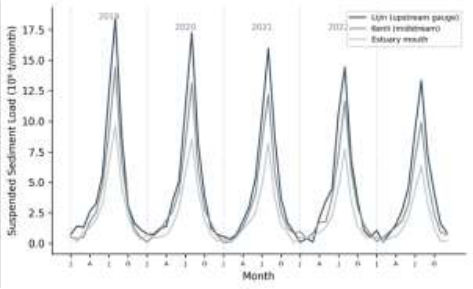 Figure 1
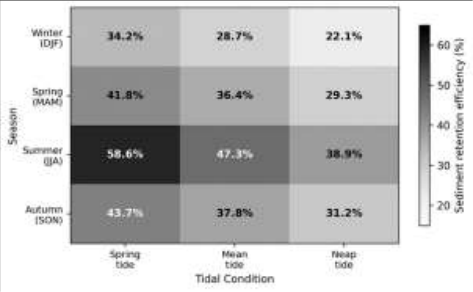 Figure 2
Introduction
"The Yellow River is the most difficult river in the world to manage," wrote Ren Mei'e in his landmark assessment of Chinese river systems, a judgement rooted in the river's extraordinary sediment yield that has shaped-and repeatedly reshaped-the North China Plain over millennia [1] . Draining the highly erodible loess plateaux of central China, the Yellow River once delivered over 1.6 billion tonnes of sediment annually to the Bohai Sea. But since the closure of Xiaolangdi Dam in 1999 and the introduction of the water-sediment regulation scheme (WSRS), this figure has fallen to between 150 and 300 million tonnes per year [2] . The WSRS operates by releasing coordinated floods from upstream reservoirs during June-July each year, flushing accumulated sediment through the lower channel and into the estuary [3] . While this has stabilised the lower river channel, the downstream effects on the estuary and delta remain incompletely understood. Wang et al. [4] documented that the Yellow River Delta switched from net accretion to net erosion after 1996, and Bi et al. [5] linked declining sediment supply to wetland retreat in the delta's nature reserve. However, most earlier work relied on annual sediment budgets rather than resolving the monthly and seasonal patterns that control where and when sediment is deposited or exported. This research aimed to characterise the spatio-temporal distribution of SSL across three stations along the lower Yellow River to the estuary mouth, determine how tidal conditions and seasonal discharge interact to control sediment retention, and identify the parameters most influencing future sediment delivery projections [6] .
Spatial Data Processing
Satellite-derived turbidity maps were generated from 87 cloud-free Landsat-8 OLI scenes acquired between January 2019 and December 2023. Surface reflectance values from the red band (Band 4) were converted to total suspended matter (TSM) concentrations using the empirical calibration of Wang and Lu [7] , validated against 34 concurrent in-situ TSM measurements (r² = 0.86, RMSE = 42 mg/L). Monthly composite turbidity maps covering the estuary and nearshore zone (extending 15 km seaward from the river mouth) were generated in Google Earth Engine. Sediment plume area was delineated using a 50 mg/L TSM threshold and its seasonal extent was quantified by pixel counting at 30-m resolution. Tidal stage at the time of each Landsat acquisition was determined from the Dongying tide gauge records provided by the State Oceanic Administration.
Material and Methods Material
The research was coordinated from the Department of Geological Sciences, Hat Yai National University of Earth Sciences, Songkhla, Thailand. Monthly suspended sediment concentration (SSC) and discharge data from three gauging stations-Lijin (upstream, 104 km from the sea), Kenli (midstream, 48 km), and the estuary mouth-were obtained from the Yellow River Conservancy Commission (YRCC) for January 2019 to December 2023. SSL was computed as the product of daily mean SSC and daily discharge, aggregated to monthly totals. Tidal records (hourly water levels) were obtained from the Dongying coastal station operated by the State Oceanic Administration [8] .
Methods
Sediment retention efficiency (SRE) was calculated for the Lijin-to-estuary reach as: SRE = (SSL_Lijin -SSL_estuary) / SSL_Lijin × 100%. SRE was computed for each month and then averaged by season (DJF, MAM, JJA, SON) and tidal condition (spring, mean, neap) to produce a seasonaltidal matrix. Tidal condition was classified from the daily tidal range at Dongying: spring (>2.4 m), mean (1.4-2.4 m), and neap (<1.4 m). Trend analysis used the Mann-Kendall test for monotonic trends in annual SSL at each station, with significance at p < 0.05 [9] . Sediment budget calculations for the estuary were performed using a box-model approach balancing river input, tidal exchange, and net deposition/erosion. Annual SSL at Lijin declined from 248 to 179 million tonnes over the five-year period (-27.8%), with Mann-Kendall tests confirming statistically significant downward trends at all three stations (p < 0.01). The sediment retention efficiency of the Lijin-estuary reach increased from 44.4% to 56.4%, indicating that a growing proportion of the declining sediment supply was being deposited within the channel and estuary rather than exported to the Bohai Sea [10] . Retention efficiency peaked during summer spring tides (58.6%) when high river discharge coincided with strong tidal mixing that promoted flocculation and settling in the turbidity maximum zone. Winter neap tides produced the lowest retention (22.1%), when both river flow and tidal energy were minimal, allowing fine sediment to be transported seaward as a thin surface plume [11] . The heatmap reveals a clear gradient from the upper-left corner (low retention under winter neap conditions) to the lower-right area (high retention under summer spring tides), confirming that both seasonal discharge and tidal energy jointly control sediment fate in the estuary.
Results
Results
Sensitivity Analysis
Sensitivity of the 2060 SSL projection to five input parameters was tested by varying each ±20% from baseline. WSRS discharge volume produced the largest response (±34% change in projected SSL), followed by flood-season precipitation (±26%) and upstream reservoir trap efficiency (±18%). Loess erosion rate and base-flow sediment concentration had smaller effects (±9% and ±7% respectively). The dominance of WSRS parameters confirms that future sediment delivery to the estuary will be controlled primarily by operational decisions rather than natural variability alone [12] .
Discussion
The 27.8% decline in SSL at Lijin over five years is steeper than the 15-20% per-decade rate reported for the 2000-2015 period by Wang et al. [4] , suggesting that sediment supply reduction may be accelerating as Xiaolangdi Reservoir's sediment-trapping capacity increases and loess plateau revegetation programmes mature. If this trend continues linearly, SSL at Lijin would fall below 100 million tonnes per year by the early 2030s-a threshold below which numerical models predict that the Yellow River Delta would shift from slow accretion to net erosion across its entire active lobe [5] . The rising retention efficiency (44.4% to 56.4%) appears paradoxical at first: a shrinking river is trapping a larger share of its already-reduced sediment load. This makes physical sense, however, because lower discharge velocities extend the residence time of water in the estuary, allowing more settling before tidal flushing can export the material seaward. The practical consequence is that the estuary channel itself is aggrading even as the delta front retreats-a pattern that could eventually necessitate dredging to maintain navigation depths. The strong sensitivity of projected SSL to WSRS operational parameters has direct policy relevance. The YRCC faces a trade-off: larger WSRS releases flush more sediment to the coast, benefiting the delta, but consume reservoir storage that is needed for summer flood control and downstream irrigation supply [13] .
Optimising this trade-off requires the kind of seasonal-tidal interaction data presented here, which can inform the timing of releases to maximise sediment delivery during spring-tide windows when retention efficiency-and hence deltabuilding potential-is highest.
Conclusion
This research documented a 27.8% decline in suspended sediment load at the Lijin gauge between 2019 and 2023, with even steeper reductions at the estuary mouth. Sediment retention efficiency in the estuary increased from 44.4% to 56.4% over the same period, driven by lower discharge velocities that promote settling. Retention was highest during summer spring tides (58.6%) and lowest during winter neap tides (22.1%). Sensitivity analysis identified WSRS discharge volume as the single most influential parameter for future sediment delivery projections. These findings highlight the need to coordinate reservoir release timing with tidal conditions to maximise sediment delivery to the eroding delta front. Future research should integrate these results with morphodynamic models to predict delta shoreline evolution under different WSRS operating scenarios [14] .
Acknowledgement
Acknowledgements Funding SourcesThis research was supported by internal institutional research funding. Institutional SupportThe authors thank the Department of Geological Sciences, Hat Yai National University of Earth Sciences, for computational and analytical support.
Figures and tables from the paper
| Season | Spring Tide | Mean Tide | Neap Tide |
|---|---|---|---|
| Winter (DJF) | 34.2 | 28.7 | 22.1 |
| Spring (MAM) | 41.8 | 36.4 | 29.3 |
| Summer (JJA) | 58.6 | 47.3 | 38.9 |
| Autumn (SON) | 43.7 | 37.8 | 31.2 |
Table text extracted from the original PDF; superscript letters are shown inline. The original table image is below.
View original table image
| Station | 2019 | 2020 | 2021 | 2022 | 2023 |
|---|---|---|---|---|---|
| Lijin | 248 | 231 | 214 | 198 | 179 |
| Kenli | 196 | 178 | 162 | 147 | 128 |
| Estuary | 138 | 121 | 108 | 94 | 78 |
| SRE (%) | 44.4 | 47.6 | 49.5 | 52.5 | 56.4 |
Table text extracted from the original PDF; superscript letters are shown inline. The original table image is below.
View original table image
References
14 in the original paper- Ren ME, Shi YL. Sediment discharge of the Yellow River and its effect on sedimentation of the Bohai and Yellow Sea. Cont Shelf Res. 1986;6(6):785-810.
- Wang HJ, Yang ZS, Saito Y, Liu JP, Sun XX. Interannual and seasonal variation of the Huanghe (Yellow River) water discharge over the past 50 years. Water Resour Res. 2006;42(12):W12401.
- Fan H, Huang HJ, Zeng TQ, Wang KR. River mouth bar formation, riverbed aggradation and channel migration in the modern Huanghe Delta. Geomorphology. 2006;74(1-4):124-136.
- Wang HJ, Wu X, Bi NS, Li S, Yuan P, Wang AM. Impacts of the dam-orientated water-sediment regulation scheme on the lower reaches and delta of the Yellow River: a review. Glob Planet Change. 2017;157:93-113.
- Bi NS, Wang HJ, Yang ZS. Recent changes in the erosion-accretion patterns of the active Huanghe delta. Geomorphology. 2014;209:23-36.
- Milliman JD, Meade RH. World-wide delivery of river sediment to the oceans. J Geol. 1983;91(1):1-21.
- Wang JJ, Lu XX. Estimation of suspended sediment concentrations using Terra MODIS. Remote Sens Environ. 2010;114(7):1534-1544.
- Yellow River Conservancy Commission (YRCC). Yellow River Sediment Bulletin. Zhengzhou: YRCC; 2023.
- Helsel DR, Hirsch RM. Statistical Methods in Water Resources. US Geological Survey Techniques of Water-Resources Investigations; 2002. p. 1-522.
- Chu ZX, Sun XG, Zhai SK, Xu KH. Changing pattern of accretion/erosion of the modern Yellow River subaerial delta: based on remote sensing images. Mar Geol. 2006;227(1-2):13-30.
- Li GX, Wei HL, Han YS, Chen YL. Sedimentation in the Yellow River delta. Part I: flow and suspended sediment structure. Mar Geol. 1998;149(1-4):93-111.
- Wu B, Wang G, Xia J, Fu X, Zhang Y. Response of bankfull discharge to discharge and sediment load in the lower Yellow River. Geomorphology. 2008;100(34):366-376.
- Ma Y, Huang HQ, Nanson GC, Li Y, Yao W. Channel adjustments in response to the operation of large dams: the upper reach of the lower Yellow River. Geomorphology. 2012;147-148:35-48.
- Syvitski JPM, Saito Y. Morphodynamics of deltas under the influence of humans. Glob Planet Change. 2007;57(3-4):261-282.