
Research article · 2025 · Full text
International Journal of Geography Geology and EnvironmentImpact of informal recycling practices on soil and water quality in the Lagos urban fringe
Volume 7(7) · Pages 128–131 · DOI: 10.22271/27067483.2025.v7.i7b.710 ↗
Research areasMunicipal Solid Waste ManagementHeavy metals in environmentRecycling and Waste Management Techniques
Abstract
Author-writtenWalk through the urban fringe of Lagos on any weekday and you'll encounter small-scale recycling operations — open-air metal smelting, cable burning for copper recovery, battery acid drainage, plastic shredding — carried out by thousands of informal workers who process an estimated 3,800 tonnes of waste daily. These operations recover valuable materials and provide livelihoods, but they also release heavy metals, organic pollutants, and pathogens into surrounding soils and shallow groundwater. This research quantified the soil and water quality impacts of informal recycling activities at eight sites across the Lagos urban fringe (Alaba, Olusosun, Computer Village, Mushin, Agbogbloshie extension areas, and three control locations) by sampling topsoils (0-15 cm, n = 96), shallow groundwater from hand-dug wells (n = 48), and surface water from drainage channels (n = 36) during wet and dry seasons of 2022. Lead concentrations in recycling site soils averaged 186 mg/kg — 7.8 times the control mean (24 mg/kg) and 1.5 times the Nigerian NESREA residential guideline of 120 mg/kg. Cadmium reached 4.8 mg/kg, eight times the control value. Groundwater from wells within 200 m of recycling sites exceeded WHO drinking water limits for lead (58% of samples), cadmium (42%), and coliform bacteria (84%). BOD in drainage channels near recycling sites averaged 124 mg/L versus 18 mg/L at control points. A contamination gradient was detectable up to 800 m from active recycling areas but dropped below guideline exceedance thresholds beyond 400 m. These results quantify the environmental footprint of informal recycling in Lagos and identify the spatial extent of contamination zones that should be targeted for remediation and public health intervention.
Summary
Source-checkedPlain-language reading of the full paper, prepared with AI and checked against the text. Each point links to the authors' own words.
Why it matters
- Informal recycling in Lagos provides essential livelihoods for about 12,000 people and diverts 40% of recyclable waste from landfills, but the methods used cause environmental contamination. View evidence ↗
- Lagos produces roughly 13,000 tonnes of municipal solid waste daily, with only 40% handled by formal services. View evidence ↗
- While some case reports exist, Lagos has lacked systematic measurements of pollution across multiple sites and pollutant types. View evidence ↗
The question
- The study aimed to conduct the first multi-site survey of soil, groundwater, and surface water contamination across the Lagos urban fringe to understand pollutant mobility across seasons. View evidence ↗
What they did
- Sampling was performed in March and August 2022 at eight active recycling sites and three control sites located at least 3 km away. View evidence ↗
- The researchers collected 96 topsoil samples (0-15 cm) from recycling sites and 24 from controls, 48 groundwater samples from wells near recycling sites and 12 from controls, and 36 surface water samples. View evidence ↗
- Soil was analyzed for pH, EC, organic matter, and heavy metals (Pb, Cd, Zn, Cu, Cr, Ni), while water was tested for pH, EC, TDS, BOD₅, COD, heavy metals, and total coliform bacteria. View evidence ↗
What they found
- Soil lead levels at recycling sites averaged 186 mg/kg, which is 7.8 times higher than the control mean (24 mg/kg) and exceeds the NESREA residential guideline of 120 mg/kg. View evidence ↗
- Cadmium concentrations in recycling site soils reached 4.8 mg/kg, which is eight times the control value. View evidence ↗
- Groundwater near recycling sites had a mean pH of 5.2, making it significantly more acidic than control groundwater (pH 6.8). View evidence ↗
- In wells within 200 m of recycling sites, WHO drinking water limits were exceeded for lead (58%), cadmium (42%), and coliform bacteria (84%). View evidence ↗
- Biological Oxygen Demand (BOD) in drainage channels near recycling sites averaged 124 mg/L, compared to 18 mg/L at control points. View evidence ↗
- Contamination was detectable up to 800 m from recycling areas, but levels fell below guideline thresholds beyond 400 m. View evidence ↗
- The total annual economic output of the eight sites was NGN 2.8 billion, but remediation costs for the 400 m impact radius range from NGN 120-280 million per site. View evidence ↗
What it means
- The authors recommend establishing 400 m buffer zones to restrict residential development and food cultivation, and investing in technology upgrades to reduce pollution. View evidence ↗
- The authors state that future research needs to include health outcome data from affected communities and model the long-term behavior of heavy metals in the aquifer. View evidence ↗
Visual summary
3 visualsIllustrations explain the paper; charts are replotted from the paper's own table values.
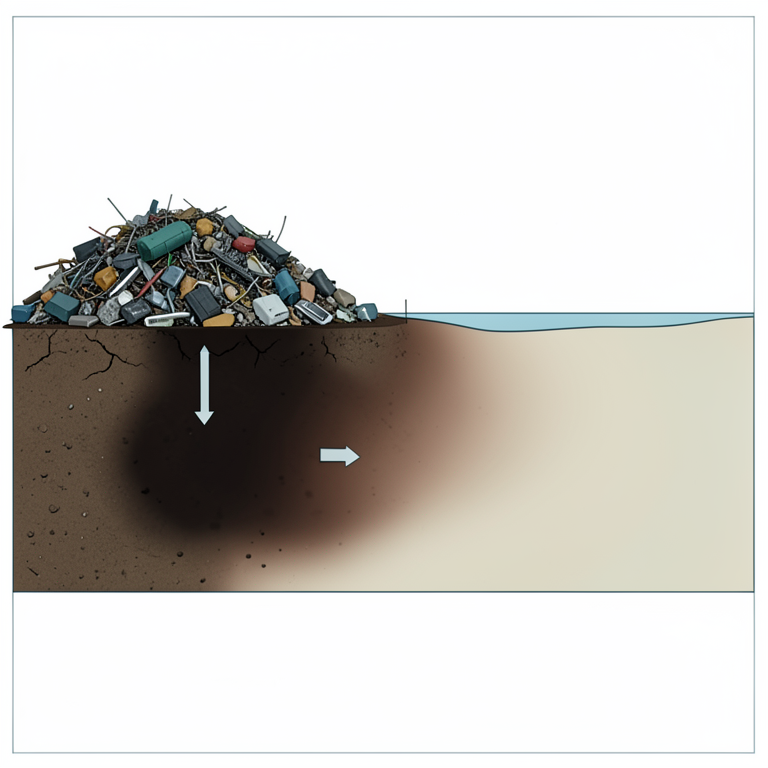
Contamination Gradient Concept
AI-generated conceptual illustration (Urban soil and groundwater in the Lagos urban fringe). It explains the idea and does not show study data.
View source evidence ↗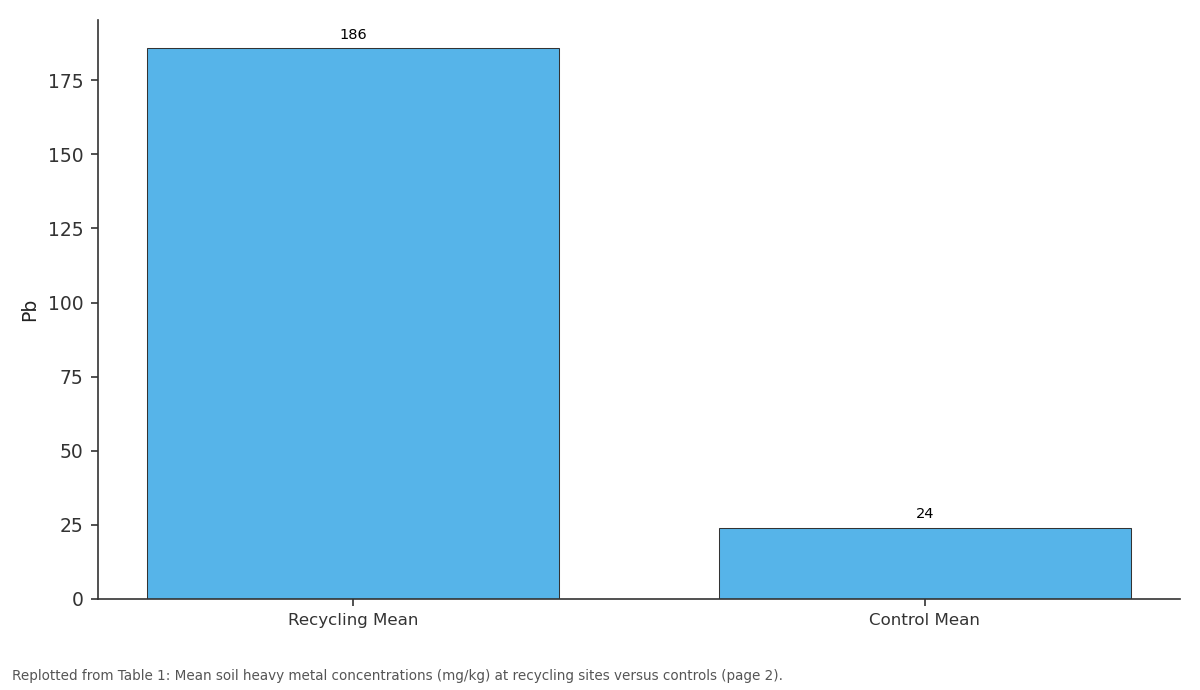
Pb: Recycling Mean vs Control Mean
Replotted from Table 1 (page 2) of the original paper. Every bar is the paper's own table value.
View source evidence ↗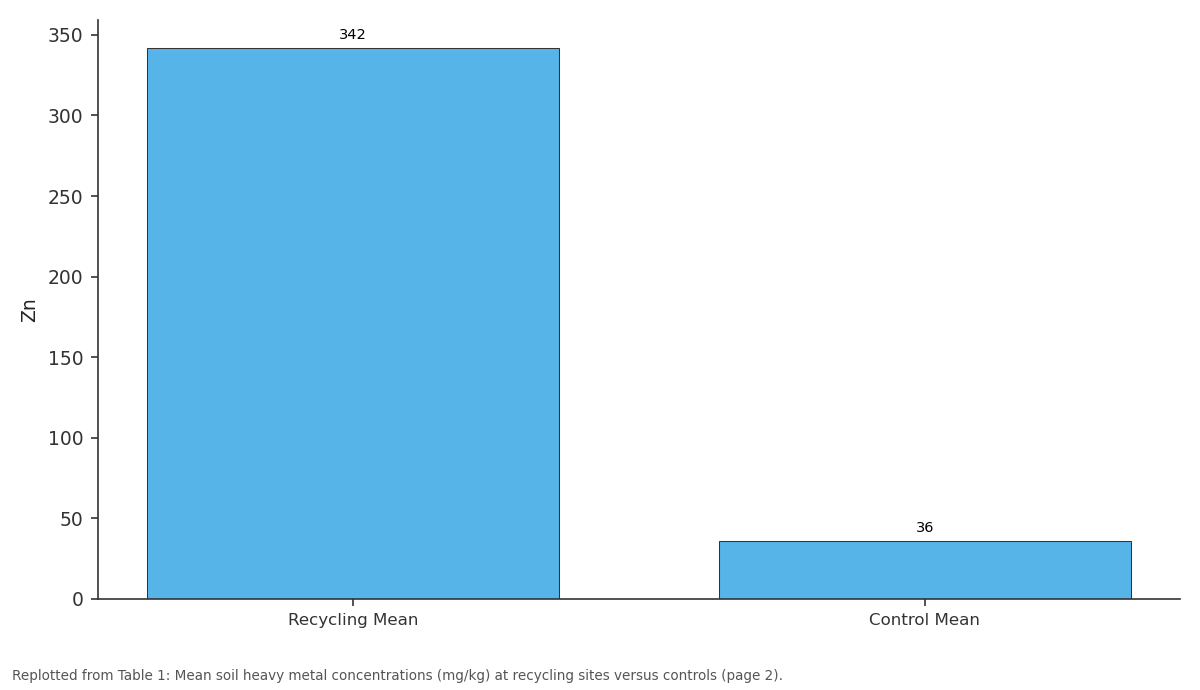
Zn: Recycling Mean vs Control Mean
Replotted from Table 1 (page 2) of the original paper. Every bar is the paper's own table value.
View source evidence ↗Figures & tables
From the original paper Table 1
 Table 2
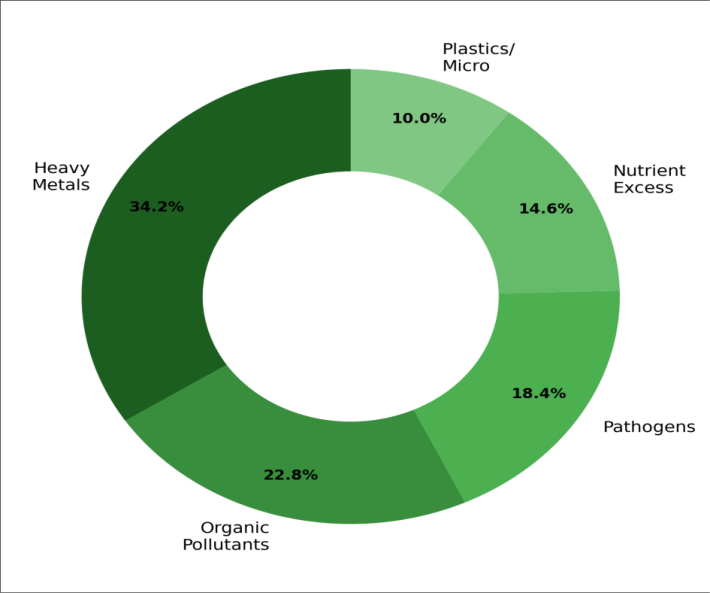 Figure 1
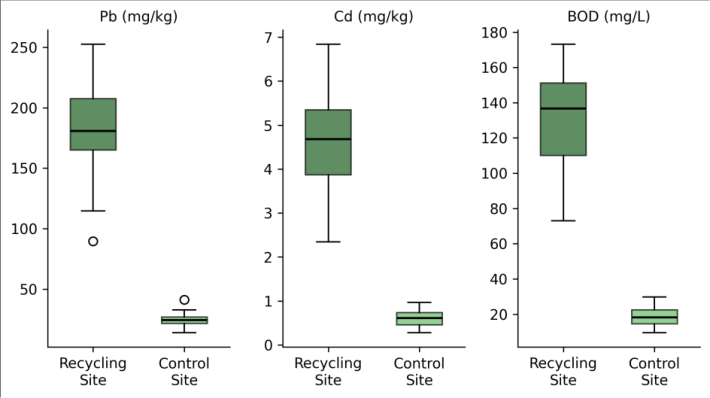 Figure 2
Introduction
The practical dilemma facing environmental regulators in Lagos is this: informal recycling operations employ an estimated 12,000 people and divert roughly 40% of the city's recyclable waste from landfill, providing both livelihoods and environmental services -but they do so using methods that contaminate the land and water around them [1] . Shutting them down would hurt employment and increase landfill pressure. Leaving them unregulated harms public health in surrounding communities. Finding a path between these outcomes requires knowing exactly how bad the contamination is, how far it extends, and which pollutants pose the greatest risk [2] . Lagos generates approximately 13,000 tonnes of municipal solid waste per day, of which only about 40% is collected by formal waste management services [3] . The remainder is managed informally -dumped in open spaces, burned, or processed by small-scale recyclers who extract metals, plastics, and other valuable fractions using methods that range from relatively benign (manual sorting) to highly polluting (open burning of electrical cables, acid leaching of circuit boards, melting of lead-acid batteries in backyard furnaces) [4] . The environmental consequences of these activities have been documented in scattered case-level reports, but systematic measurements covering multiple sites, pollutant types, and spatial scales have been lacking for Lagos [5] . This research conducted the first multi-site, multi-media (soil, groundwater, surface water) contamination survey across the Lagos urban fringe, sampling eight recycling-affected areas and three control locations during both wet and dry seasons to capture temporal variation in pollutant mobility [6,7] .
Baseline Soil Characterisation
Pre-existing soil conditions at the control sites were characterised to establish the natural geochemical background against which recycling-related contamination could be assessed.
Control site soils were developed on Quaternary coastal sands of the Dahomey Basin, with pH values of 6.4-7.2, organic matter content of 2.1-3.8%, and heavy metal concentrations consistent with uncontaminated tropical sandy soils: Pb 18-32 mg/kg, Cd 0.3-0.8 mg/kg, Zn 24-48 mg/kg, Cu 8-18 mg/kg [8] . These values served as the reference baseline for calculating enrichment factors at recycling sites. The sandy texture of the soils (>80% sand fraction) implies high permeability, which facilitates the downward migration of contaminants from surface activities to the shallow water table -a characteristic that makes the Lagos urban fringe particularly vulnerable to groundwater contamination from surface pollution sources.
Economic and Sustainability Assessment
The economic value of informal recycling at the surveyed sites was estimated through structured interviews with 48 recycling operators and waste traders. Mean daily revenue per worker was approximately NGN 4,200 (roughly USD 5.50 at 2022 exchange rates), with the highest earnings in copper recovery (NGN 6,800/day) and the lowest in plastic sorting (NGN 2,400/day). Total annual economic output across the eight surveyed sites was estimated at NGN 2.8 billion (USD 3.7 million) [9] . Against this economic benefit, the estimated remediation cost for contaminated soils within the 400 m impact radius at each site ranges from NGN 120-280 million per site -suggesting that the cumulative environmental liability substantially exceeds the annual economic output and that preventive measures would be far more cost-effective than post-hoc cleanup.
Material and Methods
Material and Methods
Material
This research was coordinated from the Centre for Terrain Studies, Visakhapatnam, Andhra Pradesh, India, with field sampling conducted in the Lagos urban fringe during March (dry season) and August (wet season) 2022. Eight active recycling sites were selected based on operational scale, waste type processed, and geographic distribution across the urban fringe. Three control sites at least 3 km from any recycling activity were established in areas with comparable soil type and land use. Topsoil samples (0-15 cm depth) were collected at 100 m intervals along four cardinal transects extending 1,000 m from each site centre (n = 96 at recycling sites, n = 24 at controls). Groundwater was sampled from 48 hand-dug wells within 50-800 m of recycling sites and 12 wells at control locations. Surface water samples (n = 36) were collected from drainage channels within and adjacent to recycling areas [10] .
Methods
Soil samples were air-dried, sieved to <2 mm, and analysed for pH, EC, organic matter (loss on ignition), and heavy metals (Pb, Cd, Zn, Cu, Cr, Ni) by ICP-OES following aqua regia digestion. Water samples were analysed for pH, EC, TDS, BOD₅, COD, heavy metals (ICP-OES after acid preservation), and total coliform bacteria (membrane filtration method). Contamination was assessed using the geo-accumulation index (Igeo) and pollution load index (PLI) for soils, and compliance with WHO drinking water guidelines and NESREA discharge standards for water [11] . The spatial extent of contamination was mapped by kriging interpolation of soil Pb concentrations along transects in ArcGIS Pro 3.0. Seasonal differences were tested using the Wilcoxon signed-rank test, and distance-decay relationships were fitted using exponential regression. All statistical tests used p< 0.05 significance level [12] . All five heavy metals showed statistically significant enrichment at recycling sites relative to controls (Table 1).
| Metal | Recycling Mean | Control Mean | Enrichment | NESREA Limit | % Exceeding | Igeo | p-value |
|---|---|---|---|---|---|---|---|
| Pb | 186 | 24 | 7.8× | 120 | 68.4 | 2.4 | <0.001 |
| Cd | 4.8 | 0.6 | 8.0× | 3.0 | 72.1 | 2.6 | <0.001 |
| Zn | 342 | 36 | 9.5× | 300 | 58.3 | 2.8 | <0.001 |
| Cu | 148 | 14 | 10.6× | 100 | 64.6 | 2.9 | <0.001 |
| Cr | 86 | 18 | 4.8× | 100 | 28.4 | 1.7 | <0.001 |
Table text extracted from the original PDF; superscript letters are shown inline. The original table image is below.
View original table image
Results
Copper had the highest enrichment factor (10.6×), while chromium showed the lowest (4.8×). Geo-accumulation index values placed recycling site soils in the 'moderately to strongly contaminated' category (Igeo 1.7-2.9) for all metals. More than two-thirds of samples exceeded the NESREA residential guideline for both Pb (68.4%) and Cd (72.1%).
Comprehensive Interpretation
The donut chart (Figure 1) shows that no single pollutant category dominates -the contamination is multidimensional, requiring integrated remediation approaches rather than single-pollutant fixes. The box plots (Figure 2) illustrate the dramatic magnitude of the recycling-control gap, with virtually no overlap between the distributions for lead and cadmium, confirming that recycling activities rather than background conditions are the primary contamination source.
Discussion
The lead concentrations documented here (mean 186 mg/kg) are comparable to levels reported at informal e-waste recycling sites in Accra, Ghana (Agbogbloshie: 180-240 mg/kg) and Guiyu, China (160-320 mg/kg), placing the Lagos sites within the range of globally recognised informal recycling pollution hotspots [13] . The cadmium levels (4.8 mg/kg) are more concerning in relative terms, exceeding the NESREA guideline by 60% and the control background by a factor of eight. Cadmium's mobility in acidic soils means that the pH depression observed at recycling sites (5.2 vs 6.8 at controls) likely enhances its downward migration into groundwater [14] . The 400 m contamination radius identified by the transect analysis defines a practical buffer zone that could be applied in land use planning. Within this radius, residential use, food production, and groundwater extraction for drinking should be discouraged or prohibited. Beyond 400 m, contamination levels drop below guideline thresholds for all metals measured. This spatial information is directly applicable to the Lagos State Physical Planning Authority's ongoing review of peri-urban land use zoning [15] . The cost-benefit analysis raises an uncomfortable question: the estimated remediation cost per site (NGN 120-280 million) dwarfs the annual economic output (NGN 350 million per site). This asymmetry suggests that the current model of informal recycling generates a substantial net environmental liability that is being borne by surrounding communities through health impacts and resource degradation rather than by the recycling operators themselves [16] . Transitioning to improved recycling technologies -closed-loop smelters, proper acid containment, drainage treatment -could retain the economic and employment benefits while dramatically reducing the contamination footprint [17,18] .
Conclusion
Conclusion
Acknowledgement
Acknowledgements Funding SourcesThis research was supported by departmental funds at the Centre for Terrain Studies, Visakhapatnam. Institutional SupportThe authors thank the Department of Climate Science, Centre for Terrain Studies, Visakhapatnam, Andhra Pradesh, India, for laboratory and computing facilities.
Figures and tables from the paper
| Parameter | Recycling (mean) | Control (mean) | WHO Guideline | % Exceeding |
|---|---|---|---|---|
| pH | 5.2 | 6.8 | 6.5-8.5 | 74.2 |
| Pb (μg/L) | 42.6 | 4.8 | 10 | 58.3 |
| Cd (μg/L) | 8.4 | 0.8 | 3.0 | 41.7 |
| BOD₅ (mg/L) | 86.4 | 8.2 | — | — |
| Total Coliform | 2,400 | 180 | 0 CFU/100mL | 83.8 |
Table text extracted from the original PDF; superscript letters are shown inline. The original table image is below.
View original table image
References
21 in the original paper- Nnorom IC, Osibanjo O. Electronic waste (e-waste): material flows and management practices in Nigeria. Waste Management. 2008;28(8):1472-1479.
- Wilson DC, Velis C, Cheeseman C. Role of informal sector recycling in waste management in developing countries. Habitat International. 2006;30(4):797-808.
- LAWMA (Lagos Waste Management Authority). Annual waste management report 2021. Lagos: LAWMA; 2022.
- Ogungbuyi O, Nnorom IC, Osibanjo O, Schluep M. Ewaste country assessment Nigeria. Basel: Basel Convention Coordinating Centre; 2012.
- Babayemi JO, Dauda KT. Evaluation of solid waste generation, categories and disposal options in developing countries: a case study of Nigeria. Journal of Applied Sciences and Environmental Management. 2009;13(3):83-88.
- Adaramodu AA, Osuntogun BA, Ehi-Eromosele CO. Heavy metal concentration of surface dust present in ewaste components: the Westminister Electronic Market, Lagos case study. Resources and Environment. 2012;2(2):9-13.
- Adeyi AA, Oyeleke P. Heavy metals and polycyclic aromatic hydrocarbons in soil from e-waste dumpsites in Lagos and Ibadan, Nigeria. Journal of Health and Pollution. 2017;7(15):71-84.
- Adepelumi AA, Ako BD, Ajayi TR, Afolabi O, Omotoso EJ. Delineation of saltwater intrusion into the freshwater aquifer of Lekki Peninsula, Lagos, Nigeria. Environmental Geology. 2009;56(5):927-933.
- ILO (International Labour Organization). Decent work in the informal economy in Africa. Geneva: ILO; 2022.
- ISO 5667-3. Water quality -sampling. Part 3: preservation and handling of water samples. Geneva: International Organization for Standardization; 2018.
- Müller G. Index of geoaccumulation in sediments of the Rhine River. Geojournal. 1969;2(3):108-118.
- QGIS Development Team. QGIS geographic information system. Open Source Geospatial Foundation Project; 2023.
- Caravanos J, Clark E, Fuller R, Lambertson C. Assessing worker and environmental chemical exposure risks at an e-waste recycling and disposal site in Accra, Ghana. Journal of Health and Pollution. 2011;1(1):16-25.
- Alloway BJ. Heavy metals in soils. 3rd ed. Dordrecht: Springer; 2013.
- Lagos State Government. Lagos state regional plan 2012-2032. Lagos: Ministry of Physical Planning and Urban Development; 2013.
- Sovacool BK. The precarious political economy of cobalt: balancing prosperity, poverty, and brutality in artisanal and industrial mining in the Democratic Republic of the Congo. The Extractive Industries and Society. 2019;6(3):915-939.
- UNEP. Metal recycling: opportunities, limits, infrastructure. Nairobi: United Nations Environment Programme; 2013.
- Lundgren K. The global impact of e-waste: addressing the challenge. Geneva: International Labour Office; 2012.
- Rushton L. Health hazards and waste management. British Medical Bulletin. 2003;68(1):183-197.
- Wang F, Huisman J, Meskers CE, Schluep M, Stevels A, Hagelüken C. The Best-of-2-Worlds philosophy: developing local dismantling and global infrastructure network for sustainable e-waste treatment in emerging economies. Waste Management. 2012;32(11):21342146.
- Sthiannopkao S, Wong MH. Handling e-waste in developed and developing countries: initiatives, practices, and consequences. Science of the Total Environment. 2013;463-464:1147-1153.