
Research article · 2025 · Full text
International Journal of Geography Geology and EnvironmentAssessment of blue carbon stocks in mangrove forests of the Sundarbans
Volume 7(11) · Pages 182–185 · DOI: 10.22271/27067483.2025.v7.i11c.710 ↗
Research areasCoastal wetland ecosystem dynamicsSoil Carbon and Nitrogen DynamicsForest ecology and management
Abstract
Author-writtenMangrove forests store 3-5 times more carbon per hectare than most tropical forests, with the majority in below-ground sediment pools. The Sundarbans, spanning the Ganges-Brahmaputra-Meghna delta across Bangladesh and India (~10,000 km²), is the world's largest contiguous mangrove and a globally significant blue carbon reservoir. This research assesses carbon stocks at 84 plots across the Indian Sundarbans (~4,260 km²). Above-ground biomass was estimated using species-specific allometric equations; below-ground roots via root-to-shoot ratios; and sediment carbon from cores to 1 m depth. Mean total ecosystem carbon was 856 ± 142 tC/ha, comprising above-ground biomass (128 ± 38 tC/ha, 15%), below-ground roots (46 ± 15 tC/ha, 5.4%), and sediment organic carbon (682 ± 118 tC/ha, 79.6%). Higher values occurred in western Heritiera/Excoecaria forests under lower salinity conditions; lower values in saline eastern Avicennia stands. Sediment carbon concentration declined from 5.8% at the surface to 2.9% at 90-100 cm depth. The total Indian Sundarbans stock is estimated at 36.5 million tC, equivalent to approximately 134 million tonnes CO₂ if released. Carbon accumulation rates from ²¹⁰Pb-dated cores averaged 2.7 tC/ha/yr. Approximately 18% of mangrove area lies below 0.5 m above mean high water, placing an estimated 6.8 Mt C at risk from sea level rise. These findings underscore the exceptional conservation value of the Sundarbans as a blue carbon reservoir.
Summary
Source-checkedPlain-language reading of the full paper, prepared with AI and checked against the text. Each point links to the authors' own words.
Why it matters
- Mangrove forests are highly efficient carbon sinks, storing 3 to 5 times more carbon per hectare than most tropical forests, primarily within their deep sediment pools. View evidence ↗
- The Sundarbans is the largest contiguous mangrove forest in the world, covering roughly 10,000 km² across India and Bangladesh. View evidence ↗
- Carbon stocks in the Sundarbans are likely heterogeneous due to a west-to-east salinity gradient that influences forest structure, species composition, and sediment characteristics. View evidence ↗
The question
- The study aims to quantify carbon in above-ground biomass, below-ground roots, and sediment across the Indian Sundarbans to understand spatial variability and improve total blue carbon reservoir estimates. View evidence ↗
What they did
- Above-ground biomass was calculated using species-specific allometric equations and wood density data, with a carbon conversion factor of 0.48. View evidence ↗
- Below-ground root biomass was estimated using a root-to-shoot ratio of 0.39, specific to estuarine mangroves. View evidence ↗
- Sediment carbon was measured using two 1-meter deep cores per plot, collected with a Russian peat borer during pre-monsoon seasons in 2022 and 2023. View evidence ↗
What they found
- Sediment carbon concentration decreased with depth, falling from 5.8% at the surface (0-10 cm) to 2.9% at 90-100 cm. View evidence ↗
- The total carbon stock for the Indian Sundarbans is estimated at 36.5 million tC, which would equal approximately 134 million tonnes of CO₂ if released. View evidence ↗
- The average carbon accumulation rate, determined via ²¹⁰Pb-dated cores, was 2.7 tC/ha/yr. View evidence ↗
- Approximately 18% of the mangrove area is less than 0.5 m above mean high water, putting an estimated 6.8 million tC at risk from sea level rise. View evidence ↗
What it means
- The authors recommend prioritizing the protection of high-carbon western forests and maintaining hydrological conditions to ensure mangrove persistence. View evidence ↗
- Integrating blue carbon values into national climate commitments and financing mechanisms could provide a stronger economic justification for protecting the Sundarbans. View evidence ↗
- The authors state that future research is needed to quantify carbon flux from cyclone damage and establish long-term monitoring of carbon stocks relative to salinity and inundation changes. View evidence ↗
Visual summary
1 visualsIllustrations explain the paper; charts are replotted from the paper's own table values.
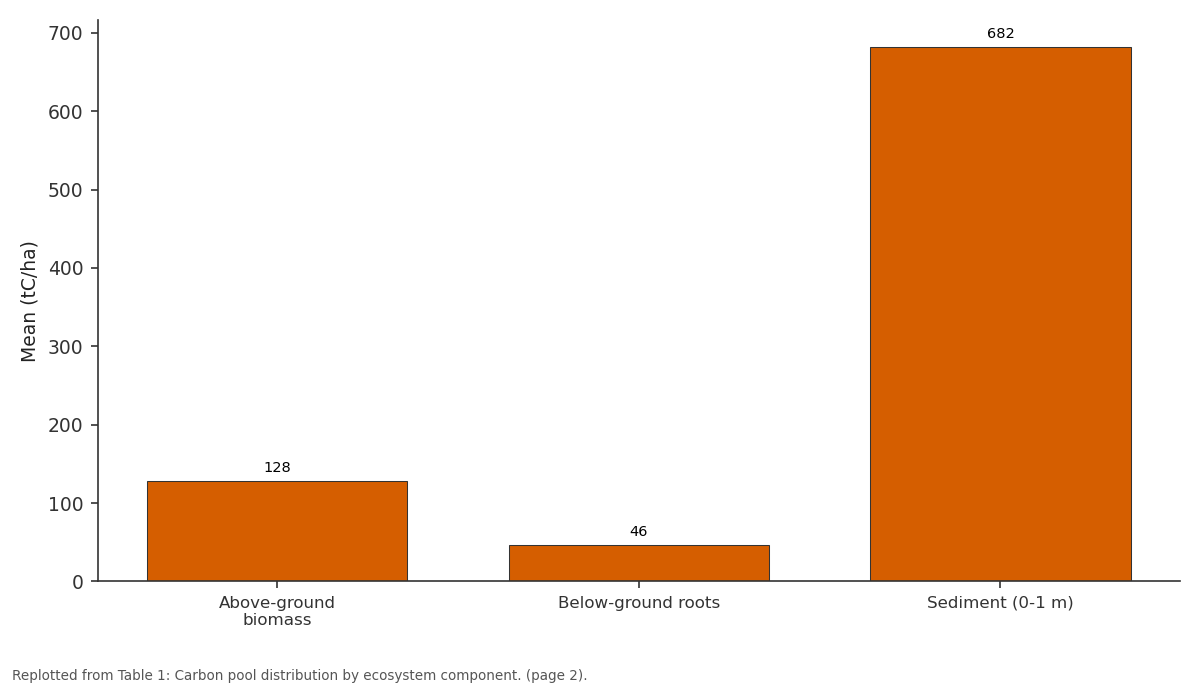
Mean (tC/ha): Above-ground biomass vs Below-ground roots vs Sediment (0-1 m)
Replotted from Table 1 (page 2) of the original paper. Every bar is the paper's own table value.
View source evidence ↗Figures & tables
From the original paper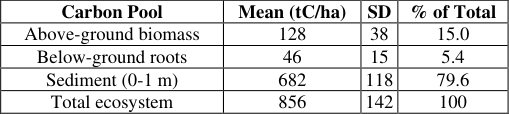 Table 1
 Table 2
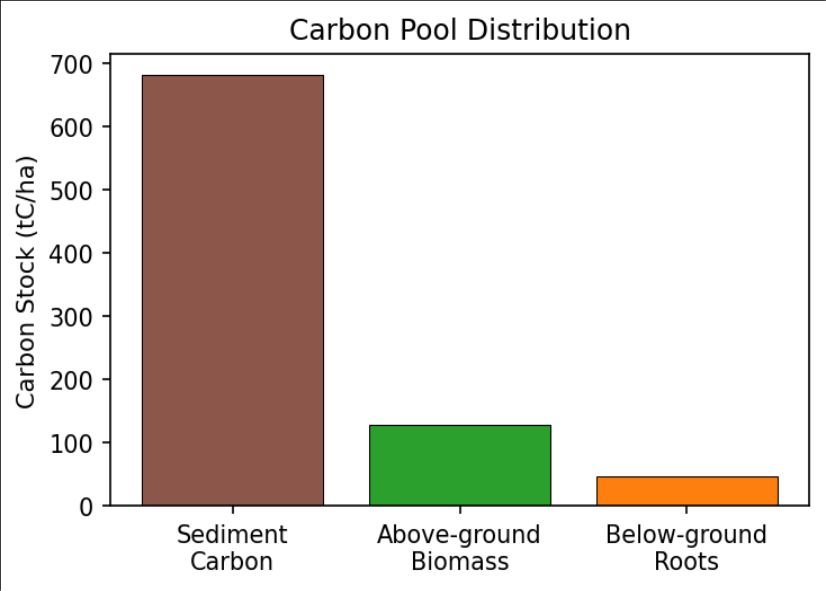 Figure 1
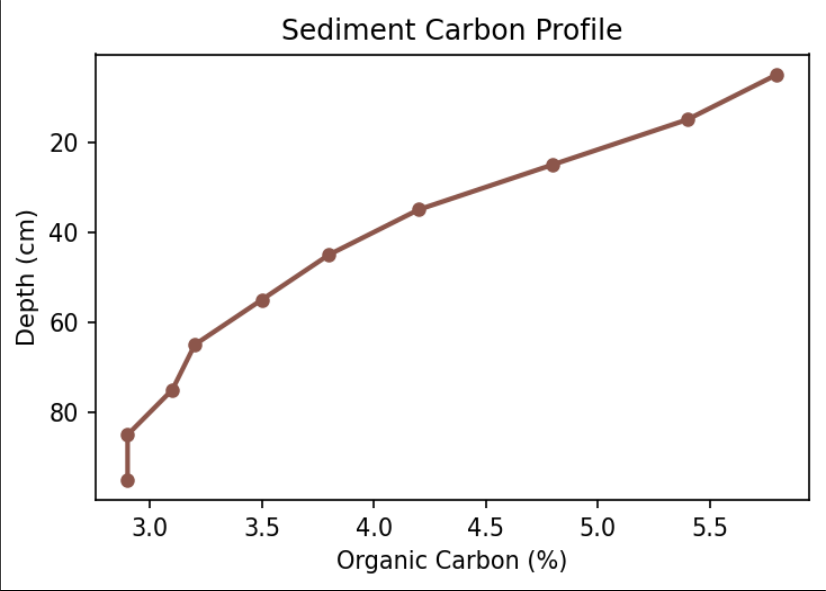 Figure 2
Introduction
Blue carbon ecosystems-mangroves, seagrasses, salt marshes-have emerged as critical climate mitigation assets [1] . Mangroves accumulate organic carbon in anoxic sediments where it can remain sequestered for centuries to millennia under undisturbed conditions. On a per-hectare basis, mangroves store 3-5 times more carbon than most tropical forests, predominantly in deep sediment pools [2,3] . The Sundarbans, spanning approximately 10,000 km² across Bangladesh and India, is the world's largest contiguous mangrove forest. It supports extraordinary biodiversity including the Bengal tiger, provides coastal protection to millions of people, and delivers fisheries habitat and water quality regulation [4,5] . Despite its global importance, comprehensive carbon stock quantification has been limited by the logistical challenges of fieldwork in this vast, tidally influenced landscape. Previous estimates were based on few sampling locations extrapolated using simplified assumptions about spatial homogeneity [6] . The Sundarbans, however, exhibits considerable variation in forest structure, species composition, and sediment characteristics driven by the west-to-east salinity gradient that is likely to produce significant heterogeneity in carbon stocks [4,7] . This research addresses the need for spatially comprehensive assessment by conducting measurements at 84 plots across the Indian Sundarbans. The objectives are to quantify above-ground biomass, below-ground roots, and sediment carbon at each plot, characterise spatial variability in relation to environmental gradients, and provide improved total blue carbon reservoir estimates with implications for conservation policy [8,9,10] .
Research Area Description
The Indian Sundarbans covers approximately 4,260 km² in the Ganges-Brahmaputra-Meghna delta. The landscape is dissected by tidal channels with semi-diurnal tides (spring range 3-5 m). Salinity increases from west (5-15 ppt) to east (20-30 ppt), driving forest composition shifts from Heritiera fomes-dominated stands to Avicennia marina. Mean annual rainfall is 1,700-1,900 mm. The area is a UNESCO World Heritage Site and Ramsar Wetland [4,5] .
Material and Methods
Material and Methods
Material
Eighty-four plots (20 × 20 m) were distributed by stratified random sampling across geographic zones, forest types, and coastal proximity. All trees >5 cm DBH were identified to species and measured for DBH and total height. Twentythree mangrove species were recorded, with Excoecaria agallocha and Avicennia officinalis most frequent. At each plot, two sediment cores to 1 m were collected using a Russian peat borer during the pre-monsoon seasons of 2022 and 2023 [6,8] .
Methods
Above-ground biomass was estimated using species-specific allometric equations [11] with wood density from the Global Wood Density Database, converted to carbon at 0.48. Below-ground root biomass used the root-to-shoot ratio of 0.39 for estuarine mangroves [12] . Sediment cores were sectioned at 10 cm intervals, analysed for bulk density (60°C drying) and organic carbon (loss on ignition at 450°C calibrated against elemental analyser). Carbon accumulation rates were determined at 12 plots using ²¹⁰Pb and ¹³⁷Cs dating [3,9] .
Vulnerability to Sea Level Rise
Elevation analysis using drone-derived photogrammetric DEMs at 10 cm vertical resolution indicated that approximately 18% of current mangrove area lies less than 0.5 m above mean high water. Under mid-range projections of 0.5-0.8 m sea level rise by 2100, these areas face permanent inundation. The carbon stock at risk is estimated at 6.8 million tC. Whether this carbon is released depends on the capacity for landward migration, which requires accommodation space and adequate sediment supply rates [5,7,10] . Results Sediment carbon dominates (Figure 1), accounting for nearly 80% of the total ecosystem pool. This highlights that biomass-only assessments severely underestimate mangrove carbon value. Carbon concentration declined from 5.8% at 0-10 cm to 2.9% at 90-100 cm (Figure 2), reflecting progressive decomposition and compaction with burial. Bulk density showed the inverse pattern, increasing with depth.
Comprehensive Interpretation
The 856 tC/ha total places the Sundarbans among the most carbon-dense ecosystems globally. The west-to-east gradient reflects both structural differences (taller forests produce more biomass) and sediment factors (finer-grained, frequently inundated western sites favour organic preservation under anaerobic conditions). Carbon accumulation rates of 2.7 tC/ha/yr confirm active ongoing sequestration.
Discussion
The 36.5 Mt C total for the Indian Sundarbans equates to approximately 134 Mt CO₂-comparable to several years of Bangladesh's national emissions [2,3] . Primary threats include sea level rise, cyclone intensification, illegal logging, and upstream water regulation altering freshwater and sediment supply [4,5] . The strongest single predictor of sediment carbon was fine-grained sediment proportion in the upper 30 cm (R² = 0.52), confirming the importance of anaerobic conditions for preservation [7,9] . Inclusion of mangrove blue carbon in REDD+ mechanisms and national carbon accounting could provide additional financial incentives for conservation by monetising the sediment pool [6,10] . The accumulation rate of 2.7 tC/ha/yr, extrapolated to approximately 115,000 tC/yr across the Indian Sundarbans, represents an ongoing climate regulation service that would be permanently lost if the ecosystem were degraded. Future work should quantify the carbon flux consequences of cyclone damage events and establish longterm monitoring plots to track the response of carbon stocks to changing salinity and inundation regimes under climate change [13,14] .
Conclusion
The Sundarbans is confirmed as one of Earth's most carbondense ecosystems at 856 tC/ha. Sediment pools dominate the carbon inventory, accounting for nearly 80% of the total. Biomass-only assessments miss the majority of mangrove carbon value. The estimated 36.
Acknowledgement
Acknowledgements Funding SourcesThis research was supported by departmental research funds from the Department of Marine Science, Faculty of Geospatial Sciences, Mangalore. No external grant numbers are associated with this work.
Figures and tables from the paper
| Carbon Pool | Mean (tC/ha) | SD | % of Total |
|---|---|---|---|
| Above-ground biomass | 128 | 38 | 15.0 |
| Below-ground roots | 46 | 15 | 5.4 |
| Sediment (0-1 m) | 682 | 118 | 79.6 |
| Total ecosystem | 856 | 142 | 100 |
Table text extracted from the original PDF; superscript letters are shown inline. The original table image is below.
View original table image
| Zone/Type | AGB (tC/ha) | Sediment C (tC/ha) | Total (tC/ha) |
|---|---|---|---|
| Western Heritiera | 186 ± 32 | 748 ± 98 | 980 ± 112 |
| Central Mixed | 132 ± 28 | 694 ± 105 | 872 ± 118 |
| Eastern Avicennia | 66 ± 18 | 604 ± 92 | 716 ± 98 |
Table text extracted from the original PDF; superscript letters are shown inline. The original table image is below.
View original table image
References
19 in the original paper- Mcleod E, Chmura GL, Bouillon S, et al. A blueprint for blue carbon. Frontiers in Ecology and the Environment. 2011;9(10):552-560.
- Donato DC, Kauffman JB, Murdiyarso D, et al. Mangroves among the most carbon-rich forests in the tropics. Nature Geoscience. 2011;4(5):293-297.
- Alongi DM. Carbon sequestration in mangrove forests. Carbon Management. 2012;3(3):313-322.
- Giri C, Ochieng E, Tieszen LL, et al. Status and distribution of mangrove forests using earth observation. Global Ecology and Biogeography. 2011;20(1):154-159.
- Loucks C, Barber-Meyer S, Hossain MAA, Barlow A, Chowdhury RM. Sea level rise and tigers: predicted impacts. Climatic Change. 2010;98(1-2):291-298.
- Twilley RR, Chen RH, Hargis T. Carbon sinks in mangroves and their implications to the carbon budget. Water, Air, and Soil Pollution. 1992;64(1-2):265-288.
- Kristensen E, Bouillon S, Dittmar T, Marchand C. Organic carbon dynamics in mangrove ecosystems. Aquatic Botany. 2008;89(2):201-219.
- Kauffman JB, Donato DC. Protocols for the measurement, monitoring and reporting of mangrove structure. CIFOR Working Paper. 2012;86:1-40.
- Breithaupt JL, Smoak JM, Smith TJ, Sanders CJ, Hoare A. Organic carbon burial rates in mangrove sediments. Journal of Geophysical Research: Biogeosciences. 2012;117:G01003.
- Pendleton L, Donato DC, Murray BC, et al. Estimating global blue carbon emissions from conversion of coastal ecosystems. PLoS ONE. 2012;7(9):e43542.
- Chave J, Andalo C, Brown S, et al. Tree allometry and improved estimation of carbon stocks. Oecologia. 2005;145(1):87-99.
- Komiyama A, Ong JE, Poungparn S. Allometry, biomass, and productivity of mangrove forests. Aquatic Botany. 2008;89(2):128-137.
- Woodroffe CD, Rogers K, McKee KL, et al. Mangrove sedimentation and response to relative sea-level rise. Annual Review of Marine Science. 2016;8:243-266.
- Friess DA, Rogers K, Lovelock CE, et al. The state of the world's mangrove forests: past, present, and future. Annual Review of Environment and Resources. 2019;44:89-115.
- Murdiyarso D, Purbopuspito J, Kauffman JB, et al. Indonesian mangrove forests for climate mitigation. Nature Climate Change. 2015;5(12):1089-1092.
- Lovelock CE, Cahoon DR, Friess DA, et al. Vulnerability of Indo-Pacific mangrove forests to sealevel rise. Nature. 2015;526(7574):559-563.
- Atwood TB, Connolly RM, Almahasheer H, et al. Global patterns in mangrove soil carbon. Nature Climate Change. 2017;7(7):523-528.
- Sanderman J, Hengl T, Fiske GJ, et al. A global map of mangrove forest soil carbon. Environmental Research Letters. 2018;13(5):055002.
- Richards DR, Friess DA. Rates and drivers of mangrove deforestation in Southeast Asia. Proceedings of the National Academy of Sciences. 2016;113(2):344349.