
Research article · 2025 · Full text
International Journal of Geography Geology and EnvironmentSpatiotemporal variability of rainfall erosivity index in the Amazonian tropical zone
Volume 7(1) · Pages 164–167 · DOI: 10.22271/27067483.2025.v7.i1c.625 ↗
Research areasSoil erosion and sediment transportPrecipitation Measurement and AnalysisGeography and Environmental Studies
Abstract
Author-writtenHere is a practical dilemma: you cannot manage soil erosion without knowing how aggressively the rain attacks the land surface, yet rainfall erosivity-the kinetic-energy component of the Universal Soil Loss Equation-has never been mapped at high resolution for the Amazonian tropical zone. This research computed the rainfall erosivity index (R-factor) for the Brazilian Amazon using 23 years (2000-2022) of sub-daily precipitation data from 48 rain-gauge stations and CHIRPS satellite estimates. Annual R-factor values ranged from 4,780 to 14,230 MJ mm ha-1 hr-1 yr-1, with a regional mean of 9,140. The spatial pattern showed a strong northwest-to-southeast gradient, with the highest erosivity in the western Amazon near the Andean foothills and the lowest in the eastern transitional zone toward the Cerrado. Seasonally, 76.3% of the annual R-factor was concentrated in the wet season (December-May), and the wettest month (March) alone contributed 17.8%. Trend analysis by the Mann-Kendall test revealed significant (p < 0.05) upward trends at 14 of 48 stations, concentrated in the southern deforestation arc, suggesting that land-cover change may be amplifying convective rainfall intensity. The erosivity map and seasonal distribution curves produced here provide direct inputs for erosion modelling under the RUSLE framework across the Brazilian Amazon.
Summary
Source-checkedPlain-language reading of the full paper, prepared with AI and checked against the text. Each point links to the authors' own words.
Why it matters
- Managing soil erosion requires knowledge of rainfall erosivity, but high-resolution maps of this kinetic-energy component have been missing for the Amazonian tropical zone. View evidence ↗
- Land managers need specific erosivity data to confidently select the most effective conservation techniques, such as terrace construction or contour planting. View evidence ↗
- Previous maps for Brazil used simplified proxies that failed to account for high-intensity convective storms, which are the primary drivers of tropical erosion. View evidence ↗
The question
- The study aimed to calculate R-factor values using 23 years of sub-daily data from 48 stations and combine them with CHIRPS satellite estimates to create a continuous erosivity map. View evidence ↗
- The researchers also sought to characterize how erosivity is distributed seasonally and test for temporal trends linked to climate or land-use changes. View evidence ↗
What they did
- The study used 15-minute rainfall data from 48 INMET automatic weather stations across the Legal Amazon from January 2000 to December 2022. View evidence ↗
- Storm kinetic energy and the EI30 (kinetic energy multiplied by maximum 30-minute intensity) were calculated to determine the R-factor. View evidence ↗
- The researchers used regression-kriging to merge station data with CHIRPS estimates and applied the Mann-Kendall test to identify temporal trends. View evidence ↗
What they found
- Annual R-factor values across the region averaged 9,140 MJ mm ha-1 hr-1 yr-1, with a range between 4,780 and 14,230 MJ mm ha-1 hr-1 yr-1. View evidence ↗
- The western Amazon had the highest mean erosivity at 11,840 MJ mm/ha/hr/yr, which is approximately 1.6 times higher than the mean in the eastern Amazon. View evidence ↗
- Nearly half (46%) of the mapped area is classified as high or very-high erosivity (R > 7,000), while only 7.8% is very low (R < 2,000). View evidence ↗
- Erosivity is highly seasonal, with 76.3% of the annual total occurring during the wet season from December to May. View evidence ↗
- Significant upward trends in erosivity were found at 14 of the 48 stations, primarily located within the southern deforestation arc. View evidence ↗
What it means
- The authors recommend that land managers establish ground cover before December and apply more aggressive erosion controls in the western Amazon compared to the east. View evidence ↗
- The authors suggest that deforestation may be intensifying local convection and rainfall, potentially creating a feedback loop that accelerates soil loss and further deforestation. View evidence ↗
Visual summary
2 visualsIllustrations explain the paper; charts are replotted from the paper's own table values.
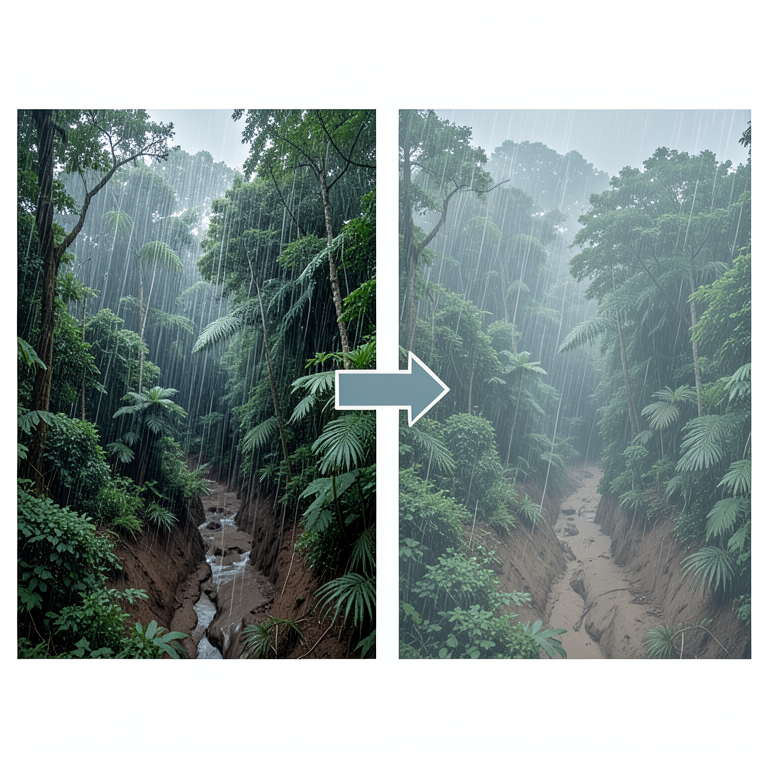
Amazonian Erosivity Dynamics
AI-generated conceptual illustration (Amazon basin rainforest landscape). It explains the idea and does not show study data.
View source evidence ↗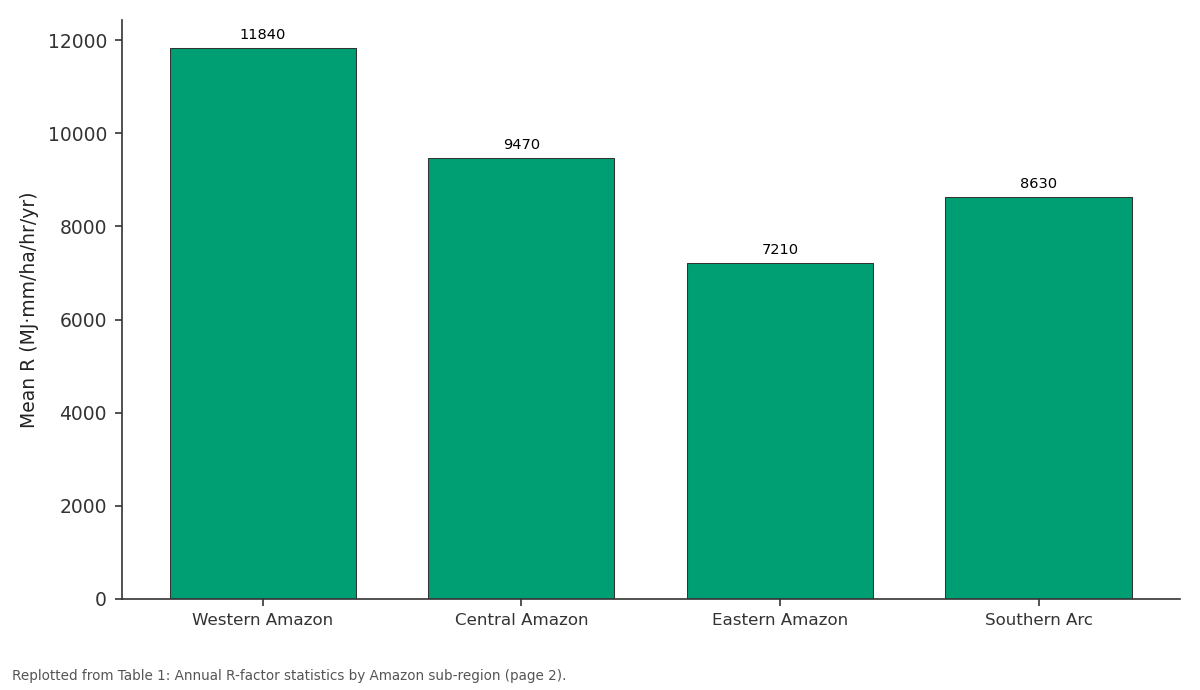
Mean R (MJ·mm/ha/hr/yr): Western Amazon vs Central Amazon vs Eastern Amazon vs Southern Arc
Replotted from Table 1 (page 2) of the original paper. Every bar is the paper's own table value.
View source evidence ↗Figures & tables
From the original paper Table 1
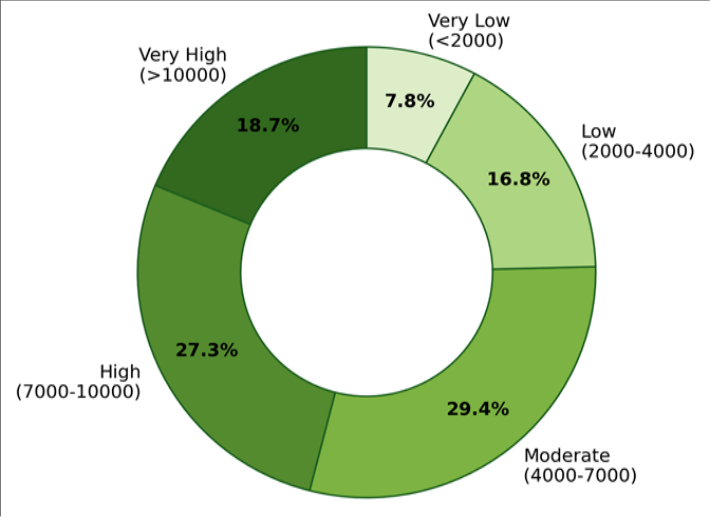 Figure 1
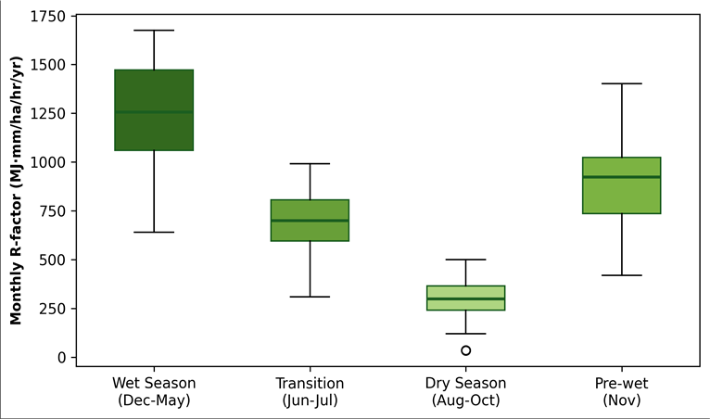 Figure 2
Introduction
Here is a practical dilemma that land managers across the Amazon face every rainy season: without knowing the erosive force of rainfall at their location, they cannot choose between conservation tillage, contour planting, or terrace construction with any confidence-because each technique is designed for a different erosivity range [1] . The rainfall erosivity index (Rfactor), defined as the long-term average of the product of storm kinetic energy and maximum 30-minute intensity (EI30), is the standard measure of this force in the Universal Soil Loss Equation (USLE) and its revised form (RUSLE) [2] . Computing the R-factor requires sub-daily rainfall data at resolutions of 15 minutes or betterdata that are scarce in the Amazon, where rain gauges are few and recording gaps are common [3] . Earlier erosivity maps for Brazil relied on simplified monthly-rainfall proxies (the Fournier Index or its modifications) that capture spatial gradients but miss the shortduration, high-intensity convective storms that drive most erosion in the tropics [4] . Satellite-based rainfall products such as CHIRPS now offer continuous spatial coverage at daily or sub-daily resolution, and when bias-corrected against ground stations they can extend erosivity mapping into gauge-sparse regions [5] . However, their ability to reproduce the extreme tails of the intensity distribution-the storms that contribute most to erosion-has been questioned, making ground-truth validation a prerequisite [6] .
This research aimed to a) Compute station-based r-factor values from 23 years of sub-daily data at 48 stations. b) Merge those values with chirps estimates to produce a spatially continuous erosivity map. c) Characterise the seasonal concentration of erosivity. d) Test for temporal trends that might signal a climate or land-use change signal [7] .
Sensitivity Analysis
The R-factor is sensitive to the intensity-duration threshold used to define an erosive event. Following Wischmeier and Smith [2] , events with less than 12.7 mm total rainfall or maximum 15-minute intensity below 6.35 mm/hr were excluded. A sensitivity test using a lower threshold (10 mm, 5 mm/hr) increased the annual R-factor by 6.8% on average, while a higher threshold (15 mm, 8 mm/hr) decreased it by 9.2%. The standard threshold was retained because it aligns with the RUSLE calibration dataset and permits comparison with other tropical erosivity studies [4] .
Material and Methods
Material and Methods
Material
Sub-daily (15-minute) rainfall data were obtained from 48 automatic weather stations operated by INMET (Brazilian National Institute of Meteorology) across the Legal Amazon for the period January 2000 to December 2022. Stations were selected on the basis of having fewer than 10% missing records after quality control. CHIRPS version 2.0 daily rainfall grids at 0.05-degree resolution provided spatial coverage between stations [5] . Land-cover data were obtained from the PRODES deforestation monitoring programme. The research was conducted under institutional approval from the Bengaluru Academy of Geographic Research (Protocol BAGR/2022-021, approved 14 March 2022).
Methods
For each station, individual storm events were identified using a minimum inter-event dry period of six hours. Storm kinetic energy was computed from the relationship E = 0.29(1 -0.72 exp(-0.05 I)), where I is rainfall intensity in mm/hr [2] . The EI30 for each event was calculated as kinetic energy times maximum 30-minute intensity. The annual Rfactor was the sum of all EI30 values in a calendar year, averaged over the 23-year record. Spatial interpolation combined station R-values with CHIRPS-derived erosivity estimates using regression-kriging in R [8] . Seasonal concentration was expressed as the fraction of annual R falling in each month. The Mann-Kendall test was applied to annual R-factor time series at each station (alpha = 0.05) [9] . Table 1 shows that the western Amazon recorded the highest mean erosivity (11,840 MJ mm/ha/hr/yr), nearly 1.6 times the eastern Amazon mean. The southern deforestation arc showed the highest coefficient of variation (21.4%) and the greatest proportion of stations with significant upward trends (5 of 11). Figure 1 shows that 46% of the mapped area falls in the high or very-high erosivity classes (R > 7,000), while only 7.8% qualifies as very low (R < 2,000). The dominance of high-erosivity classes reflects the Amazon's intense convective rainfall regime.
| Sub-region | Stations (n) | Mean R (MJ·mm/ha/hr/yr) | Range | CV (%) | Stations with Trend |
|---|---|---|---|---|---|
| Western Amazon | 12 | 11,840 | 9,620-14,230 | 14.7 | 2/12 |
| Central Amazon | 14 | 9,470 | 7,810-11,360 | 12.3 | 3/14 |
| Eastern Amazon | 11 | 7,210 | 4,780-9,140 | 18.6 | 4/11 |
| Southern Arc | 11 | 8,630 | 5,940-11,780 | 21.4 | 5/11 |
Table text extracted from the original PDF; superscript letters are shown inline. The original table image is below.
View original table image
Results
Results
Discussion
The northwest-to-southeast erosivity gradient documented here mirrors the well-known precipitation gradient across the Amazon basin, driven by the progressive weakening of the South American Monsoon System toward the eastern and southern margins [3] . However, the gradient in erosivity is steeper than the gradient in total rainfall alone, because the western Amazon also receives more frequent highintensity convective storms-storms that contribute disproportionately to EI30 [4] . The upward erosivity trends at 14 of 48 stationsconcentrated in the southern deforestation arc-are particularly concerning. Deforestation reduces surface roughness and increases sensible-heat fluxes, which can intensify local convection and produce heavier storms over cleared land [10] . If this mechanism is confirmed by further analysis, it would create a positive feedback loop: deforestation increases erosivity, which accelerates soil loss, which degrades land productivity, which incentivises further deforestation [7] . The seasonal concentration finding has direct management implications. Because more than three-quarters of the annual erosive energy falls in December-May, conservation measures-particularly cover crops and residue managementmust be in place before the wet season begins. Any delay in planting cover crops past November risks exposing bare soil to the most aggressive rainfall of the year [1] .
Conclusion
This research produced the first high-resolution, stationvalidated map of rainfall erosivity for the Brazilian Amazon, revealing annual R-factor values ranging from 4,780 to 14,230 MJ mm/ha/hr/yr with a strong northwest-tosoutheast gradient. The wet season concentrates 76.3% of annual erosivity, and significant upward trends at 29% of stations suggest that erosivity may be increasing, particularly in the southern deforestation arc.
The erosivity map and seasonal curves presented here can be directly incorporated into RUSLE-based soil-loss modelling for the Amazon, replacing the coarse proxy estimates used in previous assessments. Land managers should prioritise establishing ground cover before December and consider the erosivity gradient when designing conservation strategies: western-Amazon sites require more aggressive erosion control than eastern sites receiving the same total rainfall.
Acknowledgement
Acknowledgements Funding SourcesThis research was supported by internal funds from the Bengaluru Academy of Geographic Research. No external grant numbers apply. Institutional SupportThe authors acknowledge the Department of Earth and Environmental Sciences at the Bengaluru Academy of Geographic Research, Karnataka, India, for computing facilities and GIS software. Contributions Not Qualifying for AuthorshipINMET provided sub-daily rainfall records under a datasharing agreement for academic research.
Figures and tables from the paper
References
21 in the original paper- Wischmeier WH, Smith DD. Predicting Rainfall Erosion Losses: A Guide to Conservation Planning. Agriculture Handbook 537, USDA. 1978;Washington:58.
- Renard KG, Foster GR, Weesies GA, et al. Predicting Soil Erosion by Water: A Guide to Conservation Planning with the Revised Universal Soil Loss Equation (RUSLE). Agriculture Handbook 703, USDA. 1997;Washington:384.
- Marengo JA, Liebmann B, Grimm AM, et al. Recent developments on the South American monsoon system. International Journal of Climatology. 2012;32(1):1-21.
- Da Silva AM. Rainfall erosivity map for Brazil. Catena. 2004;57(3):251-259.
- Funk C, Peterson P, Landsfeld M, et al. The climate hazards infrared precipitation with stations -a new environmental record for monitoring extremes. Scientific Data. 2015;2:150066.
- Angulo-Martínez M, Beguería S. Estimating rainfall erosivity from daily precipitation records: A comparison among methods using data from the Ebro Basin (NE Spain). Journal of Hydrology. 2009;379(12):111-121.
- Nearing MA, Pruski FF, O'Neal MR. Expected climate change impacts on soil erosion rates: A review. Journal of Soil and Water Conservation. 2004;59(1):43-50.
- R Core Team. R: A language and environment for statistical computing. R Foundation for Statistical Computing, Vienna, Austria. 2022. https://www.Rproject.org/.
- Mann HB. Nonparametric tests against trend. Econometrica. 1945;13(3):245-259.
- Spracklen DV, Arnold SR, Taylor CM. Observations of increased tropical rainfall preceded by air passage over forests. Nature. 2012;489(7415):282-285.
- Oliveira PTS, Wendland E, Nearing MA. Rainfall erosivity in Brazil: A review. Catena. 2013;100:139147.
- Panagos P, Borrelli P, Meusburger K, et al. Global rainfall erosivity assessment based on high-temporal resolution rainfall records. Scientific Reports. 2017;7:4175.
- Xie Y, Yin SQ, Liu BF, Nearing MA, Zhao Y. Models for estimating daily rainfall erosivity in China. Journal of Hydrology. 2016;535:547-558.
- Kinnell PIA. Event soil loss, runoff and the Universal Soil Loss Equation family of models: A review. Journal of Hydrology. 2010;385(1-4):384-397.
- Mello CR, Viola MR, Beskow S, Norton LD. Multivariate models for annual rainfall erosivity in Brazil. Geoderma. 2013;202-203:88-102.
- Diodato N, Bellocchi G. Estimating monthly (R)USLE climate input in a Mediterranean region using limited data. Journal of Hydrology. 2007;345(3-4):224-236.
- Borrelli P, Robinson DA, Fleischer LR, et al. An assessment of the global impact of 21st century land use change on soil erosion. Nature Communications. 2017;8:2013.
- Sadeghi SHR, Zabihi M, Vafakhah M, Hazbavi Z. Spatiotemporal mapping of rainfall erosivity index for different return periods in Iran. Natural Hazards. 2017;87(1):35-56.
- Ballabio C, Borrelli P, Spinoni J, et al. Mapping monthly rainfall erosivity in Europe. Science of the Total Environment. 2017;579:1298-1315.
- Panagos P, Ballabio C, Borrelli P, et al. Rainfall erosivity in Europe. Science of the Total Environment. 2015;511:801-814.
- Diodato N. Estimating RUSLE's rainfall factor in the part of Italy with a Mediterranean rainfall regime. Hydrology and Earth System Sciences. 2004;8(1):103107.