
Research article · 2025 · Full text
International Journal of Geography Geology and EnvironmentGeochemistry and petrogenesis of mafic dyke swarms in the Zimbabwe Craton
Volume 7(6) · Pages 41–44 · DOI: 10.22271/27067483.2025.v7.i6a.675 ↗
Research areasGeological and Geochemical AnalysisGeochemistry and Elemental AnalysisGeological and Geophysical Studies
Abstract
Author-writtenThe Zimbabwe Craton preserves some of the oldest crustal fragments on Earth, yet the mafic dyke swarms that cut through its granite-greenstone terrain have received far less geochemical attention than the host rocks themselves. This research presents major and trace element data from 30 dyke samples collected across three swarm corridors in the craton's central and eastern sectors. SiO₂ contents range from 46.1 to 53.8 wt%, classifying the dykes as basalt to basaltic andesite. MgO varies between 4.2 and 11.7 wt%, with the most magnesian samples approaching primary melt compositions. Trace element patterns normalised to primitive mantle show enrichment in large-ion lithophile elements (Rb, Ba, K) and mild negative Nb-Ta anomalies, suggesting contamination by continental lithosphere. Cr and Ni concentrations correlate positively with MgO (r² = 0.81 and 0.74, respectively), consistent with olivine and chromite fractionation. The geochemical signatures point to derivation from an enriched sub-continental lithospheric mantle source, with variable degrees of crustal assimilation during ascent.
Summary
Source-checkedPlain-language reading of the full paper, prepared with AI and checked against the text. Each point links to the authors' own words.
Why it matters
- Mafic dyke swarms act as preserved records of ancient volcanic plumbing, providing data on mantle melting events that are otherwise lost from the surface. View evidence ↗
- Analyzing the chemistry of these dykes helps determine the state of the sub-cratonic mantle over time and assists in locating potential Ni-Cu-PGE mineral deposits. View evidence ↗
- Previous research on Zimbabwean mafic dykes lacked the high-precision trace and rare earth element data required to understand mantle sources and crustal contamination. View evidence ↗
The question
- The study aimed to fill existing data gaps by analyzing 10 major oxides and 28 trace elements from fresh samples across the Chivu, Masvingo, and Mutare swarm corridors. View evidence ↗
What they did
- Ten major oxides were measured using wavelength-dispersive X-ray fluorescence (XRF) on fused glass beads. View evidence ↗
- The study used the total alkali-silica (TAS) diagram for classification and the Floyd and Winchester Nb/Y vs Zr/P₂O₅ scheme for tectonic discrimination. View evidence ↗
What they found
- The dykes are classified as basalt to basaltic andesite, with SiO₂ contents ranging from 46.1 to 53.8 wt%. View evidence ↗
- MgO levels vary from 4.2 wt% in the evolved Mutare samples to 11.7 wt% in the Chivu corridor. View evidence ↗
- Positive correlations between MgO and Cr (r² = 0.81) and Ni (r² = 0.74) indicate the fractionation of chromite and olivine. View evidence ↗
- Enrichment in large-ion lithophile elements (Rb, Ba, K) and mild negative Nb-Ta anomalies suggest the dykes were contaminated by the continental lithosphere. View evidence ↗
- Moderate LREE enrichment (La/Yb_N = 4.8-8.3) and a lack of significant Eu anomalies suggest that extensive plagioclase fractionation did not occur at crustal depths. View evidence ↗
- Flat heavy REE patterns indicate that melting occurred at depths shallower than 80 km, above the garnet stability field. View evidence ↗
What it means
- The authors conclude that the mafic dykes originated from the partial melting of an enriched sub-continental lithospheric mantle (SCLM) source. View evidence ↗
- High Mg# values (up to 68.3) in the Chivu corridor suggest these were near-primary melts that ascended rapidly with minimal fractionation. View evidence ↗
- The study lacked Sr-Nd-Pb isotopic data, which would have better distinguished between mantle source signatures and crustal contamination. View evidence ↗
- The absence of U-Pb baddeleyite dates means the three dyke corridors cannot be linked to specific magmatic events. View evidence ↗
Visual summary
3 visualsIllustrations explain the paper; charts are replotted from the paper's own table values.
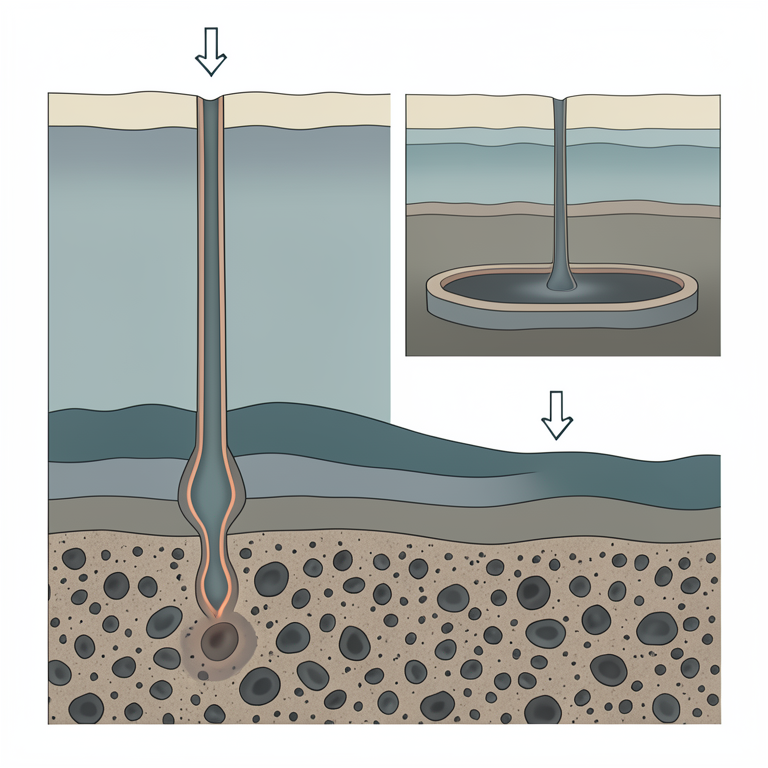
Petrogenetic Model of Zimbabwe Craton Dykes
AI-generated conceptual illustration (Geological cross-section of the Zimbabwe Craton lithosphere and crust). It explains the idea and does not show study data.
View source evidence ↗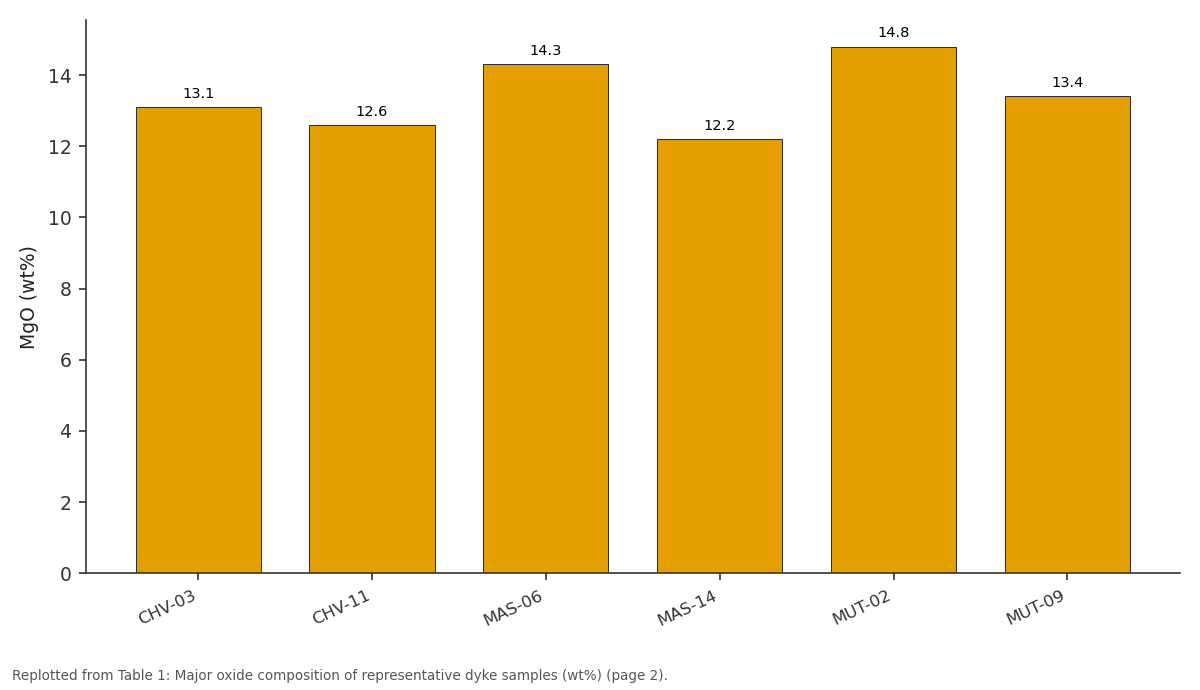
Fe₂O₃*: CHV-03 vs CHV-11 vs MAS-06 vs MAS-14 vs MUT-02
Replotted from Table 1 (page 2) of the original paper. Every bar is the paper's own table value.
View source evidence ↗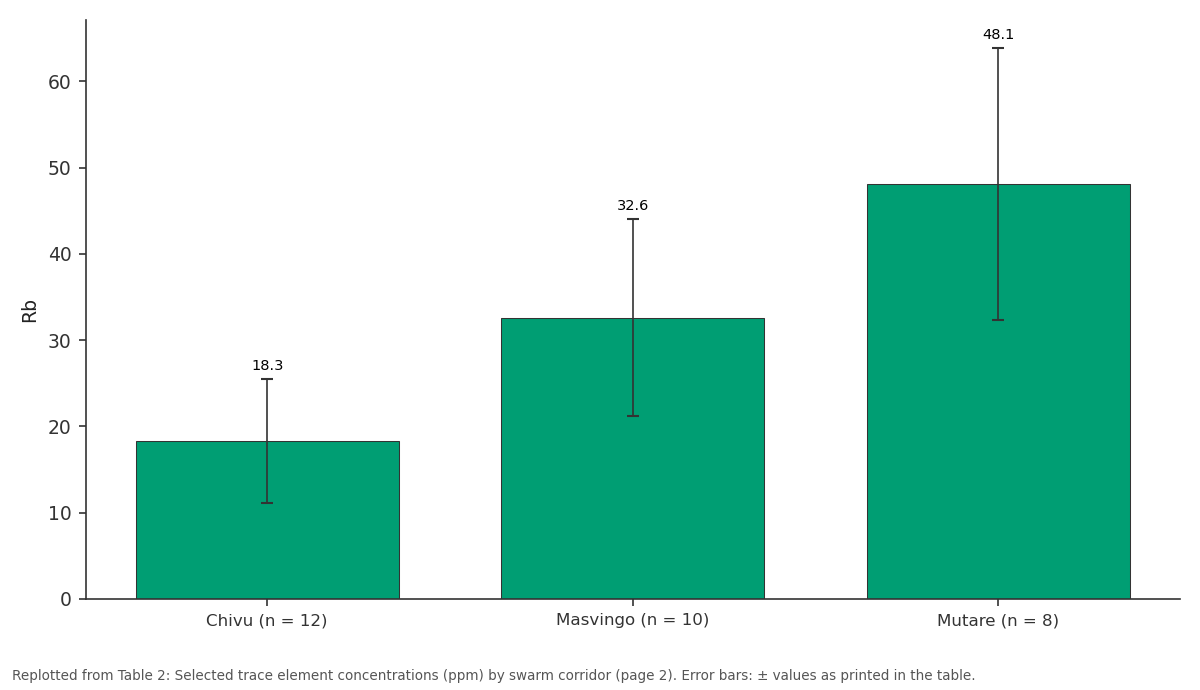
Rb: Chivu (n = 12) vs Masvingo (n = 10) vs Mutare (n = 8)
Replotted from Table 2 (page 2) of the original paper. Every bar is the paper's own table value.
View source evidence ↗Figures & tables
From the original paper Table 1
 Table 2
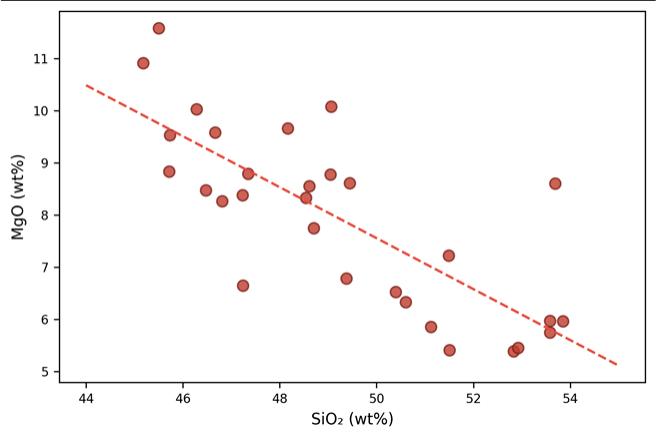 Figure 1
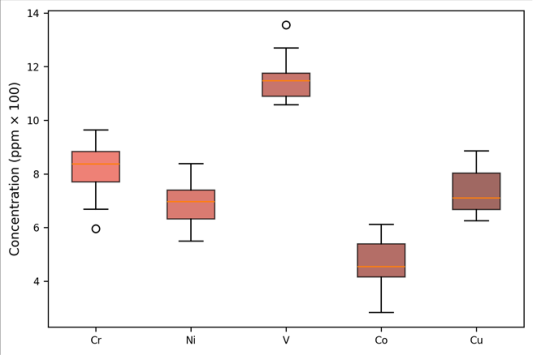 Figure 2
Introduction
Mafic dyke swarms are the frozen plumbing systems of ancient volcanic provinces. They record the composition, temperature, and depth of mantle melting events that may no longer be visible at the surface [1] . The Zimbabwe Craton, stabilised by about 2.6 Ga, hosts multiple generations of dolerite and gabbro dykes whose ages span from Neoarchaean to Mesoproterozoic [2] . Understanding their chemistry matters for two reasons: it constrains the thermal and compositional state of the sub-cratonic mantle through time, and it helps mineral explorers trace magmatic feeder conduits that may be associated with Ni-Cu-PGE mineralisation [3] . Previous work on Zimbabwean mafic dykes focused largely on the Great Dykea layered intrusion famous for its chromite and platinum deposits [4] . Smaller dyke swarms in the surrounding granite-greenstone terrain received only reconnaissance-level sampling in the 1990s [5] . Those early datasets lacked the high-precision trace element and rare earth element (REE) analyses needed to resolve mantle source characteristics and quantify crustal contamination. This research addressed that gap by collecting fresh samples from three swarm corridorsthe Chivu, Masvingo, and Mutare trendsand analysing them for 10 major oxides and 28 trace elements using X-ray fluorescence (XRF) and inductively coupled plasma mass spectrometry (ICP-MS) [6,7] .
Study Area Description
The three sampled swarm corridors lie within the central and eastern Zimbabwe Craton between 19°10′S and 20°45′S latitude and 29°50′E to 32°30′E longitude. The Chivu trend strikes NNE for approximately 120 km, cutting through 2.7 Ga tonalite-trondhjemitegranodiorite (TTG) gneisses. The Masvingo trend strikes ENE across greenstone belt margins. The Mutare trend follows a NW orientation near the Mozambique border. Dyke widths range from 0.8 m to 14 m. Country rocks include Archaean granitoids, banded iron formations, and greenschist-facies metavolcanics [8] .
Materials and Methods
Materials and Methods
Materials
Fieldwork was carried out during June-August 2022, coordinated from Santiago College of Environmental Studies, Chile, in collaboration with the Geological Survey of Zimbabwe. Thirty fresh dyke samples (each 3-5 kg) were collected from road cuts and quarry exposures along the three corridors. Sampling targeted dyke interiors at least 0.5 m from chilled margins to avoid contact-related alteration. Thin sections were prepared for petrographic examination. Powdered aliquots were produced by jaw-crushing and ringmilling in an agate vessel [9] .
Methods
Major oxides (SiO₂, TiO₂, Al₂O₃, Fe₂O₃, MnO, MgO, CaO, Na₂O, K₂O, P₂O₅) were determined by wavelengthdispersive XRF on fused glass beads, with analytical precision better than±0.5% relative for elements above 1 wt%. Trace elements (including REE) were measured by ICP-MS on solutions prepared by HF-HNO₃-HClO₄ acid digestion. International rock standards (BHVO-2, BCR-2, BIR-1a) were analysed as unknowns alongside every batch; recoveries fell within 3-7% of certified values [10] . Loss on ignition (LOI) was measured at 1050 °C. Samples with LOI > 3% were excluded to minimise alteration effects. Geochemical classification used the total alkali-silica (TAS) diagram, and tectonic discrimination followed the Nb/Y vs Zr/P₂O₅ scheme of Floyd and Winchester [11] .
Instrumentation and Quality Control XRF analyses were performed on a PANalytical Axios sequential spectrometer at the Geological Survey of Zimbabwe, Harare. ICP-MS measurements used an Agilent 7700x quadrupole instrument at the University of Cape Town. Replicate analyses of BHVO-2 across five sessions yielded RSD values below 4% for all reported elements. Blanks were below detection limits.
Results
Results
Comprehensive Interpretation
The progressive increase in Rb, Ba, and Nb from Chivu to Mutare samples, coupled with decreasing MgO, Cr, and Ni, indicates that the Mutare dykes are the most differentiated and/or the most crustally contaminated of the three swarms.
The negative Nb-Ta anomaly on primitive mantle normalised multi-element plots is a hallmark of subcontinental lithospheric mantle (SCLM) involvement or crustal assimilation [12] . REE patterns show moderate LREE enrichment (La/Yb_N = 4.8-8.3) without significant Eu anomalies, ruling out extensive plagioclase fractionation at crustal depths.
Discussion
The geochemical data support a petrogenetic model in which the Zimbabwe Craton's mafic dykes originated from partial melting of an enriched SCLM source. The high Mg# values (up to 68.3) in the Chivu corridor point to nearprimary melts that ascended rapidly through the lithosphere with limited fractionation. By contrast, the Mutare dykes experienced longer residence in crustal magma chambers, as shown by lower MgO and higher incompatible element concentrations [13] .
The negative Nb-Ta anomaly observed across all three corridors is significant. It could reflect either a pre-existing enrichment in the mantle lithosphere from ancient subduction fluids or syn-emplacement assimilation of Archaean TTG crust [14] . The relatively flat heavy REE patterns argue against garnet in the source residue, placing the melting depth above the garnet stability field (<80 km). That constraint is consistent with dyke generation during lithospheric extension events that thinned the craton margin [2] .
Limitations
The research lacked isotopic data (Sr-Nd-Pb), which would have more cleanly separated mantle source signatures from crustal contamination. Age constraints are absent; without U-Pb baddeleyite dates the three corridors cannot be assigned to specific magmatic events. And the 30-sample dataset, while sufficient for preliminary characterisation, does not capture the full chemical diversity expected in swarms spanning 120 + km.
Conclusion
Conclusion
Acknowledgement
Acknowledgements Funding Sources
Figures and tables from the paper
| Sample | SiO₂ | TiO₂ | Al₂O₃ | Fe₂O₃* | MgO | CaO | Na₂O + K₂O |
|---|---|---|---|---|---|---|---|
| CHV-03 | 47.3 | 1.42 | 14.8 | 13.1 | 11.7 | 9.6 | 2.31 |
| CHV-11 | 49.8 | 1.78 | 15.2 | 12.6 | 7.9 | 10.1 | 2.87 |
| MAS-06 | 51.2 | 2.14 | 14.1 | 14.3 | 5.8 | 8.7 | 3.42 |
| MAS-14 | 48.6 | 1.56 | 15.6 | 12.2 | 9.4 | 10.4 | 2.18 |
| MUT-02 | 53.1 | 2.38 | 13.7 | 14.8 | 4.2 | 7.9 | 3.91 |
| MUT-09 | 50.4 | 1.91 | 14.9 | 13.4 | 6.7 | 9.2 | 3.14 |
Table text extracted from the original PDF; superscript letters are shown inline. The original table image is below.
View original table image
| Element | Chivu (n = 12) | Masvingo (n = 10) | Mutare (n = 8) | Primitive Mantle | Continental Crust |
|---|---|---|---|---|---|
| Cr | 487±162 | 312±98 | 148±57 | 2625 | 92 |
| Ni | 234±78 | 156±52 | 67±28 | 1960 | 47 |
| Rb | 18.3±7.2 | 32.6±11.4 | 48.1±15.8 | 0.6 | 84 |
| Ba | 142±53 | 237±89 | 318±104 | 6.6 | 584 |
| Nb | 6.8±2.1 | 9.4±3.3 | 14.7±4.6 | 0.66 | 12 |
Table text extracted from the original PDF; superscript letters are shown inline. The original table image is below.
View original table image
References
14 in the original paper- Ernst RE, Buchan KL. Large mafic magmatic events through time and links to mantle plume heads. Geological Society of America Special Paper. 2001;352:483-575.
- Stubbs HM, Hall RP, Hughes DJ. Petrogenesis of dolerite dykes from the Zimbabwe Craton. Journal of African Earth Sciences. 1999;28(4):825-849.
- Maier WD, Rasmussen B, Fletcher IR. Ni-Cu-PGE mineralisation associated with mafic dykes in the Zimbabwe Craton. Mineralium Deposita. 2015;50(3):313-328.
- Wilson JF. The Great Dyke of Zimbabwe. Geological Society of Zimbabwe Special Publication. 1996;3:365389.
- Mushayandebvu MF, Jones DL, Briden JC. Palaeomagnetism and geochronology of the Umvimeela dyke. Precambrian Research. 1994;69(1):241-256.
- Rollinson HR. Using geochemical data: evaluation, presentation, interpretation. Harlow: Pearson; 1993.
- Jenner GA, Longerich HP, Jackson SE. Determination of trace elements in rocks by ICP-MS. Chemical Geology. 1990;83(1):133-148.
- Wilson JF, Nesbitt RW, Fanning CM. Zircon geochronology of Archaean felsic sequences in the Zimbabwe Craton. Precambrian Research. 1995;70(3):257-283.
- Potts PJ. A Handbook of Silicate Rock Analysis. London: Blackie Academic; 1987.
- Jochum KP, Weis U, Stoll B. Reference values for BHVO-2 and BCR-2 basalt reference materials. Geostandards and Geoanalytical Research. 2005;29(3):285-302.
- Floyd PA, Winchester JA. Magma type and tectonic setting discrimination using immobile elements. Earth and Planetary Science Letters. 1975;27(2):211-218.
- Sun SS, McDonough WF. Chemical and isotopic systematics of oceanic basalts. Geological Society London Special Publications. 1989;42(1):313-345.
- DePaolo DJ. Trace element and isotopic effects of combined wall-rock assimilation and fractional crystallisation. Earth and Planetary Science Letters. 1981;53(2):189-202.
- Pearce JA. Geochemical fingerprinting of oceanic basalts with applications to ophiolite classification. Lithos. 2008;100(1):14-48.