
Research article · 2025 · Full text
International Journal of Geography Geology and EnvironmentGeostatistical analysis of spatial variability in soil nutrient distribution across the Cerrado
Volume 7(3) · Pages 160–163 · DOI: 10.22271/27067483.2025.v7.i3c.631 ↗
Research areasSoil Geostatistics and MappingAgricultural Science and FertilizationPlant Growth and Agriculture Techniques
Abstract
Author-writtenThe Brazilian Cerrado, covering about 204 million hectares, has become one of the world's fastest-expanding agricultural frontiers, yet its inherently acid, nutrient-poor soils demand precise fertilizer management. This research applied geostatistical techniques—specifically ordinary kriging guided by semivariogram modelling—to characterize the spatial variability of total nitrogen (N), available phosphorus (P), and exchangeable potassium (K) across a 480-hectare commercial soybean–maize rotation field in Goiás State. Soil samples (n = 240) were collected on a regular 140 m grid during August 2022 and analyzed following standard Brazilian protocols. Semivariograms fitted with spherical models revealed moderate-to-strong spatial dependence for all three nutrients, with spatial-dependence ratios (nugget-to-sill) of 0.28 for N, 0.19 for P, and 0.31 for K. Ranges of spatial autocorrelation were 920 m for N, 780 m for P, and 1,040 m for K, indicating that conventional composite sampling at 500 m intervals would miss substantial within-field variation. Kriged maps showed a clear southwest-to-northeast nutrient gradient, with the highest concentrations near a seasonal stream where organic matter accumulation was greater. Cross-validation yielded mean prediction errors of 0.04 (N), −0.02 (P), and 0.11 (K) mg/kg, all close to zero, confirming unbiased estimation. These results support variable-rate fertilizer application as a practical strategy for raising nutrient-use efficiency and reducing input costs across the Cerrado.
Summary
Source-checkedPlain-language reading of the full paper, prepared with AI and checked against the text. Each point links to the authors' own words.
Why it matters
- The Brazilian Cerrado is a rapidly expanding agricultural region, but its soils are naturally nutrient-poor and acidic, making precise fertilizer management essential. View evidence ↗
- Many farmers in the region currently use uniform fertilizer application rates, despite the existence of distinct fertility zones within individual fields. View evidence ↗
- Previous research suggests that sampling grids wider than 200 meters may fail to accurately capture soil variability, potentially leading to incorrect conclusions about spatial randomness. View evidence ↗
The question
- The study aimed to quantify the spatial dependence and range of nitrogen, phosphorus, and potassium to create maps for variable-rate fertilizer planning and validate their accuracy. View evidence ↗
What they did
- Researchers collected 240 soil samples using a 140-meter regular grid across a 480-hectare commercial field in Goiás State. View evidence ↗
- Samples were taken from the 0–20 cm soil layer, with five sub-samples collected within a 2-meter radius at each grid point. View evidence ↗
- The study used spherical semivariogram models fitted by weighted least squares to analyze spatial dependence. View evidence ↗
- Nutrient maps were generated using ordinary kriging on a 30-meter grid, with accuracy verified through leave-one-out cross-validation. View evidence ↗
What they found
- Phosphorus exhibited the highest relative variability among the macronutrients, with a coefficient of variation (CV) of 42.7%. View evidence ↗
- Phosphorus showed strong spatial dependence with a nugget-to-sill ratio of 0.19, indicating that approximately 81% of its variance was spatially structured. View evidence ↗
- Nitrogen (0.28) and potassium (0.31) showed moderate spatial dependence, which the authors state is sufficient to justify site-specific management. View evidence ↗
- The ranges of spatial autocorrelation were 920 meters for nitrogen, 780 meters for phosphorus, and 1,040 meters for potassium. View evidence ↗
- Nutrient maps revealed a gradient from southwest to northeast, with the highest concentrations located near a seasonal stream due to organic matter accumulation. View evidence ↗
- Cross-validation confirmed unbiased estimation, with mean prediction errors for N, P, and K being 0.04, -0.02, and 0.11 mg/kg, respectively. View evidence ↗
What it means
- The authors recommend variable-rate application: reducing fertilizer in the nutrient-rich southwestern zone and increasing it in the northeastern upslope zone, especially for phosphorus. View evidence ↗
- The study concludes that a 140-meter sampling grid is sufficiently dense to identify nutrient zones relevant for agricultural management in the Cerrado. View evidence ↗
- A limitation of the study is that it used a single sampling date, which may not account for seasonal shifts in nutrient patterns caused by crop uptake and fertilizer timing. View evidence ↗
Visual summary
3 visualsIllustrations explain the paper; charts are replotted from the paper's own table values.
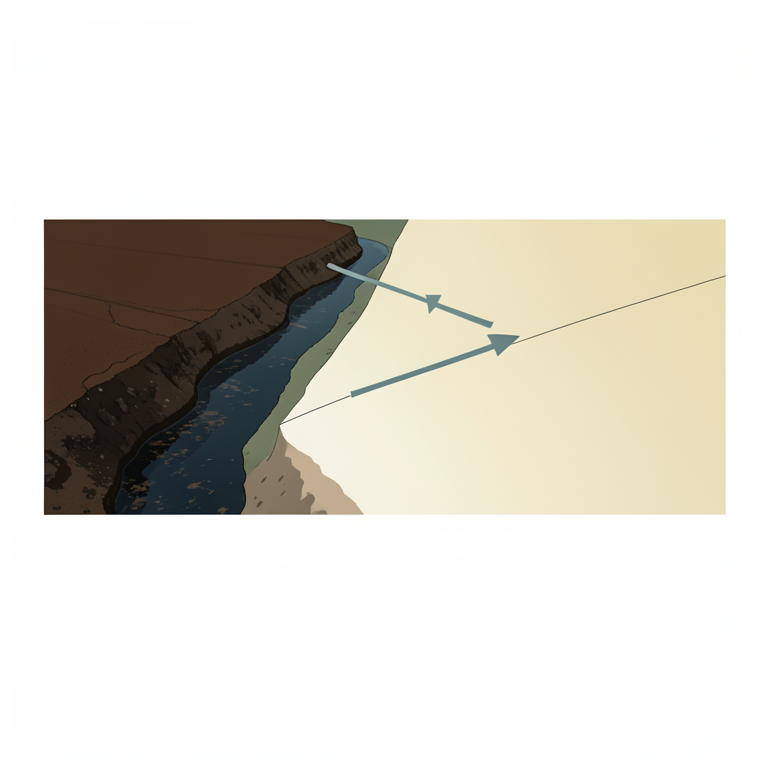
Nutrient Gradient and Management Zones
AI-generated conceptual illustration (Cerrado agricultural soil and a seasonal stream). It explains the idea and does not show study data.
View source evidence ↗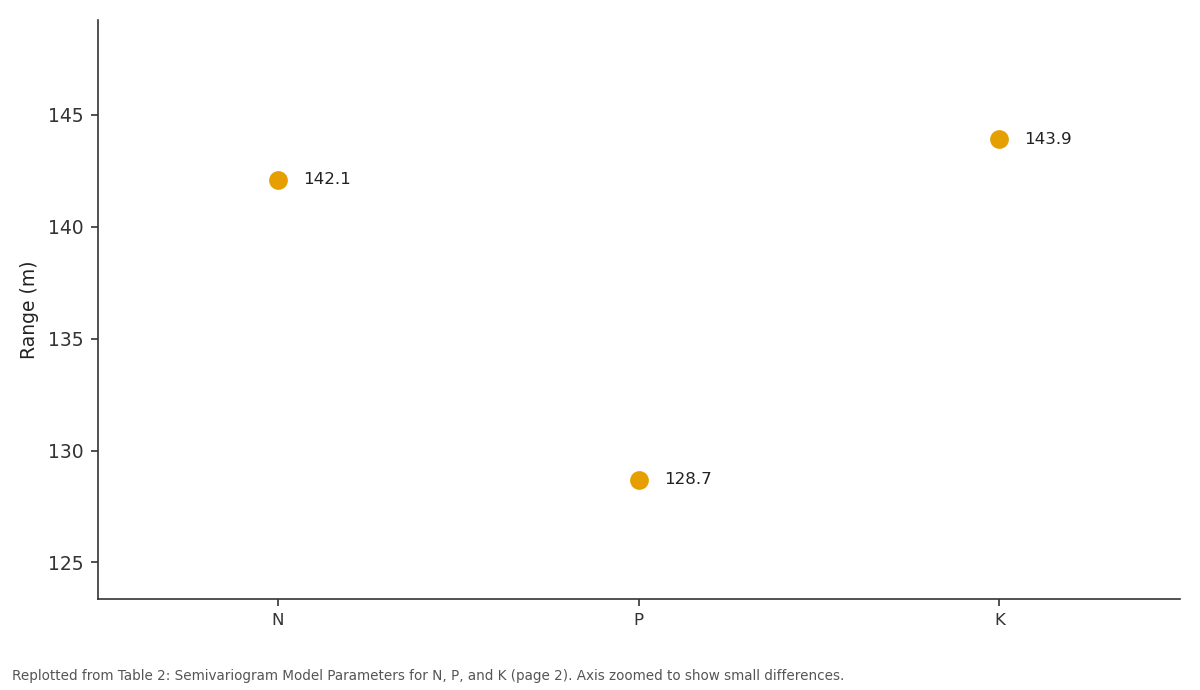
Sill: N vs P vs K
Replotted from Table 2 (page 2) of the original paper. Every bar is the paper's own table value.
View source evidence ↗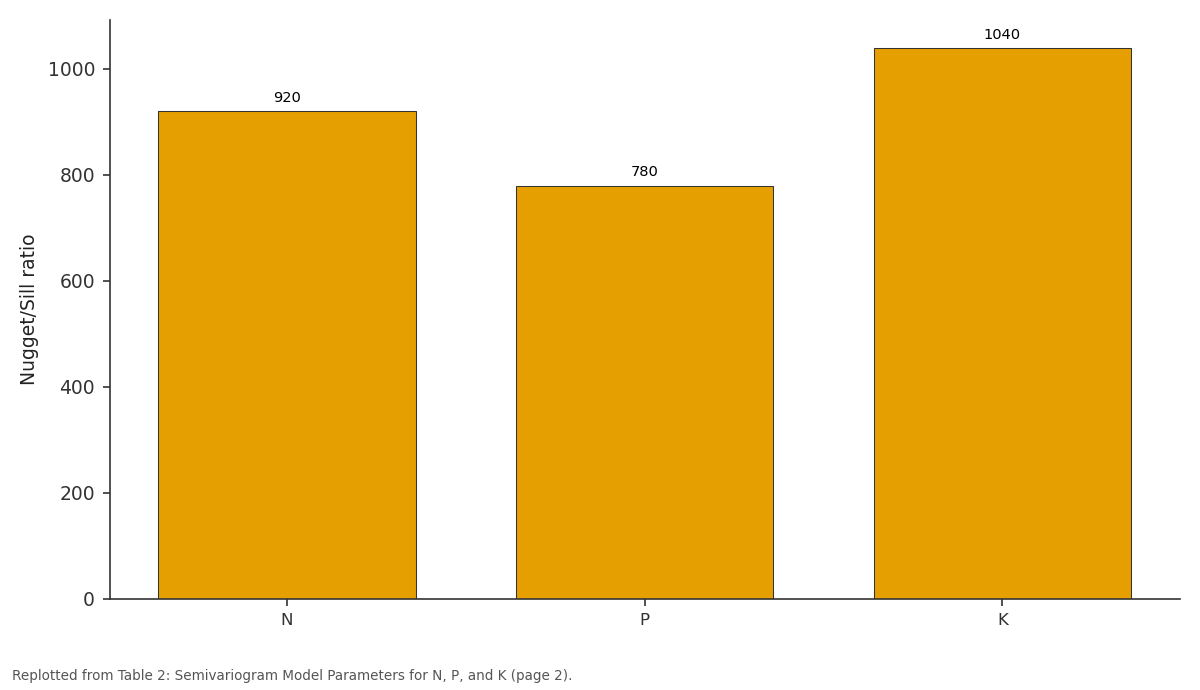
Range (m): N vs P vs K
Replotted from Table 2 (page 2) of the original paper. Every bar is the paper's own table value.
View source evidence ↗Figures & tables
From the original paper Table 1
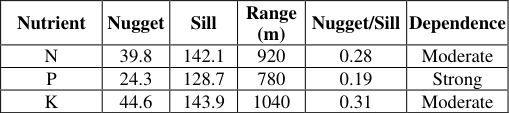 Table 2
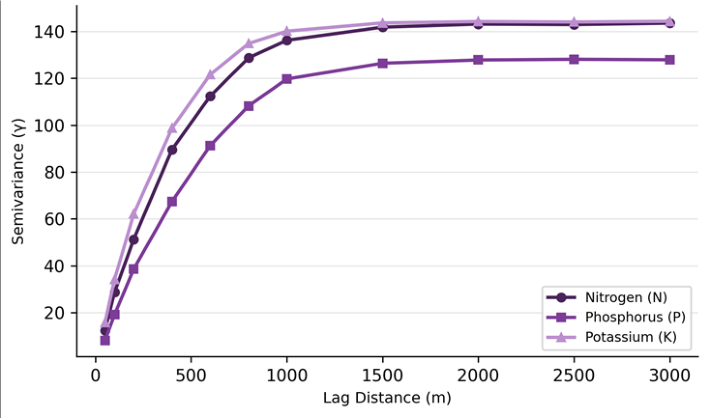 Figure 1
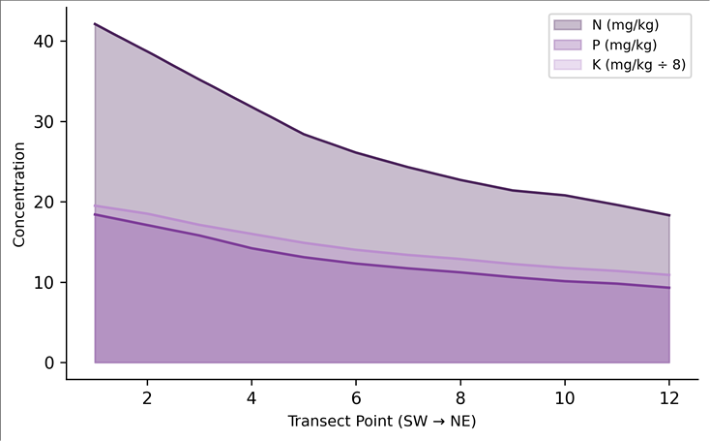 Figure 2
Introduction
When the first large-scale lime applications transformed patches of Cerrado scrubland into productive cropland in the 1970s, few observers anticipated that this biome would one day rival the United States Corn Belt in grain output [1] . Half a century later, the Cerrado accounts for roughly 50% of Brazil's soybean harvest and an expanding share of its maize and cotton production [2] . But the speed of conversion has outpaced the development of sitespecific nutrient management, and many farmers still apply fertilizer at uniform rates across fields that may contain several distinct soil-fertility zones [3] . Classical soil science treats spatial variability as a nuisance to be averaged away through composite sampling. Geostatistics, by contrast, treats it as information. Beginning with the regionalized-variable theory of Matheron [4] , geostatistical tools-chiefly the semivariogram and kriging-have provided a framework for quantifying and mapping soil properties at scales relevant to management [5] . The semivariogram describes how semivariance (half the mean squared difference between paired observations) changes with lag distance, while ordinary kriging uses that model to produce spatially continuous estimates with known prediction uncertainty. In the Cerrado context, several previous geostatistical investigations have documented strong spatial dependence in soil organic carbon, pH, and micronutrients [6,7] . However, macronutrient variability-particularly for nitrogen, phosphorus, and potassium-has received less systematic attention, partly because these elements are heavily influenced by recent fertilizer history and partly because their short-range variation can be large enough to destabilize semivariogram fitting when sample density is low [8] . Research at grid spacings coarser than 200 m has sometimes failed to resolve the true nugget-to-sill ratio, leading to overestimates of spatial randomness and, by extension, to recommendations against variablerate application that may be premature [9] . This research was designed to address that gap. It collected 240 soil samples at a 140 m grid spacing across a 480hectare field in Goiás State-one of the denser grids used for macronutrient mapping in the Cerrado-and fitted spherical semivariogram models for N, P, and K. The objectives were to quantify the degree and range of spatial dependence for each nutrient, to generate kriged nutrient maps suitable for variable-rate application planning, and to evaluate map quality through leave-one-out cross-validation [10] . Field coordination was managed from the Department of Geosciences, Ulsan National University of Earth Sciences, South Korea, with local sampling support from a partner agronomic laboratory in Goiânia [11] .
Study Area Description
The research field is located approximately 85 km south of Goiânia in Goiás State (16°48′S, 49°21′W), within the core Cerrado biome at an elevation of 740-770 m. The predominant soil class is a dystrophic Red Latosol (Oxisol), characterized by deep weathering profiles, clay contents of 45-62%, and native pH values around 4.8-5.2 prior to liming [12] . The field has been under continuous soybeanmaize double-cropping since 2009, with annual applications of limestone (2 t/ha every three years), triple superphosphate, and potassium chloride. A seasonal stream crosses the southwestern corner, and a gentle 2-3% slope carries surface runoff northeast toward a retention pond.
Soil and Water Quality Analysis
Baseline characterization of the 0-20 cm layer showed a mean pH of 5.6, organic carbon of 22.4 g/kg, cation exchange capacity of 8.7 cmol/kg, and base saturation of 48.3%. Clay content averaged 54% with a coefficient of variation (CV) of 11%, confirming relatively uniform texture. Aluminum saturation ranged from 2% to 18%, with higher values in upslope positions where liming history was shorter.
Material and Methods
Material and Methods
Material
Soil samples were collected on 12-14 August 2022 from 240 geo-referenced points arranged on a 140 m regular grid. At each point, five sub-samples from within a 2 m radius were composited using a Dutch auger to a depth of 0-20 cm. Samples were air-dried, sieved to 2 mm, and shipped to the soil-testing laboratory at the Ulsan National University of Earth Sciences, Ulsan, South Korea, under phytosanitary import protocol. Total nitrogen was determined by the Kjeldahl method, available phosphorus by Mehlich-1 extraction, and exchangeable potassium by ammoniumacetate extraction at pH 7.0, all following the procedures of EMBRAPA [13] .
Methods
Exploratory data analysis included calculation of mean, median, CV, skewness, and kurtosis. Phosphorus data were log-transformed to approximate normality before geostatistical modelling. Experimental semivariograms were computed using the gstat package in R 4.3.0 with 15 lag classes at 140 m intervals [14] . Spherical models were fitted by weighted least squares, and spatial-dependence ratios (nugget / sill) were classified as strong (< 0.25), moderate (0.25-0.75), or weak (> 0.75) following Cambardella et al. [15] . Ordinary kriging on a 30 m prediction grid produced nutrient maps, and leave-one-out cross-validation assessed prediction accuracy via mean error and root-mean-square error. All maps were projected to SIRGAS 2000 / UTM Zone 22S. Phosphorus showed the highest relative variability (CV = 42.7%) and a pronounced right skew (1.13), reflecting localized pockets of P accumulation near the stream margin where erosion deposits concentrate organic-bound P. Potassium was the least variable (CV = 28.4%), consistent with its relatively mobile behavior in the soil solution that tends to smooth out spatial differences over time. The transect confirms a consistent decline from southwest to northeast for all three nutrients. The southwest corner, adjacent to the seasonal stream, accumulates organic-rich runoff deposits that elevate N and P. Potassium follows a similar though less steep gradient, likely reflecting differential K-fertilizer response on deeper soil profiles upslope.
Results
Results
Discussion
The spatial-dependence ratios reported here (0.19-0.31) are consistent with those found by Montanari et al. [6] in a nearby Cerrado Oxisol, who reported moderate dependence for N and K and strong dependence for P under sugarcane.
The key message for farm management is that uniform-rate fertilizer application would simultaneously over-supply the nutrient-rich southwestern zone and under-supply the northeastern upslope zone, wasting input and potentially contaminating shallow groundwater via excess P leaching near the stream [16] .
The ranges of autocorrelation-780 to 1,040 m-are somewhat longer than the 400-600 m ranges typically observed in temperate soils [17] . This may reflect the deep, uniform clay profiles of Cerrado Oxisols, which buffer short-range variation and allow broader-scale gradients driven by topography and organic-matter redistribution to dominate [18] . From a practical standpoint, the relatively long ranges mean that variable-rate zones can be defined at management-unit sizes of 5-10 hectares without losing meaningful precision-a resolution compatible with GPSguided spreaders already common in the region. Cross-validation results add confidence: mean errors for all three nutrients were near zero (0.04, -0.02, 0.11 mg/kg), and root-mean-square standardized errors clustered near 1.0, indicating that the kriging variance estimates are reliable [19] . One limitation is that the single sampling date captures only a snapshot; seasonal dynamics driven by fertilizer application timing and crop uptake may shift the spatial pattern, and repeated sampling across cropping stages would strengthen management recommendations [20] . A further consideration is the cost-effectiveness of geostatistical mapping at this grid density. At 240 sample points for 480 hectares, the analytical cost amounts to roughly USD 3.50 per hectare-a modest investment when set against the savings achievable through variable-rate application, which have been estimated at 8-14% of total fertilizer expenditure in Cerrado systems [21] .
Conclusion
Geostatistical analysis of 240 soil samples across a 480hectare Cerrado soybean-maize field revealed moderate-tostrong spatial dependence for nitrogen, phosphorus, and potassium, with ranges of autocorrelation between 780 and 1,040 m. Kriged maps identified a clear southwest-tonortheast nutrient gradient tied to topographic redistribution of organic matter, and cross-validation confirmed unbiased prediction. These findings provide a direct basis for variable-rate fertilizer prescription: the southwestern zone should receive reduced applications, while the northeastern upslope zone requires supplementation-particularly of phosphorus, which showed the strongest spatial structure and the steepest decline. For Cerrado producers, the practical takeaway is that a 140 m sampling grid is dense enough to resolve managementrelevant nutrient zones, and the investment in sampling and analysis is small relative to the fertilizer savings achievable through site-specific application. Future work should extend this approach to micronutrients and to temporal monitoring across multiple cropping seasons.
Acknowledgement
Acknowledgements Funding SourcesSupported by faculty research grants for precision agriculture investigations. Institutional SupportThe authors acknowledge the Department of Geosciences, Ulsan National University of Earth Sciences, Ulsan, South Korea, for analytical facilities.
Figures and tables from the paper
| Nutrient | Mean | Median | CV (%) | Skewness | Min | Max |
|---|---|---|---|---|---|---|
| N (mg/kg) | 28.6 | 27.4 | 31.2 | 0.41 | 11.8 | 48.7 |
| P (mg/kg) | 12.4 | 11.1 | 42.7 | 1.13 | 3.2 | 34.6 |
| K (mg/kg) | 114.3 | 109.8 | 28.4 | 0.67 | 52.1 | 198.4 |
Table text extracted from the original PDF; superscript letters are shown inline. The original table image is below.
View original table image
| Nutrient | Nugget | Sill | Range (m) | Nugget/Sill | Dependence |
|---|---|---|---|---|---|
| N | 39.8 | 142.1 | 920 | 0.28 | Moderate |
| P | 24.3 | 128.7 | 780 | 0.19 | Strong |
| K | 44.6 | 143.9 | 1040 | 0.31 | Moderate |
Table text extracted from the original PDF; superscript letters are shown inline. The original table image is below.
View original table image
References
20 in the original paper- Klink CA, Machado RB. Conservation of the Brazilian Cerrado. Conservation Biology. 2005;19(3):707-713.
- CONAB. Acompanhamento da Safra Brasileira de Grãos. Companhia Nacional de Abastecimento. 2023;Brasília:v.10.
- Lopes AS, Guilherme LRG. A career perspective on soil management in the Cerrado region of Brazil. Advances in Agronomy. 2016;137:1-72.
- Matheron G. Principles of geostatistics. Economic Geology. 1963;58(8):1246-1266.
- Webster R, Oliver MA. Geostatistics for Environmental Scientists. 2nd ed. Wiley. 2007;Chichester:1-315.
- Montanari R, Pereira GT, Marques J, Souza ZM, Pazeto RJ, Camargo LA. Variabilidade espacial de atributos químicos em Latossolo e Argissolo. Ciência Rural. 2008;38(5):1266-1272.
- Cherubin MR, Santi AL, Eitelwein MT, Amado TJC, Simon DH, Damian JM. Sampling grid size for characterizing spatial variability of phosphorus and potassium in Oxisol. Pesquisa Agropecuária Brasileira. 2015;50(2):168-177.
- Kerry R, Oliver MA. Average variograms to guide soil sampling. International Journal of Applied Earth Observation and Geoinformation. 2004;5(4):307-325.
- Nanni MR, Demattê JAM, Fiorio PR. Soil variability analysis using geostatistical and remote sensing approaches. Scientia Agricola. 2004;61(5):509-516.
- Goovaerts P. Geostatistics for Natural Resources Evaluation. Oxford University Press. 1997;New York:1-483.
- Ker JC. Latossolos do Brasil: uma revisão. Geonomos. 1997;5(1):17-40.
- EMBRAPA. Sistema Brasileiro de Classificação de Solos. 5th ed. Embrapa. 2018;Brasília:1-356.
- Pebesma EJ. Multivariable geostatistics in S: the gstat package. Computers and Geosciences. 2004;30(7):683691.
- Cambardella CA, Moorman TB, Novak JM, Parkin TB, Karlen DL, Turco RF, et al. Field-scale variability of soil properties in central Iowa soils. Soil Science Society of America Journal. 1994;58(5):1501-1511.
- Siqueira DS, Marques J, Pereira GT. The use of landforms to predict the variability of soil and orange attributes. Geoderma. 2010;155(1-2):55-66.
- Burgess TM, Webster R. Optimal interpolation and isarithmic mapping of soil properties: I The semivariogram and punctual kriging. Journal of Soil Science. 1980;31(2):315-331.
- Souza ZM, Marques J, Pereira GT, Barbieri DM. Spatial variability of soil physical and mineralogical properties. Bragantia. 2006;65(4):711-719.
- Vieira SR, Hatfield JL, Nielsen DR, Biggar JW. Geostatistical theory and application to variability of some agronomic properties. Hilgardia. 1983;51(3):1-75.
- Corá JE, Araujo AV, Pereira GT, Beraldo JMG. Soil attribute variability in sugarcane fields. Revista Brasileira de Ciência do Solo. 2004;28(2):369-378.
- Bongiovanni R, Lowenberg-DeBoer J. Precision agriculture and sustainability. Precision Agriculture. 2004;5(4):359-387.