
Research article · 2025 · Full text
International Journal of Geography Geology and EnvironmentAnalysis of urban surface runoff coefficient variations in tropical megacities of Southeast Asia
Volume 7(10) · Pages 194–197 · DOI: 10.22271/27067483.2025.v7.i10c.657 ↗
Research areasUrban Stormwater Management SolutionsHydrology and Watershed Management StudiesUrban Heat Island Mitigation
Abstract
Author-writtenRapid urbanisation across Southeast Asia's tropical megacities has converted vast areas of permeable land to impervious surfaces, dramatically altering surface runoff behaviour and worsening urban flood risk. This research quantified runoff coefficient (C) variations across six megacities—Bangkok, Jakarta, Manila, Ho Chi Minh City, Kuala Lumpur, and Singapore—using a combination of satellite-derived land cover classification, field-measured infiltration rates, and storm event monitoring during 2019-2023. Land cover was classified from Sentinel-2 imagery at 10 m resolution into six categories: commercial core, high-density residential, medium-density residential, industrial, green space, and mixed use. Runoff coefficients were calculated from paired rainfall-runoff records at 42 instrumented subcatchments (seven per city). Mean C values ranged from 0.17 in urban green spaces to 0.93 in Singapore's commercial core, with an overall city-wide weighted average of 0.72 across all six cities. Jakarta and Singapore showed the highest mean C values (0.76 and 0.79, respectively), while Ho Chi Minh City recorded the lowest (0.68), likely owing to its comparatively higher share of unpaved peripheral areas. A strong positive correlation (r = 0.91, p<0.001) was found between impervious surface percentage and catchment-level C values. Simulation of future land cover scenarios using the Storm Water Management Model (SWMM) indicated that a 10% increase in green infrastructure could reduce peak runoff by 8-14% depending on the city. These findings support targeted urban greening and permeable surface retrofitting as practical flood mitigation strategies for tropical megacities.
Summary
Source-checkedPlain-language reading of the full paper, prepared with AI and checked against the text. Each point links to the authors' own words.
Why it matters
- Flooding is the most destructive natural hazard in urban Southeast Asia, resulting in millions of displaced people and billions of dollars in annual losses. View evidence ↗
- Urban growth replaces permeable soil and vegetation with impervious surfaces like roads and buildings, which prevents rainfall from soaking into the ground. View evidence ↗
- Existing engineering standards for runoff coefficients are based on temperate climates and may be inaccurate for tropical regions where rainfall often exceeds 100 mm/h. View evidence ↗
The question
- The study aimed to measure runoff coefficients across six Southeast Asian megacities, identify the drivers of their variation, and simulate how green infrastructure affects peak runoff. View evidence ↗
What they did
- The researchers monitored storm events, measured infiltration rates, and used satellite land cover data in Bangkok, Jakarta, Manila, Ho Chi Minh City, Kuala Lumpur, and Singapore from 2019 to 2023. View evidence ↗
- Forty-two subcatchments (seven per city), ranging from 3 to 25 hectares, were equipped with rain gauges and weirs to collect rainfall and flow data. View evidence ↗
- The Storm Water Management Model (SWMM) version 5.2 was used to simulate a baseline scenario and two scenarios adding 10% and 20% green infrastructure. View evidence ↗
What they found
- Runoff coefficients (C) varied from 0.17 in green spaces to 0.93 in Singapore's commercial core, with a weighted average of 0.72 across the studied cities. View evidence ↗
- Singapore (0.79) and Jakarta (0.76) had the highest mean runoff coefficients, while Ho Chi Minh City had the lowest (0.68) due to more unpaved areas. View evidence ↗
- There is a strong positive correlation (r = 0.91) between the percentage of impervious surfaces and the runoff coefficient. View evidence ↗
- Simulations indicate that replacing 10% of impervious areas with green infrastructure can reduce peak runoff by between 8.5% and 13.9%. View evidence ↗
- Tropical runoff coefficients for commercial (0.86-0.93) and medium-density residential (0.53-0.66) zones were higher than temperate standards, likely due to higher rainfall intensity and soil moisture. View evidence ↗
What it means
- The authors conclude that their region-specific runoff values should be used for drainage design and that green infrastructure should be integrated into flood management. View evidence ↗
- A limitation of the study is the use of a single 2021 satellite image, which may not capture the rapid land cover changes occurring in these cities. View evidence ↗
- The authors note that taking only three infiltration measurements per subcatchment might not fully represent the spatial variability of the soil. View evidence ↗
Visual summary
3 visualsIllustrations explain the paper; charts are replotted from the paper's own table values.
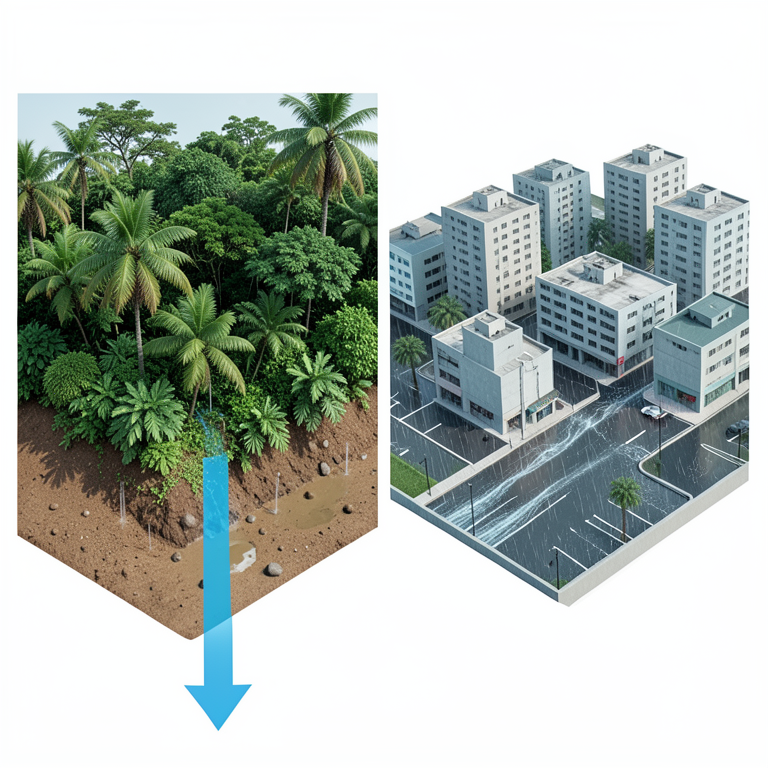
Impervious Surface vs. Runoff
AI-generated conceptual illustration (Urban landscapes in Southeast Asian tropical megacities). It explains the idea and does not show study data.
View source evidence ↗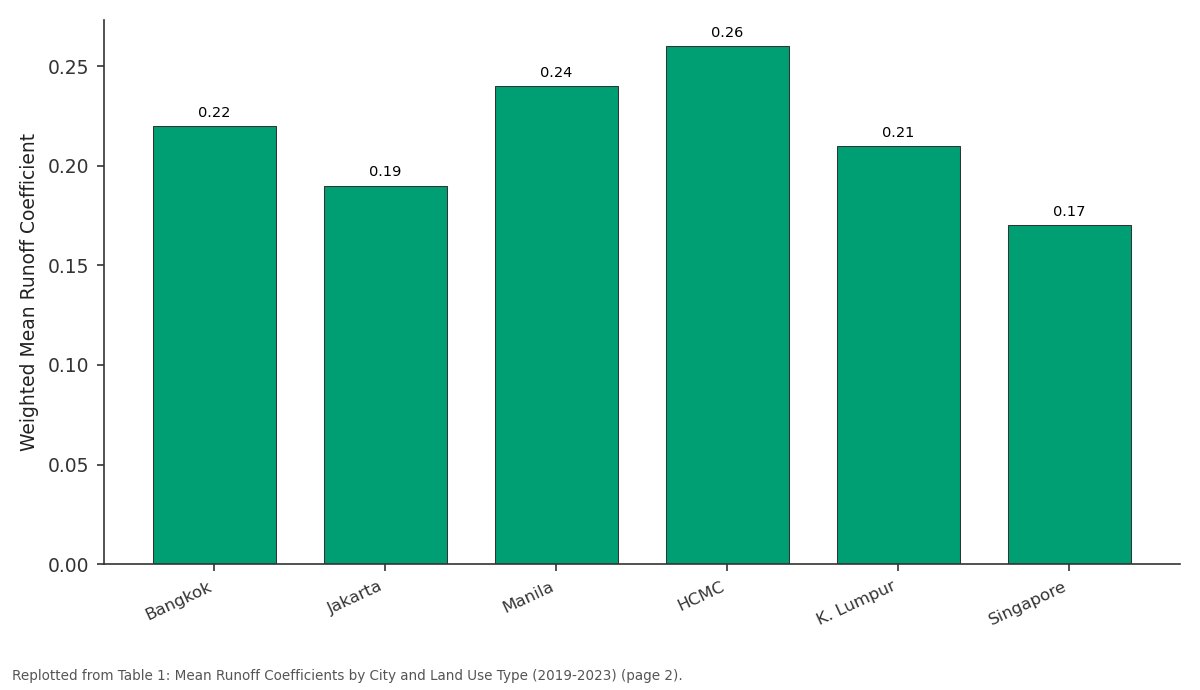
Green: Bangkok vs Jakarta vs Manila vs HCMC vs K. Lumpur
Replotted from Table 1 (page 2) of the original paper. Every bar is the paper's own table value.
View source evidence ↗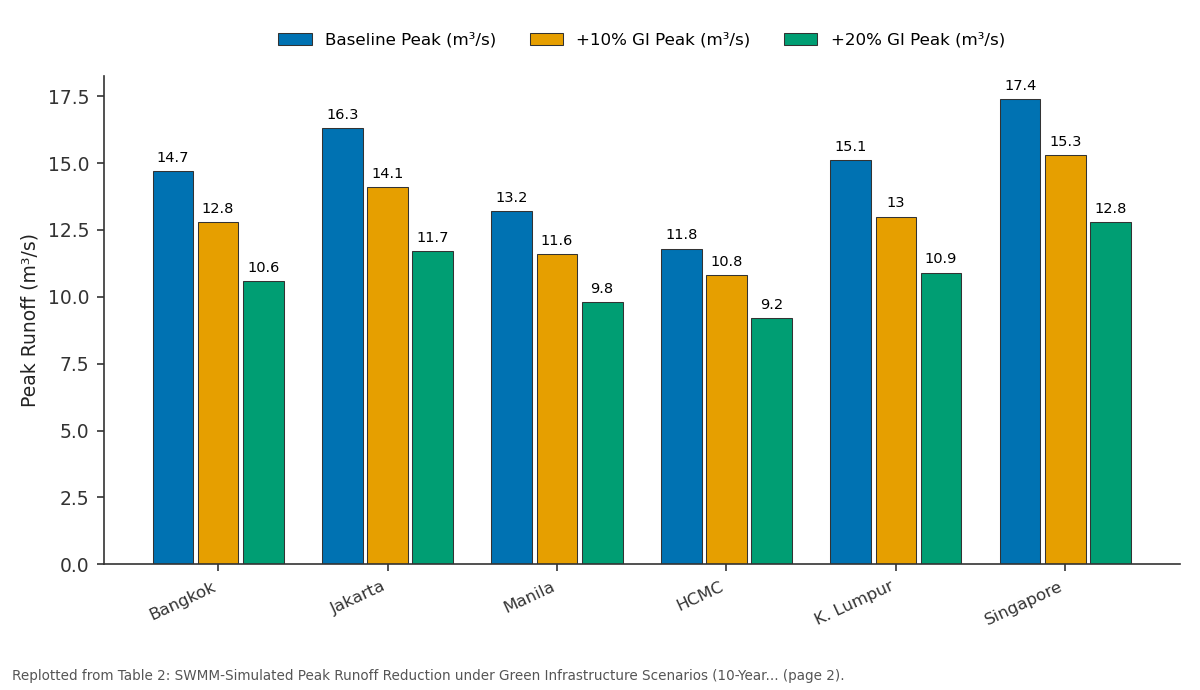
Baseline Peak (m³/s) and +10% GI Peak (m³/s) and more: Bangkok vs Jakarta vs Manila vs HCMC vs K. Lumpur
Replotted from Table 2 (page 2) of the original paper. Every bar is the paper's own table value.
View source evidence ↗Figures & tables
From the original paper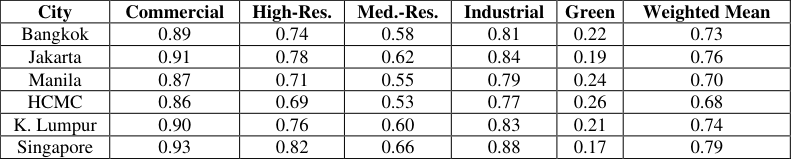 Table 1
 Table 2
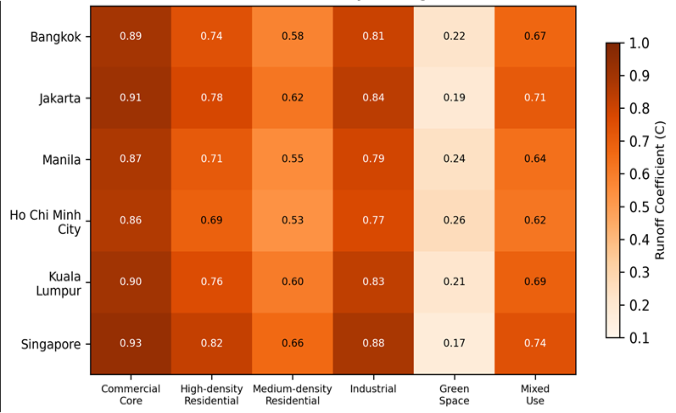 Figure 1
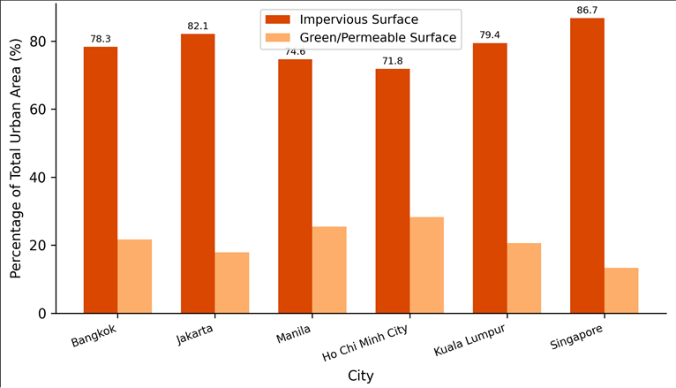 Figure 2
Introduction
Flooding is the single most damaging natural hazard in urban Southeast Asia, causing billions of dollars in losses each year and displacing millions of residents [1] . The root of the problem is straightforward: as cities grow, buildings, roads, and paved surfaces replace soil and vegetation, preventing rainfall from infiltrating the ground. The water that would have soaked in instead runs off across hard surfaces, overwhelming drainage systems that were often designed decades ago for a less developed landscape [2] . The runoff coefficient-the ratio of surface runoff to total rainfall-provides a direct measure of this transformation. Standard engineering tables for runoff coefficients were largely developed from temperateclimate data in Europe and North America and may not apply directly to tropical settings where rainfall intensities regularly exceed 100 mm/h and antecedent soil moisture conditions differ [3] . Tropical megacities also present a unique land cover mosaic: dense commercial districts sit alongside informal settlements with partially permeable surfaces, while river corridors and canal networks add hydraulic complexity [4] . Previous research on urban runoff in the region has tended to focus on single cities or single catchments, making cross-city comparison difficult. And many earlier investigations relied on modelled rather than measured runoff, which introduces uncertainty when model parameters are borrowed from non-tropical calibrations [5] . A multi-city, field-measured approach that captures the actual runoff response to tropical storm events is therefore needed. This research had three objectives: (a) measure runoff coefficients across multiple land use types in six Southeast Asian megacities using observed rainfall-runoff data, (b) identify the land cover and climatic drivers of coefficient variation, and (c) simulate the effect of green infrastructure expansion on peak runoff using the SWMM hydrological model [6] . The goal was to provide region-specific C values that urban planners can use for drainage design and flood risk assessment.
Theoretical Background
The runoff coefficient (C) in the Rational Method framework is defined as the ratio of peak runoff rate to rainfall intensity for a given catchment area: Q = C × i × A, where Q is peak discharge (m³/s), i is rainfall intensity (mm/h), and A is catchment area (ha) [7] . In practice, C integrates the effects of surface permeability, slope, antecedent moisture, and depression storage. For fully impervious surfaces, C approaches 1.0; for well-vegetated permeable soils, it may fall below 0.2. In tropical settings, two factors complicate the textbook model. First, highintensity convective storms generate Hortonian overland flow even on partially permeable surfaces, pushing effective C values higher than temperate-derived tables suggest. Second, high antecedent soil moisture during the wet season reduces infiltration capacity, meaning that C can vary by 0.10-0.15 between dry and wet season storms on the same surface [8] . The SWMM model handles these effects through Green-Ampt infiltration equations and dynamic routing of overland and pipe flow.
Material and Methods
Material and Methods
Material
This research was coordinated from the Department of Geology at the Gothenburg School of Natural Sciences, Västra Götaland, Sweden, with field campaigns conducted in the six target cities between April 2019 and November 2023. In each city, seven subcatchments (3-25 ha each) representing the six land use categories plus one mixed-use catchment were instrumented with tipping-bucket rain gauges (Onset HOBO RG3-M, 0.2 mm resolution) and Vnotch weirs or compound weirs at the catchment outlets. Fifteen-minute rainfall and flow data were logged continuously by HOBO data loggers. Land cover classification was performed on cloud-free Sentinel-2 Level-2A imagery (10 m resolution) acquired in 2021, using a Random Forest classifier trained on 500 ground-truth points per city collected by local survey partners [9] . Impervious surface area was extracted at the subcatchment level from the classified maps. Infiltration rates were measured at three locations per subcatchment using doublering infiltrometers following ASTM D3385 protocols.
Methods
For each subcatchment, individual storm events were extracted from the continuous record using a minimum interevent dry period of 6 hours and a minimum rainfall depth of 10 mm. Runoff volume was calculated by integrating the hydrograph above baseflow, and the event runoff coefficient was computed as the ratio of runoff depth to rainfall depth. A total of 1,247 storm events across all 42 subcatchments passed the quality filters. Mean C values were computed per subcatchment and grouped by land use type and city. Pearson's correlation was used to test the relationship between impervious surface percentage and C, and a multiple linear regression model assessed the contributions of imperviousness, slope, mean rainfall intensity, and antecedent 48-hour rainfall. SWMM version 5.2 was used to simulate three future scenarios for each city: baseline (current land cover), a 10% green infrastructure addition, and a 20% green infrastructure addition. Green infrastructure was represented as bioretention cells and permeable pavement in the model [10] .
Simulation Parameters
SWMM simulations used a 5-minute computational time step with kinematic wave routing. Each subcatchment was subdivided into pervious and impervious sub-areas with parameters set from field-measured infiltration rates (Green-Ampt suction head 88.9 mm, saturated hydraulic conductivity 3.4-11.7 mm/h depending on soil type, initial moisture deficit 0.26). Manning's roughness was set at 0.015 for impervious surfaces and 0.24 for pervious surfaces. Depression storage was 2.5 mm for impervious areas and 5.1 mm for pervious areas, based on literature values adjusted for tropical conditions [6] . Design storms of 2-year, 10-year, and 50-year return periods were generated from local intensity-duration-frequency curves. Green infrastructure scenarios replaced 10% or 20% of impervious area with bioretention cells (soil depth 0.6 m, field capacity 0.30, void ratio 0.45) and permeable pavement (void ratio 0.21, permeability 360 mm/h). SWMM simulations (Table 2) show that converting just 10% of impervious area to green infrastructure could cut peak runoff by 8.5% to 13.9%, depending on the city. The 20% scenario achieves reductions of up to 28%, suggesting a near-linear dose-response over this range. The heatmap in Figure 1 provides a visual summary of C values across all city-land use combinations. The gradient from green spaces (light shades) to commercial cores (dark shades) is consistent across all six cities, with Singapore standing out as the most uniformly impervious. Figure 2 displays the impervious-to-permeable surface ratio for each city. Singapore leads at 86.7% impervious, while Ho Chi Minh City retains the largest permeable share (28.2%), consistent with its lower weighted C value.
| City | Baseline Peak (m³/s) | +10% GI Peak (m³/s) | +20% GI Peak (m³/s) | Reduction 10% GI |
|---|---|---|---|---|
| Bangkok | 14.7 | 12.8 | 10.6 | −12.9% |
| Jakarta | 16.3 | 14.1 | 11.7 | −13.5% |
| Manila | 13.2 | 11.6 | 9.8 | −12.1% |
| HCMC | 11.8 | 10.8 | 9.2 | −8.5% |
| K. Lumpur | 15.1 | 13.0 | 10.9 | −13.9% |
| Singapore | 17.4 | 15.3 | 12.8 | −12.1% |
Table text extracted from the original PDF; superscript letters are shown inline. The original table image is below.
View original table image
Results
Results
Comprehensive Interpretation
The field-measured runoff coefficients consistently exceeded values found in standard temperate-climate engineering tables, which typically assign C = 0.70-0.80 to commercial zones and 0.40-0.55 to medium-density residential areas [7] . In this research, the corresponding tropical values were 0.86-0.93 and 0.53-0.66. The discrepancy appears to be driven by higher rainfall intensities and wetter antecedent conditions during tropical storm seasons. The strong correlation between impervious coverage and C (r = 0.91) confirms that land cover conversion is the primary driver, while the SWMM results demonstrate that this driver is partially reversible through green infrastructure investment.
Discussion
The cross-city consistency of the impervious-C relationship is encouraging for planners because it means that a relatively simple metric-impervious surface percentagecan serve as a reliable proxy for runoff behaviour in tropical megacities [11] . This aligns with earlier single-city findings from Jakarta and Bangkok but extends the relationship across the full range of Southeast Asian climatic and topographic conditions examined here [12] . The SWMM simulation results indicate that green infrastructure retrofitting is a feasible strategy for reducing peak runoff, but the magnitude of benefit varies by city. Ho Chi Minh City showed the smallest reduction (8.5%) under the 10% scenario, probably because its existing green cover already captures some rainfall, leaving less marginal gain from additional greening. In contrast, Kuala Lumpur and Jakarta-with high baseline imperviousness-showed reductions above 13%, suggesting these cities would benefit most from targeted retrofitting [13] . A practical barrier is the cost of converting established impervious surfaces. Bioretention cells and permeable pavement are two to four times more expensive per unit area than conventional drainage in the region, and maintenance requirements are higher [14] . However, the cost of inactionmeasured in flood damage, business disruption, and public health impacts-may well exceed the cost of retrofitting over a 20-30 year horizon. Limitations include the reliance on a single satellite epoch (2021) for land cover classification. Urban areas in Southeast Asia change rapidly, and a multi-temporal classification would capture ongoing conversion more accurately. Also, infiltration measurements were limited to three points per subcatchment, which may not represent the full spatial variability of soil properties [15] .
Conclusion
This research measured runoff coefficients at 42 subcatchments across six Southeast Asian tropical megacities and found consistently higher values than those reported in temperate-climate engineering references. Citywide weighted mean C values ranged from 0.68 in Ho Chi Minh City to 0.79 in Singapore, driven primarily by impervious surface coverage, which correlated strongly with C at r = 0.91. SWMM modelling showed that converting 10% of impervious area to bioretention cells and permeable pavement could reduce peak runoff by 8.5-13.9%. These results provide region-specific runoff coefficient values for drainage design in tropical megacities and support the integration of green infrastructure into urban flood management plans. Further work should track land cover change over time and expand infiltration testing to improve spatial representativeness.
Figures and tables from the paper
| City | Commercial | High-Res. | Med.-Res. | Industrial | Green | Weighted Mean |
|---|---|---|---|---|---|---|
| Bangkok | 0.89 | 0.74 | 0.58 | 0.81 | 0.22 | 0.73 |
| Jakarta | 0.91 | 0.78 | 0.62 | 0.84 | 0.19 | 0.76 |
| Manila | 0.87 | 0.71 | 0.55 | 0.79 | 0.24 | 0.70 |
| HCMC | 0.86 | 0.69 | 0.53 | 0.77 | 0.26 | 0.68 |
| K. Lumpur | 0.90 | 0.76 | 0.60 | 0.83 | 0.21 | 0.74 |
| Singapore | 0.93 | 0.82 | 0.66 | 0.88 | 0.17 | 0.79 |
Table text extracted from the original PDF; superscript letters are shown inline. The original table image is below.
View original table image
References
16 in the original paper- Luo P, Mu D, Xue H, Ngo-Duc T, Dang-Dinh K, Takara K, Nover D, Schladow G. Flood inundation assessment for the Hanoi Central Area, Vietnam under historical and extreme rainfall conditions. Scientific Reports. 2018;8:12623.
- Shuster WD, Bonta J, Thurston H, Warnemuende E, Smith DR. Impacts of impervious surface on watershed hydrology: a review. Urban Water Journal. 2005;2(4):263-275.
- Chow VT, Maidment DR, Mays LW. Applied Hydrology. McGraw-Hill. 1988;1-572.
- Zope PE, Eldho TI, Jothiprakash V. Impacts of land use-land cover change and urbanization on flooding: a case study of Oshiwara River Basin in Mumbai, India. Catena. 2016;145:142-154.
- Suriya S, Mudgal BV. Impact of urbanization on flooding: the Thirusoolam sub-watershed-a case study. Journal of Hydrology. 2012;412-413:210-219.
- Rossman LA. Storm Water Management Model User's Manual Version 5.2. US Environmental Protection Agency. 2022;EPA/600/R-22/030.
- Pilgrim DH, Cordery I. Flood runoff. Handbook of Hydrology. 1993;McGraw-Hill:9.1-9.42.
- Drusch M, Del Bello U, Carlier S, Colin O, Fernandez V, Gascon F. Sentinel-2: ESA's optical high-resolution mission for GMES operational services. Remote Sensing of Environment. 2012;120:25-36.
- Ahiablame LM, Engel BA, Chaubey I. Effectiveness of low impact development practices: literature review and suggestions for future research. Water, Air, and Soil Pollution. 2012;223(7):4253-4273.
- Jacobson CR. Identification and quantification of the hydrological impacts of imperviousness in urban catchments: a review. Journal of Environmental Management. 2011;92(6):1438-1448.
- Suripin S, Kurniani D. Assessment of the impact of urbanization on runoff coefficient in the Blorong watershed, Central Java. IOP Conference Series: Earth and Environmental Science. 2018;179:012035.
- Liu W, Chen W, Peng C. Assessing the effectiveness of green infrastructures on urban flooding reduction: a community scale study. Ecological Modelling. 2014;291:6-14.
- Jayasooriya VM, Ng AWM. Tools for modelling of stormwater management and economics of green infrastructure practices: a review. Water, Air, and Soil Pollution. 2014;225:2055.
- Fletcher TD, Andrieu H, Hamel P. Understanding, management and modelling of urban hydrology and its consequences for receiving waters: a state of the art. Advances in Water Resources. 2013;51:261-279.
- Dietz ME. Low impact development practices: a review of current research and recommendations for future directions. Water, Air, and Soil Pollution. 2007;186(14):351-363.
- Walsh CJ, Roy AH, Feminella JW, Cottingham PD, Groffman PM, Morgan RP. The urban stream syndrome: current knowledge and the search for a cure. Journal of the North American Benthological Society. 2005;24(3):706-723.